Publisher’s version / Version de l'éditeur:
Vous avez des questions? Nous pouvons vous aider. Pour communiquer directement avec un auteur, consultez la première page de la revue dans laquelle son article a été publié afin de trouver ses coordonnées. Si vous n’arrivez pas à les repérer, communiquez avec nous à [email protected].
Questions? Contact the NRC Publications Archive team at
[email protected]. If you wish to email the authors directly, please see the first page of the publication for their contact information.
https://publications-cnrc.canada.ca/fra/droits
L’accès à ce site Web et l’utilisation de son contenu sont assujettis aux conditions présentées dans le site LISEZ CES CONDITIONS ATTENTIVEMENT AVANT D’UTILISER CE SITE WEB.
Paper (National Research Council of Canada. Institute for Research in Construction); no. IRC-P-1386, 1986
READ THESE TERMS AND CONDITIONS CAREFULLY BEFORE USING THIS WEBSITE. https://nrc-publications.canada.ca/eng/copyright
NRC Publications Archive Record / Notice des Archives des publications du CNRC : https://nrc-publications.canada.ca/eng/view/object/?id=f1621755-c032-41b1-b72e-23d1a9b1c7e2 https://publications-cnrc.canada.ca/fra/voir/objet/?id=f1621755-c032-41b1-b72e-23d1a9b1c7e2
NRC Publications Archive
Archives des publications du CNRC
This publication could be one of several versions: author’s original, accepted manuscript or the publisher’s version. / La version de cette publication peut être l’une des suivantes : la version prépublication de l’auteur, la version acceptée du manuscrit ou la version de l’éditeur.
For the publisher’s version, please access the DOI link below./ Pour consulter la version de l’éditeur, utilisez le lien DOI ci-dessous.
https://doi.org/10.4224/40001812
Access and use of this website and the material on it are subject to the Terms and Conditions set forth at
Measurement of off-gases from urea formaldehyde foam insulation
Tsuchiya, Y.; Dussault, R. P.; Rolfe, S. J.; Khan, T. R.; Shirtliffe, C. J.
ier IH1
N2ld
r .
1386
National Research Conseil national1. 2
I*
Council Canada de recherches CanadaInstitute for lnstitut de
Research in recherche en
Construction construction
Measurement of Off-Gases from Urea
Formaldehyde Foam lnsula tion
by Y. Tsuchiya, R. Dussault, S.J. Rolfe et al
Reprinted from
Transactions, l ndoor Air Quality in Cold Climates: Hazards and Abatement Measures
APCA Specialty Conference Ottawa, Ontario, April 1985 p. 208
-
223(IRC Paper No. 1386)
APi A L Y Z E D Price $3.00 NRCC 25997
-
I - NAC-
BLDG. RES. L I B R A R YI
&s&
Apres avoir prelevg des Qchantillons de gaz autres que le formaldghyde et les hydrocarbures gmis par sept 6chantillons de mousse isolante d'urge-form1 (MIUF), on les a identifies et on a estimg leurs concentrations. Les resultats obtenus par chromatographie gazeuse sur colonne c a p i l l a i r e l s p e c t r o m ~ t r i e de masse (CGISM) sont compargs 3 ceux obtenus par spectromgtrie de masse (en tandem) par ionisation chimique en pression atmosphgrique (ICPA/SM/SM). Vingt constituants de gaz de MIUF ont St6 identifies et leurs concentations estimges par CGISM. Vingt-deux ont QtQ identif i6s et la concentrat ion de douze d'entre eux estimge par ICPAISMISM. Sept constituants ont Qt6 analyses par les deux techniques. Les auteurs cornparent les r6sultats obtenus aux concentrations limites admissibles, ou 3
leurs valeurs estimatives, en vue de dgterminer les gaz qui devraient &re ,-nn+-ftlg= n+ A- t ~ g f i n i r 1% ensibilit6 et
l'gventail rec odes
-
- --
-
MEASUREMENT OF OFF-GASES
FROM UREA FORMALDEHYDE FOAM INSULATION
Y. Tsuchiya,
-
R. Dussault, S.J. Rolfe, T.R. Khan and C.J. Shirtliffe,
Division of Building Research, National Research Council Canada, Ottawa
Gases other than formaldehyde and hydrocarbons emitted by seven samples of four makes of urea formaldehyde foam insulation (UFFI) have been sampled, identified, and their concentrations estimated. Results by capillary column gas chromatography/mass spectrometry (GCIMS) of 80°C head space UFFI gases are compared to results by atmospheric pressure chemical ionization tandem mass spectrometry (APCIIMSIMS) of UFFI gases purged at 23OC. Estimates of the reproducibility of the two apparatus at the test conditions were made. Twenty components of UFFI gases from these foams were identified and their concentrations estimated by GCIMS. Twenty-two were identified and the concentration of twelve estimated by APCIIMSIMS. Seven were common to both. Results are compared to threshold limit values, or their estimates in order to select the gases that should be monitored in houses and to define the required range and sensitivity for such methods.
In both sets of measurements, acetic acid, dioxane, ethylene glycol, and methyl furfural were found in quantities that approached or exceeded a TLV1100 or 0.01 TLV that was established as a 'benchmark' or reference level. The APCI measurements also indicated that acetaldehyde and formic acid were of similar concentrations. The GC/MS results indicated that at a higher temperature, dibutylphthalate, dichlorobenzene, 2-fury1 methanol, and naphthalene are emitted in quantities that exceed their respective reference concentrations by factors of between 5 and 240. Common household gases appeared to have been stored on UFFI and to be released during tests.
Reprinted with permission from the transactions Indoor Air Quality in Cold Climates: Hazards and Abatement Measures, - published in 1986 by the Air Pollution Control Association.
MEASUREMENT OF TRACE OFF-GASES FROM UREA FORMALDEHYDE FOAM INSULATION
Introduction
In reviewing the urea formaldehyde foam insulation (UFFI) problem in Canadian homes, the Federal government's House of Commons Standing Committee on Health, Welfare and Social Affairs in its final report stated "perhaps the most urgent question is the effect of UFFI on the health of individuals exposed to UFFI gases including formaldehyde, on a continuous basis
".
lAlthough formaldehyde is a major gas released by UFFI and is a carcinogen in animals, the incidences of health complaints commonly associated with UFFI homes may not be due solely to this c~ntaminant.~
Substantial evidence indicates that terminal methyl01 groups present in UF resins undergo elimination and the more susceptible ether and methylene linkages hydrolyze, liberating formaldehyde and relatively low molecular weight polymer fragments. Furthermore, unreacted urea and formaldehyde and the impurities associated with them, plus the proprietary additives that are added to the crude resin, constitute a potential source of increased emission.
In addition to chemical degradation of the polymer, biodegradation (by living organisms) also occurs. Evidence now indicates that moisture creates conditions favourable for fungal growth on urea formaldehyde foam. These microorganisms play an eminent role in the decomposition of synthetic polymers into smaller molecules that can be released into the atmosphere.5 Concerns that the characteristic odour in houses insulated with UFFI was not only from formaldehyde, and a study of the basic UFFI chemistry, led to the search for other substances, including particles, that may be released.
This paper describes the development of methodology for sampling and the investigation of off-gases emitted from urea formaldehyde foams that had either been removed from the wall cavities of houses or cut from simulated wall panels that had been foamed in the laboratory using commercial
formulations. The estimated off-gas concentrations were compared with current threshold limit values (TLV's) divided by 100 to establish which off-gases occurred at high enough levels to warrant measurement in houses. It should be noted that the 'benchmark' TLV1100 values are not intended to define acceptable or unacceptable exposures for human health or comfort.
Experimental
Description of Foam Samples
Four reference foam samples were prepared. Three of the reference foams had been foamed into 2.3 x 2.3 m wooden stud wall systems by manufacturers' representatives in 1976. The manufacturers were Rapco
Canada, Borden Chemicals Canada and Canada Foam Inc. The first two of these manufacturers produced much of the foam used to insulate wall cavities of Canadian homes. Exact formulations of these resin systems were not
provided. The fourth foam was produced in a laboratory with components obtained from one of the manufacturers and was 0.7 years old at the time of testing.
Four foam samples removed from UFFI houses during 1982-83 were also included in the study. Two of the foams, SM and VL, were from Quebec houses and were 4.5 years old. Two foams, D l and D2 were from Ontario houses and
were 3.5 years old. These foam samples were placed in 44-L polyethylene bags, tied securely and stored at 23OC and 50-70% RH for several months prior to testing.
Evaluation of Off -gas Sampling Techniques
Four sampling techniques were evaluated before selecting the final technique. These involve the use of cryogenic traps, adsorption tubes, equilibrium head-space and liquid impinger collection. The impinger method with aqueous sodium bisulfite, used for measurement of formaldehyde
emissions, was not considered adequate for the measurement of unknown off-gases, and will not be discussed.
Cryogenic Collection. Collection of off-gases at liquid nitrogen
temperatures with recirculated untrapped gases was used. The method was not successful. Large amounts of water were found in the condensed phase. This caused interference and affected the sensitivity of GC/MS measurements. The water which was accumulated in the cryotraps with off-gases originated from
the water adsorbed on the UFFI, which equaled 4% by weight at 11% RH and 50% by weight at 95% RH.
Adsorption Tube Sampling. Experiments were performed to sample air in wall cavities and room air in UFFI houses using Envirochem multisorbent tubes consisting of glass beads, Tenax, ~mbersorb 340, and activated charcoal. Air samples and blanks were taken in the field, thermally
desorbed several days later using a Universal Automated Concentrator System manufactured by Envirochem, and analyzed using Finnigan GC/MS/DS Model 3200. Of the 70 compounds detected, about 40 were present in the blanks at levels comparable to those found in exposed sample tubes. Another six were found in the blanks only. Duplicate samples produced different lists of compounds and the levels (peak areas) of each compound differed greatly. This
indicated blank or desorber problems and that the procedure used was not readily adaptable for collecting trace level contaminants in the field.
Head-Space Analysis. The third approach evaluated was head-space . analysis (HSA). It has been widely used in the GC for measurement of trace gases. In this method the sample equilibration temperature and the moisture content of the foam sample, and the adsorption capacities of both the container walls and the foam, affected the equilibrium vapor pressure and reduced the concentration of off-gases in head-space.
Few gases were detected with the GC/MS using room temperature head-space analysis. By increasing the head-space temperature to 80°C, the concentration increased to the point where a number of gases were identified and quantified. Simple theoretical considerations predicted an increase of eight in the vapor pressure of organic gases, and an increase of sixty-four in the rate of formation of gases produced by chemical reactions such as hydrolysis. The interim surface temperatures of the south- and west-facing wall cavities of a UFFI house in southern latitudes of Canada may exceed 70°C in summer months, so off-gas measurements conducted at temperatures of this magnitude were not atypical of results expected in field studies.
The MS/MS was designed to have volatiles introduced at a continous rate at atmospheric pressure into a 2-3 L/min regulated flow of the carrier gas. The techniques for sampling discussed above do not produce a
continuous flow, so they are incompatible with this instrument. A new sampling technique termed carrier gas stripping was therefore developed.
The development followed from observations made in the study of the emission of formaldehyde from urea formaldehyde foams. In the study, resistance to air flow through a slab of foam compacted to various
thicknesses from shredded samples had been measured. The results indicated only a small pressure drop across the foam specimen at the flow rate used for introducing a sample into the MSIMS. Thus, it was possible to sample off-gases by forcing a 1 to 2 L/min stream of the carrier gas through a specimen of foam of 40 mm in diameter and approximately 50 mm in thickness, directly into the MS/MS. The technique was developed and used for sampling and analyzing off-gases by MS/MS.
Instrumentation
GC/MS. The HP Model 5993 Capillary GC/MS was used for the 80°C head-space analysis. Samples were injected into the capillary column through a splitless injector. The carrier gas was He, set at- 180 Pa (25 psi). The GC/MS interface was maintained at 280°C and the injection port at 200°C. The MS was autotuned with the ions of perfluorotributylamine (PFTBA) and normalized to dodecafluorotriphenyl phosphine, a standard
accepted by USEPA for EI/MS.
MSIMS. The TAGA 6000 Atmospheric Pressure Chemical Ionization
(APCI)/MS/MS
was used because it was sensitive to some trace compounds atsub-picogram levels and the technique was complementary to GC/MS in the identification of the species.8 It had the capability to analyze complex materials such as environmental and biological mixtures in the presence of water vapor. The TAGA 6000 MS/MS consists of a triple quadrupole mass spectrometer and an ultra-high capacity cryogenic pump. The system scans full spectrum at a rate of several scans per minute, reducing the analysis time to a few minutes.
In the APCI mode, the gases in a mixture are ionized by a corona
discharge in the source. Depending upon the proton or electron affinity of the analyte gas and modes of ionization, positively charged (M + 1)+ or negatively charged (M
-
1)- ions (M = mol. wt.) were produced. The ions were then focussed by a series of electronic lenses and mass filtered at the first quadrant and accelerated to the second, where they underwentcollision-induced fragmentation. A fragmentation mass spectrum (FMS) resulted, which is valuable for fingerprinting' the parent ion. The FMS added considerable detail beyond the parent ion spectral line.
Procedures
GC/MS. For GC/MS analysis the bulk foam weighing 2-5 g was shredded into small (-1 cm) pieces. The shredded sample was placed in a 100 mL
~rlenmyer flask and sealed with a silicone rubber septum. The container for the blank was an identical but empty flask, sealed with an identical septum. The specimen and blank flasks were then immersed in a hot water bath
maintained at 80°C. The head-space gases in both flasks were allowed to equilibrate for one hour, then sampled using a gas-tight syringe and injected into the GC/MS. The readings for the blank were subtracted from the readings for the specimen. The measurements were made using the test conditions listed in Table I.
The instrument was calibrated by determining the response factor (RF),
defined as the ratio of peak area to concentration, using butane and benzene. The RF values were measured by injecting known amounts of these compounds into the column under isothermal conditions. The RF values
determined prior to and after sample analysis were used to convert peak areas to concentrations. These KF values were used to estimate
concentrations of off-gases in the head-space. The method is likely to introduce an error by a factor of two in the estimates of the
concentrations. This magnitude of error was permissible for the purpose of this study, as it would not alter the relative concentrations in the mixture analyzed.
The instrument reproducibility was estimated by performing replicate analyses on a standard mixture of 0.1% butane in helium. The coefficient of variation (CV) calculated from the replicate measurements at 0.1%
concentration of the standard indicated a reproducibility of +5%, and 2 2 4 %
for the worst case.
MS/MS. For the MS/MS analysis the specimens were prepared by filling a coarse 60 mL sintered glass funnel with foam shredded to about 1 cm, and then compressing the foam using a piston and hand pressure. The specimens were conditioned to 57X KH by placing the funnel containing the sample into
a desiccator, the bottom of which contained a saturated solution of an A.R. grade salt. The solution was stirred intermittently during
conditioning. The sample was allowed to equilibrate with the water vapor. At the end of the seventh day of conditioning the funnel was removed from the desiccator, sealed with a rubber stopper and a glass tube inserted through the centre of the stopper to allow carrier gas to flow through the funnel. The blanks consisted of an identical funnel assembly without foam.
The sintered glass funnel assembly was connected to the inlet port of the MS/MS and a stream of non-humidified organic-free air was forced through the sample at a flow rate of 2.5 L/min. Although the water vapor was
desorbed from the sample in differing amounts, the desorbed water had
minimal interference effects on the analysis at this humidity. The effluent gas was analyzed using a scan rate of 5/min and an ion mass range of 15-250. The baseline was established by testing the sample blank and storing the results in the computer memory. The baseline was then subtracted from the scans of subsequent samples, producing a spectrum for the off-gases, and a count for each parent ion, which was then used to determine concentration levels. The fragmented mass spectra of the parent ions were generated using argon collision gas thickness of 300 x lo1* mol/cm2, with collision energy 50 eV. The resulting daughter ion spectrum was searched and compared against those of the pure compounds stored in the instrument library to confirm the identification. The concentration levels were determined from the parent ion count.
The calibration factor of a compound termed a response factor (RF) in the TAGA system, is a function of the chemical properties of the compound, the reagent gas selected and controllable instrument parameters. The RF values were determined when standard samples of the compounds analyzed were available at the time of measurement. A standard syringe pump method
devised by the supplier of the TAGA instrument was employed. A vapor-liquid equilibrium of the compound was established at a known temperature in a syringe. Then the vapor was driven out at desired rates into a controlled carrier stream of purified air. Concentrations of the compound in the stream were calculated and response factors were measured. Alternatively, the RF values were estimated from the functionally and structurally closely related compounds (see Table IV). Under identical ionization and instrument operation conditions, the RF is determined by the chemical properties of the compound. Thus the RF values of compounds with similar structures (i.e.,
compounds having similar proton affinities and ionization potentials) are very similar. For compounds whose RF values were determined from the
standard samples, the error was estimated to be 50%; in other cases,
however, where the RF values of closely related compounds were used, it may increase by an order of magnitude.
Results and Discussion
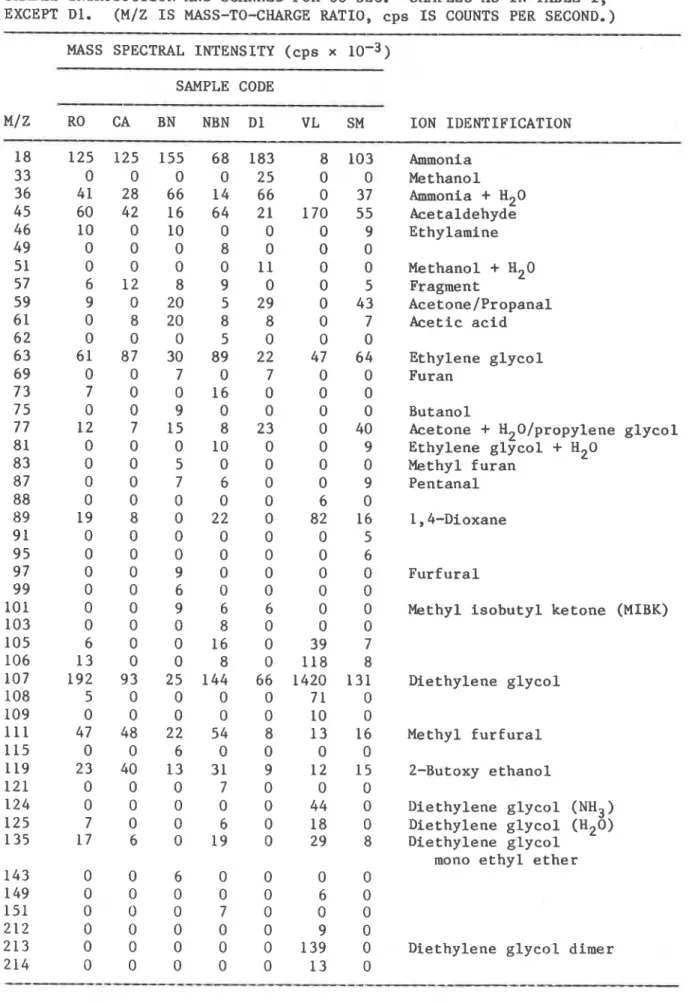
The foam samples analyzed using the APCI/MS/MS included four laboratory samples, RO, CA, BN and NBN and three house samples, Dl, VL and SM. The results are presented in Tables IIa and IIb. The last column shows the tentative identification assigned to the ions with mass numbers listed in column 1. In the positive mode the mass number in the mass spectra
represents M
+
1, in the negative mode M-
l.9 The M/Z is themass-to-charge ratio, and is essentially the mass number of the detected ion, as the charge of the molecular ion in both cases is unity. Thus, the M/Zqs listed in Table IIa are the values of M
+
1 and in Table IIb the M/Zqs are the values of M-
1. The intensities are given in counts per second(cps), and are obtained by subtracting the counts for blanks from the counts for the analyte. kinere tile difference wds less tclan 5 UL)U c p s , a zero was
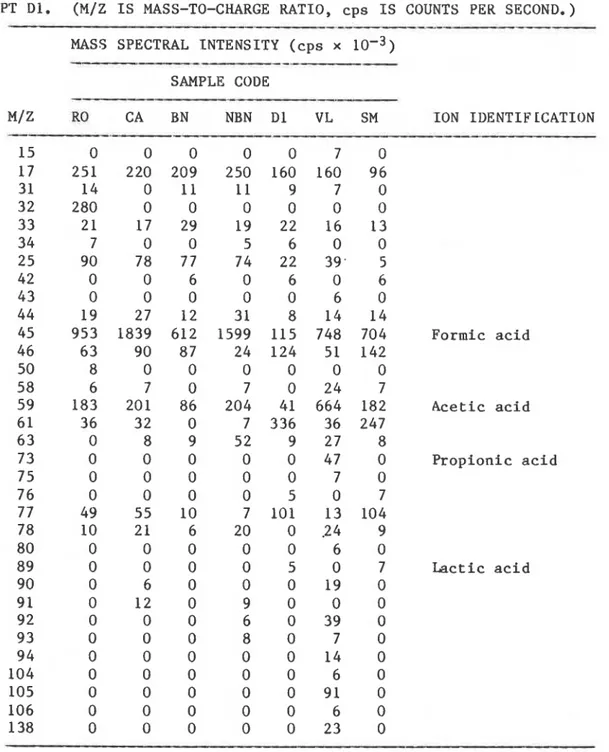
assigned and the result disregarded. Nineteen compounds were identified in the positive mode (Table IIa) and four in the negative mode (Table IIb). Acetic acid was identified in both positive and negative modes. With the exception of ammonia, methanol and acetone, the compounds have not been commonly observed in samples from an indoor environment. 3 The
specimens of UFFI have the potential to further contaminate the living space air with a number of new chemicals. A typical mass spectrum is given in Figure 1.
Certain compounds with low proton affinity (saturated hydrocarbons and formaldehyde) do not ionize in the APCI module and escape detection by APCI/MS/MS.* Table IIa shows that the majority of gases detected were
common to several of the foams, indicating some similarity in composition of off-gas emissions. The table also shows that for these conditions, CA is the cleanest among all specimens in terms of number of off-gases.
The majority of gases emanating from the foam are polar in character and would form solutions in the presence of water. As the foam samples were conditioned at 57% RH for seven days prior to off-gas measurements, and to 50% for many weeks prior to conditioning, the surfaces in the foam were covered with layers of water, which could solubilize the polar compounds present in the foam. Thus the type and the amount of polar compounds
(e.g., ammonia, acetic acid, glycols, alcohols and ethylamine) (Table IIa and IIb) in the gaseous phases can be determined by the vapor-solution phase equilibria established over the foam surface. Emission of polar compounds would be dependent on the moisture content and on changes in the moisture content of the foam. This was observed in a preliminary set of
measurements. Measurement of the changes in emission as the foam desiccated in the dry carrier gas flow, indicated that off-gas emission rates of most gases increased exponentially when the foam was humidified, dropping to very low levels, but often not to zero, as the foam was desiccated. It follows that the moisture content of the carrier gas would influence the emission of off-gases from UFFI whether or not it has been humidified or dried. The full effects of the humidity of the carrier gas have not been addressed in this paper. Instead, the emissions were measured under selected
conditions.
The study concentrated on the identification of gases emitted from various foams, relative differences in concentration between specimens, and changes with humidity during conditioning and with time, rather than the
absolute quantification of each of the concentrations. For these reasons and the fact that the variations with time and conditioning were so large, reproducibility of measurements and calibration factors for each individual gas in the analyte mixture were not determined. However, a set of
measurements was made to provide a measure of reproducibility for a given sample. A sample of foam was shredded, blended and then divided into four equal parts. Each part was packed into a separate funnel. The four samples were conditioned at 57% RH for three days and off-gases measured using the same procedure and experimental conditions as for other measurements in this study. The results are given in Table 111. The mean CV was less than 20%. Near the detection level it was 1.5K or 15%, at intermediate values, 25%, and at high values, 5%. This indicates that analytical data with an acceptable reproducibility for the purposes of comparative type studies could be produced using this procedure.
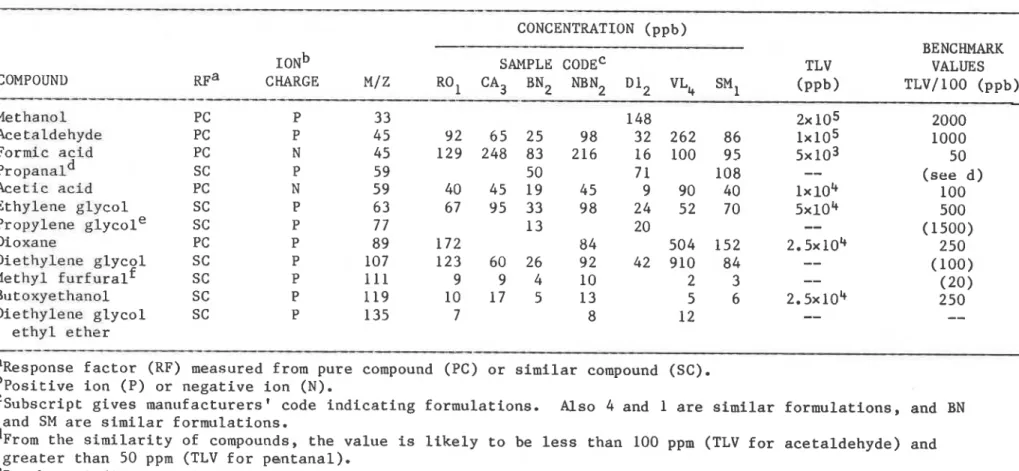
The estimated concentrations of the off-gases are shown in Table IV. Although indoor air standards for the compounds found have not been
established, it was necessary to establish a reference point against which to compare the level of emission of that compound from the foam. After consulting the pertinent papers on the subject and discussing the various possibilities with the researchers developing criteria for indoor standards a value of 1/100 of the TLV was selected and used as a 'benchmark' or
reference value for the purpose of this study. For example, the ratio of TLV to the ambient air standards for the compounds for which ASHRAE has recommended ambient and indoor levels range from 1/10 to 11190. l 1 The TLV/100 are listed in column 13. A comparison of the maximum emission of compounds from each row with the corresponding value in column 13 indicates that the concentrations of acetaldehyde, acetic acid and methyl furfural approach, and those of formic acid, diethylene glycol and dioxane exceed, the TLV/100 or its estimate. The concentrations of methyl furfural and diethylene glycol were estimated using the RF values from similar compounds
and could have involved a ten-fold error. This, however, would affect the comparison of these compounds only if their concentrations differed from the reference value by less than a factor of 10.
The results of GC/MS analysis are given in Table 'V; a total of twenty compounds were found. The MS/MS had detected many compounds but only
twenty-two were identified for these particular specimens. In the lists of twenty-two (Tables IIa and IIb) and twenty compounds (Table V), only seven (methanol, acetone, acetic acid, dioxane, diethylene glycol, furfural and methyl furfural) were common and only five (methanol, acetic acid, dioxane, diethylene glycol and methyl furfural) were quantified by MS/MS.
The concentrations measured with GC/MS were higher than the MS/MS results by a factor of 10 to 180 for the five common quantified gases, probably due to the increase in the emission rates of the off-gases at elevated temperatures. Thirteen gases were either missed by the GC/MS or were not emitted at the higher temperature. Dichlorobenzene and methyl furfural were common to all foams. The estimated concentrations of the compounds, acetic acid, 1,4-dioxane, 2-fury1 methanol, methyl furfural, naphthalene, dichlorobenzene, diethylene glycol, and dibutylphthalate exceed their benchmark values (Table V). Contrary to room temperature emissions measured by the MS/MS, the house foams released a greater number of the gases listed than did the laboratory-prepared foams. These gases may have been generated due to the hydrolysis of foam at the conditions of humidity and temperature prevailing in the houses or due to the adsorption of the chemicals from the air during the period of installation in the wall cavity. Chemicals like xylene, toluene, dichlorobenzene, naphthalene, and methylene chloride observed in the head-space analysis could have originated from
household or environmental activities, been deposited on the foam surface,
and then released when foam was heated to 80°C. These chemicals have been
reported in indoor air. l o
The number of off-gases released at room temperature by the newer NBN
foam (0.7 year) (Table IV) are comparable to those released by the older
formulation BN (4.5 year), but the concentrations are higher. The higher
concentrations may be the result of the newness of NBN foam. Foams are known to release relatively high concentrations of some gases early in the aging period.
The sensitivity that a method must have to measure the off-gases in the living space of a house can be estimated from the air leakage
characteristics of the construction. If the foams in question were
installed in the wall cavities, gases in the cavities would likely be driven into the living space as a result of wind driven and thermally induced
pressure differences between outside and inside of the house. Research has shown that this would result in the infiltration of air in the living
space.
Studies of air changes between wall cavities and living spaces in several hundred Canadian and a number of British homes indicated that where the foam is at room temperatures, the concentrations of off-gases in the living space of a typical house could be a factor of two to fifty lower than the levels occurring in the cavities, depending primarily on the house
construction and air exchange rate.2 Estimates of living space
concentration can be made from levels in the cavity, which in turn are
directly related to the levels in the UFFI shown in Table IV. An increase
in humidity and temperature in the cavities would result in an increase in the concentrations in the foam and thus in the living space.
Conclusion
The identification of off-gases from UFFI has been made using a carrier gas stripping technique to sample the off-gases combined with the enhanced specificity due to the more definitive fragmentation mass spectra and the inherent sensitivity for some compounds of tandem MS/MS. For a set of seven samples, twenty-two compounds were identified and the concentration of twelve of these estimated. Since the MS/MS instrument is insenstive to hydrocarbons and halogenated hydrocarbons, these compounds could not be detected.
The Capillary GC/MS was used to estimate the concentrations of gases released at 80°C into a head space. Twenty compounds were quantified from the set of seven foams. The house foam released more gases than did the laboratory prepared foam in all cases.
Results from GC/MS complemented the APCI/MS/MS results. Seven compounds were identified by both techniques and five were quantified by MS/MS.
The higher concentrations found at 80°C indicate that higher emission could occur in a UFFI house during hot weather.
Tandem APCI/MS/MS was especially well suited for rapid screening of the off-gases and for determination of the variations in off-gassing with
conditioning, time and sampling parameters.
Further measurements are required to define the full range of
emissions, and to identify which gases originate elsewhere and are simply stored in the foam. Effects of humidification of carrier gases and sample conditioning must be determined before the identification, duration and concentration of gaseous emissions from UFFI are adequately characterized.
The UFFI samples investigated were sources of over twenty contaminant chemicals. Compounds with concentrations above TLVI100 found at 23OC were acetaldehyde, formic acid, dioxane, acetic acid, diethylene glycol and methyl furfural. At 80°C, acetic acid, 1,4 dioxane, 2-fury1 methanol, methyl furfural, naphthalene, dichlorobenzene, diethylene glycol, and dibutylphthalate also exceeded TLV1100 levels. Dichlorobenzene was common to all samples. High temperature measurements also indicated that wall cavity foam may provide a sink for solvents such as methylene chloride, xylene, toluene and naphthalene. These solvents can be released at a later stage. The results indicate the need for measurements of UFFI emission at other conditions and for measurements in the living space under worst case conditions once methods for measurement are refined. Formaldehyde,
hydrocarbons, and chlorinated hydrocarbons from the UFFI could not be detected with either technique but may have been present.
Acknowledgements
The authors gratefully acknowledge the extensive and invaluable
guidance on physical chemistry and sorption properties of materials given by Peter Sereda. Brian Stewart operated the MSIMS and Michael Clermont, the GCIMS. Thanks are given to Dr. Greig Sim for helping to assign priorities to chemicals identified. Dr. Lorne Elias provided special expertise on the sampling of trace gaseB on sorbents. Madeleine Rousseau and Judith Young collaborated with John Martin of Mann Laboratories in analyzing UFFI
off-gases collected. The late Dr. G. Stuart Wiberg and
Dr.
Andrew Gilman of Health and Welfare Canada provided background information on theestablishment of TLV1s in the workplace.
References
1. Standing Committee on Health, Welfare and Social Affairs, "Inquiry Into Urea Formaldehyde Foam Insulation", Fifth Report to the House, Issue No. 48, Published under Authority of Speaker of the House of Commons, Ottawa, December 1982.
2. L.H. Everett, A contribution to the Formaldehyde Workshop, Little Rock, Arkansas, October 2-6, 1983.
3. G.G. Allan, "Long-term stability of urea-formaldehyde foam insulation",Environ. Sci. and Technol.,
14,
1235 (1980).J. Dutkiewicz, "Hydrolytic degradation of cured urea-formaldehyde resin", J. Appl. Polymer Sci.,
28,
3313 (1983).5. W. Schnabel, Polymer Degradation, Collier MacMillan Canada, Toronto. 1981, p. 167.
6. D.C. Legget, "Vapour pressure of 2, 4, 6-trinitrotoluene by a gas chromatographic technique", J. Chromatography,
133.
83 (1977).7. B.V. Ioffe, and A.G. Vitenberg, Head Space Analysis and Related Methods in Gas-Chromatagraphy, John Wiley and Sons, New York,
1982, p. 99.
8. F.W. Karasek, 0. Hutzinger, and S. Safe, Mass Spectrometry in
Environmental Sciences, Plenum Press, New York, 1985, pp. 101-121* 9. L. Wallace, R. Zweidinger, M. Erickson, S. Cooper, D. Whitaker and
E. Pellizzari, "Monitoring individual exposure measurements of volatile organic compounds in breathing-zone air, drinking water and exhaled breath", Environment International, 8: 269 (1982).
10. L. Wallace, E. Pellizzari, T. Hartwell, H. Zelon, C. Sparacino,
R. Whitmore, "Analyses of exhaled breath of 355 urban residents for volatile organic compounds", Indoor Air, Proceedings of the 3rd
International Conference on Indoor Air Quality and Climate, Stockholm, August 1984, Vol. 4, pp. 15-20.
11. R. A. Wadden and P. A. Scheff
,
Indoor Air Pollution, John Wiley & Sons, New York, 1983, pp. 5 and 136.12. N.I. Sax, Dangerous Properties of Industrial Materials, 6th edition, Van Nostrand Reinhold Co., 1984.
TABLE I. DESCRIPTION OF UFFI SAMPLE AND GAS CHROMATOGRAPH CONDITIONS USED
I N TESTING
Temperature
Age programming
Name Source ( Y e a r s ) Column ("C) NBN R e f e r e n c e dlil .&f e r e n c e CA R e f e r e n c e RO Reference SM House VL House D 2 House ~1~ House C o n d i t i o n s common t o a l l samples t e s t e d C a r r i e r g a s
-
Helium p r e s s u r e = 25 p s i E l e c t r o n e n e r g y 70 eV I n j e c t i o n p o r t 200°C MS i o n s o u r c e 150°CT r a n s f e r l i n e from column end t o MS 280°C Volume i n j e c t e d 2 mL ~ M ~ - S I L
-
HP U l t r a # 1 , methyl s i l i c o n e bonded p h a s e c a p i l l a r y , 25 m x 0.2 mm I D . 2 0 ~ - 3 5 1-
S i l i c o n e t y p e ( p o l a r ) , non-bonded, 25 m x 0.32 mm I D . 3 ~ x a m p l e -50(2)/20/250; -50 i n i t i a l t e m p e r a t u r e , ( 2 ) h o l d i n g t i m e i n m i n u t e s , 20 ramp r a t e OC/minutes, 250 f i n a l t e m p e r a t u r e . 4Analyzed by MS/MS o n l y .MASS NUMBER
Fig. 1 T y p i c a l APCI p o s i t i v e i o n mass s p e c t r u m , sample from house foam, room t e m p e r a t u r e . Dry p u r i f i e d a i r f l o w r a t e 2.5 L/min; corona d i s c h a r g e c u r r e n t 3 p amps.
TABLE I I a . MASS SPECTRAL INTENSITIES OF POSITIVE IONS AND IDENTIFICATION OF IONS OF OFF-GASES RELEASED AT ROOM TEMPERATURE FROM FOAM SPECIMENS
CONDITIONED AT 57% RH. DATA ARE AVERAGES OF I O N COUNTS TAKEN 5 SEC AFTER SAMPLE INTRODUCTION AND SCANNED FOR 60 SEC. SAMPLES AS I N TABLE I,
EXCEPT D l . (M/Z I S MASS-TO-CHARGE RATIO, c p s I S COUNTS PER SECOND.) MASS SPECTRAL INTENSITY ( c p s x 10-3)
SAMPLE CODE M/Z RO CA BN NBN D l VL SM I O N IDENTIFICATION Ammonia Methanol Ammonia
+
H20 Acetaldehyde Ethylamine Methanol+
H20 Fragment Acetone/Propanal A c e t i c a c i d E t h y l e n e g l y c o l Furan B u t a n o l Acetone+
H20/propylene g l y c o l E t h y l e n e g l y c o l+
H20 Methyl f u r a n P e n t a n a l Furf u r a l Methyl i s o b u t y l k e t o n e (MIBK) D i e t h y l e n e g l y c o l Methyl f u r f u r a l 2-Butoxy e t h a n o l D i e t h y l e n e g l y c o l (NH3) D i e t h y l e n e g l y c o l (H20) D i e t h y l e n e g l y c o l mono e t h y l e t h e r D i e t h y l e n e g l y c o l dimerTABLE I I b . MASS SPECTRAL I N T E N S I T I E S OF NEGATIVE IONS AND I D E N T I F I C A T I O N OF I O N S OF OFF-GASES RELEASED AT ROOM TEMPERATURE FROM FOAM SPECIMENS
CONDITIONED AT 57% RH. DATA AKE AVEKAGES OF ION COUNTS TAKEN 5 SEC AFTEK
SAMPLE INTRODUCTION AND SCANNED FOR 60 SEC. SAMPLES A S I N TARLE I , EXCEPT Dl. (M/Z I S MASS-TO-CHARGE RATIO, c p s I S COUNTS PER SECOND.)
---
MASS SPECTRAL I N T E N S I T Y ( c p s x 10-3) SAMPLE CODE M/Z RO CA BN NBN Dl VL SM ION I D E N T I F LCATION 15 0 0 0 0 0 7 0 17 251 220 209 250 160 160 96 31 14 0 11 11 9 7 0 32 280 0 0 0 0 0 0 33 2 1 17 29 19 22 16 13 3 4 7 0 0 5 6 0 0 2 5 90 78 77 74 22 39. 5 42 0 0 6 0 6 0 6 43 0 0 0 0 0 6 0 4 4 19 27 12 3 1 8 14 14 45 953 1839 612 1599 115 748 704 F o r m i c a c i d 4 6 63 90 87 24 124 51 142 50 8 0 0 0 0 0 0 58 6 7 0 7 0 2 4 7 59 183 201 86 204 41 664 182 A c e t i c a c i d 6 1 36 32 0 7 336 36 247 6 3 0 8 9 52 9 27 8 7 3 0 0 0 0 0 4 7 0 P r o p i o n i c a c i d 7 5 0 0 0 0 0 7 0 7 6 0 0 0 0 5 0 7 7 7 49 55 10 7 101 13 104 78 10 21 6 20 0 2 4 9 80 0 0 0 0 0 6 0 8 9 0 0 0 0 5 0 7 Lactic a c i d 90 0 6 0 0 0 1 9 0 9 1 0 12 0 9 0 0 0 92 0 0 0 6 0 39 0 93 0 0 0 8 0 7 0 9 4 0 0 0 0 0 1 4 0 104 0 0 0 0 0 6 0 105 0 0 0 0 0 91 0 106 0 0 0 0 0 6 0 138 0 0 0 0 0 23 0TABLE 111. MEASUREMENTS O F MASS SPECTKAL I N T E N S I T I E S SHOWING
R E P R O D U C I R I L I T Y ( % C V ) O F OFF-GAS MEASUKEMENTS F O R I D E N T I C A L S P E C I M E N S O F U F F I I N P O S I T I V E AND NEGATIVE MODES. (M/Z I S MASS-TO-CHARGE R A T I O , cps I S COUNTS P E R SECOND.)
P O S I T I V E I O N S NEGATIVE I O N S
- - - . - - - . . - . . - -. - - -- - - -- - -- . - - - . .
MASS S P E C T R A L I N T E N S I T Y CV MASS S P E C T R A L I N T E N S I T Y CV
TABLE I V . CONCENTRATION OF OFF-GASES ESTIMATED FROM THE DATA I N TABLES I I a AND I I b .
CONCENTRATION (ppb)
BENCHMARK
ION^
SAMPLE CODE' TLV VALUESCOMPOUND R F ~ CHARGE
MI
Z RO1 CA3 BN2 NBN2 D l 2 VL4S"1 ( P P ~ ) TLVI 100 (ppb)
--
Methanol PC P 33 148 2x 10⁵ 2000 Acetaldehyde PC P 45 92 6 5 25 98 32 262 86 1x10⁵ 1000 Formic acid PC N 45 129 248 83 216 16 100 95 5x l o 3 50 d Pr o p a n a l SC P 59 50 7 1 108--
( s e e d ) A c e t i c a c i d PC N 5 9 40 45 19 45 9 90 40 l x l o 4 100 E t h y l e n e g l y c o l SC P 6 3 67 95 33 98 24 52 70 5 x 1 0 ~ 500 Propylene g l y c o l e SC P 7 7 1 3 20--
( 1500) Dioxane PC P 8 9 172 8 4 504 152 2.5x10⁴ 250 D i e t h y l e n e g l y c o l S C P 107 123 60 26 92 42 910 84--
S C P--
( 1 0 0 ) Methyl f u r f v r a l f 111 9 9 4 1 0 2 3 Butoxyethanol S C P 119 10 17 5 1 3 5 6 2.5x10⁴ 250 ( 2 0 ) D i e t h y l e n e g l y c o l S C P 135 7 8 12--
--
e t h y l e t h e r mm a ~ e s p o n s e f a c t o r (RF) measured from pure compound (PC) o r s i m i l a r compound (SC).
m ' P o s i t i v e i o n ( P ) o r n e g a t i v e i o n ( N ) .
' s u b s c r i p t g i v e s m a n r l f a c t u r e r s ' code i n d i c a t i n g f o r m u l a t i o n s . Also 4 and 1 a r e s i m i l a r f o r m u l a t i o n s , and BN and SM a r e s i m i l a r f o r m u l a t i o n s .
d ~ r o m t h e s i m i l a r i t y of compounds, t h e v a l u e i s l i k e l y t o be less t h a n 100 ppm (TLV f o r a c e t a l d e h y d e ) and g r e a t e r t h a n 50 ppm (TLV f o r p e n t a n a l ) .
e ~ r a c k e t ~ i n d i c a t e e s t i m a t e d v a l u e s based on LDS0 t a k e n from r e f e r e n c e 12 f o r r a t s and mice.
TABLE V. GC/MS MEASUREMENTS OF HEADSPACE CONCENTRATIONS OF OFF-GASES RELEASED FROM LABORATORY AND HOUSE UFFI FOAMS AT 80°C
. . . . . - - . . - . - -
-CONCENTRATION (ppb)
BENCHMARK
MOL. SAMPLE
CODE^
VALUESCOMPOUND WT. RO1 CA3 BN2 NBN2 D22 VL,, SM1 (PP~)
Methanol Acetone Acetic acid Isobutanol b Methylene chloride 1,4-Dioxane 1,3,5-Trioxane Toluene Furf ural 2-Fury1 methanol Diethyleneglycol Xylene Benzaldehyde Methyl furfural Furanyl ethanone C3 Benzene d Naphthalene C1oH22 hchlorobenzene Dibutylphthalate
a~ubscript gives manufacturers
'
code indicating formulations. Also 4 and 1 are similar formulations, and BN and SM are similar formulations.b ~ 5 hydrocarbon also possible identity. +
rackets
indicate estimated values based on IDs0 taken from reference 12 for rats and mice.T h i s p a p e r i s b e i n g d i s t r i b u t e d i n r e p r i n t f o r m by t h e I n s t i t u t e f o r R e s e a r c h i n C o n s t r u c t i o n . A l i s t of b u i l d i n g p r a c t i c e and r e s e a r c h p u b l i c a t i o n s a v a i l a b l e from t h e I n s t i t u t e may be o b t a i n e d by w r i t i n g t o t h e P u b l i c a t i o n s S e c t i o n , I n s t i t u t e f o r R e s e a r c h i n C o n s t r u c t i o n , N a t i o n a l R e s e a r c h C o u n c i l o f C a n a d a , O t t a w a , O n t a r i o , K l A OR6. Ce document e s t d i s t r i b u 6 s o u s forrne de t i r e - 8 - p a r t p a r 1' I n s t i t u t de r e c h e r c h e e n c o n s t r u c t i o n . O n p e u t o b t e n i r une l i s t e d e s p u b l i c a t i o n s d e 1 ' I n s t i t u t p o r t a n t s u r l e s t e c h n i q u e s ou l e s r e c h e r c h e s e n m a t i s r e d e b d t i m e n t e n 6 c r i v a n t 3 l a S e c t i o n d e s p u b l i c a t i o n s , I n s t i t u t d e r e c h e r c h e e n c o n s t r u c t i o n , C o n s e i l n a t i o n a l d e r e c h e r c h e s du Canada, Ottawa ( O n t a r i o ) , K I A OR6.