HAL Id: hal-00143017
https://hal.archives-ouvertes.fr/hal-00143017
Submitted on 27 May 2021
HAL is a multi-disciplinary open access
archive for the deposit and dissemination of
sci-entific research documents, whether they are
pub-lished or not. The documents may come from
L’archive ouverte pluridisciplinaire HAL, est
destinée au dépôt et à la diffusion de documents
scientifiques de niveau recherche, publiés ou non,
émanant des établissements d’enseignement et de
Fine scale simulations of the MAP-IOP2a precipitating
system: comparison with radar data and sensitivity to
the hail category
Jean-Pierre Pinty, Evelyne Richard, Pierre Tabary
To cite this version:
Jean-Pierre Pinty, Evelyne Richard, Pierre Tabary. Fine scale simulations of the MAP-IOP2a
precip-itating system: comparison with radar data and sensitivity to the hail category. 11th Conference on
Cloud Physics, Jun 2002, Ogden, United States. �hal-00143017�
FINE SCALE SIMULATIONS OF THE MAP -IOP2A PR ECIPITATING SYSTEM: COMPARJSON WITH RADAR DATA AND SENSITIVITY TO THE HAIL CAT EGORY
Jean-Pierre PINTY1 Evelyne RJCHARD*1 and Pierre TABARY2 1 Laboratoire d 'Aerologie, Toulouse, France
2Meteo-France, Toulouse, France
1. INTRODUCTION
During Intensive Observing Periods (IOP) of the Mesoscale Alpine Programme (MAP, see Bougeault et al. 2001) a network of three Doppler radars was operated in the Lago Maggiore Target Area (LMTA). In the afternoon and evening of Sept. 17, 1999 (MAP-IOP2a), a major squall line formed on the foothills of the southeastward facing slopes of the Lago Maggiore region and intensified during its propagation to the east as a three-dimensional con vective cluster. This intense orogenic system with lots of lightning impacts and precipitation amounts of more than 70 mm in 6 hours, was well observed by the radars. Additional polarimetric data from radar S-POL (NCAR) revealed rich regions of grau pel/hail mixture in convective cells where the verti cal velocity, w 2: 4 ms-1 and the radar reflectivity, Z 2: 45 dBZ (Tabary et al., 2001).
The simulation of this event has been conducted at high resolution with the French non-hydrostatic model MesoNH (Lafore et al., 1998). An earlier study made by Richard et al. (2002) emphasized the importance of the analysis to conclude that in this case, best results are obtained when the meso cale model is initialized! and forced with ECMWF analyses. MesoNH is run with the grid nesting tech nique for horizontal grid-sizes of 32, 8 and 2 km. In the innermost domain, cloud and precipitation are entirely resolved by the explicit microphysical scheme. Model outputs are converted in radar re flectivities for comparison with data.
The purpose of this work is to test the impact of heavy rimed particles in the evolution of the MAP IOP2a precipitating system. In particular, an ex plicit representation of hail at the 2 km scale is eval uated with a 4-class ice scheme (pristine ice, snow, graupel, hail). The paper is organized as follows. First we briefly describe the microphysical scheme and its extension to incorporate a hail class. Then
• Corresponding author address:
Evelyne Richard, Laboratoire d' Aerologie, OMP, 14 av. E. Belin, 31650, Toulouse, France;
e-mail <rice@aero.obs-mip.fr>.
we present results obtained for different experiments and we conclude on future work.
2. MICROPHYSICAL SCHEME IN SHORT 2.1 Generalities about the mixed-phase scheme
The scheme is briefly described in Pinty and Jabouille (1998). The full documentation is available from the author or at the web site <http://www.aero.obs-mip.fr/ �mesonh/>.
The bulk scheme predicts the evolution of the mixing ratios of six water species: rv (vapor), re and rr (cloud droplets and rain drops) and ri, r5 and r 9 (pristine ice, snow/ aggregates and frozen drops/ graupels ordered with an increasing degree of riming). Rain, snow and graupel concentrations are diagnosed as simple power laws N = c>.x where >. is the slope parameter of the size distribution and C-x empirical constants drawn from radar observa tions. Size distributions follow a generalized 'Y-law: n(D) = N g(D) = N a/r(v)>.. a:v na:v-1exp
(
-(>.D)°')
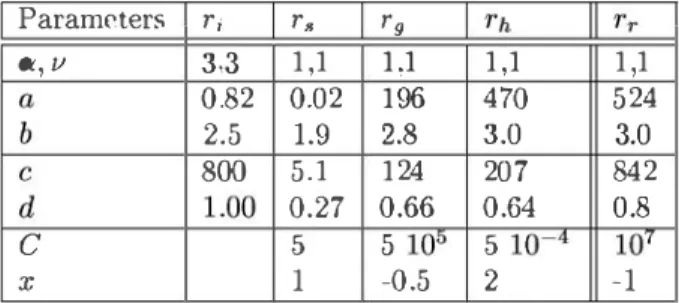
g(D) is the normalized form. n(D) degenerates into the Marshall-Palmer law for a = v = 1. As ususally done, simple power laws are taken for the mass-size (m = aDb) and velocity-size (v = cDd) relation ships to perform necesary analytical integrations. The complete characterization of each ice category and raindrops is summarized in the table belowI
ParametersI
riI
rsI
r9 a,v 3,3 1,1 1,1 1,1 1,1 a 0.82 0.02 196 470 524 b 2.5 1.9 2.8 3.0 3.0 c 800 5.1 124 207 842 d LOO 0.27 0.66 0.64 0.8 c 5 5 105 5 10-4 10'' x 1 -0.5 2 -1Table 1: Set of parameters for each water category in MKS
2.2 Graupel growth modes
The graupels are very efficient collectors of cloud particles and hydrometeors because they sweep a
large volume of air during their fall. Their sur face temperature is generally warmer than the envi ronmental temperature because the liquid accreted material releases latent heat. Until the mean sur face temperature of the graupels
T9
remains below 0° C, all the collected droplets and raindrops can freeze: this stage corresponds to the DRY growth mode. As soon asT9
reaches the melting point, a thin liquid film persists at the surface of the grau pels and any excess of accreted liquid condensate is shed away: this second stage is the WET growth mode leading to the formation of hail embryos.The graupel DRY growth scheme explicitly computes the individual collection rates of the cloud droplets, small ice crystals, raindrops and snowflakes. In the two last cases, look-up tables are necessary, otherwise integrations over the size distri bution functions can be performed analytically. The WET growth is solution of the heat balance equa tion (Musil, 1970) with integration over the graupel spectrum and assuming
T9
= 0° C (shedding limit). In the scheme, both DRY and WET rates are computed and compared, but only the lowest value is retained. For instance, WET> DRY means that enough water can freeze on the graupels so the growth can operate in the dry regime. Conversely if DRY> WET, the growth is in the wet mode because potentially accreting water cannot entirely freeze as WET represents the maximal freezing rate on the surface of the graupels.2.3 Inclusion of a "hail" class of hydrometeor The formation of hail particles is derived from the WET and DRY growth modes of the graupels. The partial conversion of graupels into hailstones is approximated by
arh
l
(ar9)*
DRYot
g-+h
= 7ft x DRY +WETwhere
(or 9 /
at)*
is the sum of ther 9
tenctencesbefore the conversion into hail. The correspond ing sink on the
rg
budget isorg/otlg-+h
=-8rh/8tl9-+h.
The above formulation allows for a progressive transition from graupel to hailstone. It is based on the simple idea that the more the grau pels can grow in the WET mode (DRY» WET case), the more they are depleted and convertedinto hailstones. This macroscopic approach is in contrast with Ziegler (1985) who suggested a size distinction between graupel and hail which is based on a dry /wet growth threshold diameter to inte grate by part over the graupel size distribution. We found that this technique is not easily applicable in a four class microphysical scheme insofar the scheme is rendered increasingly complex (Ferrier, 1994).
Once formed hail grows exclusively in the WET growth mode. No reverse conversion to the graupel category is possible for the moment. Hailstones fall and melt into rain at a rate, including ventilation effect, which is explicitly computed .
3. THE "MAP;IOP2a" CASE STUDY 3.1 Synpotic situation
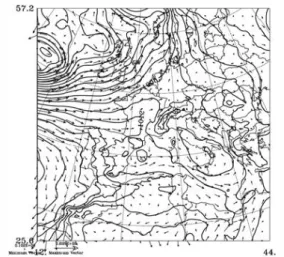
Analysis for the 17 Sept. 1999 at 12UTC over Western Europe is taken from ECMWF (see Fig. 1). At the surface, a secondary low stands over Italy and induces a rapid flow (10 ms-1) over the Adriatic Sea pointing to the northwestern italian Alps. At 500 hPa, an eastward moving trough over France advects cold and moist air over the LMTA and thus reinforces the development of deep con vection in this area (the Milano-Linate soundings indicate a CAPE growth from 535 to 934 Jkg-1 be tween 12 and 18 UTC).
Figure 1: ECMWF surface chart of Sept. 17, 1999 at 12 UTC with SLP (contours every '2 hPa) and wind vectors.
3.2 Model set-up
The mesoscale model (MesoNH) is run with three levels of nesting on 50 uneven levels of altitude. The computational domains and topography are shown in Fig. 2. The 32 km mesh model (150x 150) follows the synpotic situation over Europe. The 8 km mesh domain (144 x 144) resolves the Alpine massif while
the finest domain at 2 km resolution (160 x 160) is
centered on the LMTA area. All the models start at 12 UTC and are integrated for 12 hours on a massively parallelized computer.
Four runs were performed to test the sensitivity to the microphysics but we restrict the result anal ysis for two of them. Run 13 uses the three-class (ice) standard scheme. Run I4 includes an explicit hail categorie. The simulated reflectivities Z (Fer rier, 1994) are filtered to ease the comparison with radar observations (Leise, 1981).
·10 0 10 20 8 9 10
Figure 2: Geographical domains of the nested simulations (left) and the 2 km scale topography with 500 m contours on 160x160 grid points and R, S, L radar locations (right).
3.3 Results
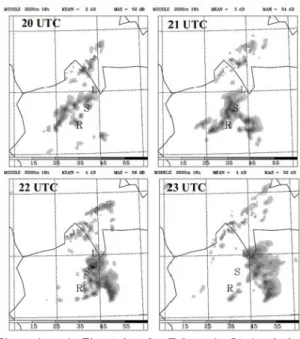
Fig. 4 presents a hourly sequence of observed Z at z = 2000 m while the simulated Z for runs 13
Figure 4: Observed Z at z = 2000 m
� 0000. l l h � - 2•• !Ul e f!>oda lll O!lt:lJ: toOOOro 1INI llr.&N e :J dll I 20 UT
FigurP. .'>: ""-" in Fig. 4, hut. for 7, from t.hP. rn �imulat.ion
Figure 6: as in Fig. 4, but for Z from the 14 simulation
and 14 are given in Figs. 5 and 6, respectively. Al though the observed radar echoes with Z < 15 dBZ ocupy a larger area, the location of the "horseshoe" pattern at 23 UTC is quite well reproduced in 13 and 14 simulations. Note also that Z is similar between
13 and 14 at 20 UTC after 8 hours of simulation but the southeast convective cluster seems to have a bet ter positioning in 14 run. Looking now at at higher altitude (z = 6000 m in Figs 7-9), one can notice
that only the 14 run is able to simulate the dark est spots (Z > 55 dBZ) which denote the presence of pure hail or graupel-hail mixture, as confirmed by the S-POL data analysis (Tabary et al., 2001).
The "hot towers" are associated to intense updrafts
( w > 5 ms-1) as revealed by the Doppler radars. To get a more precise view of the microphysical
20 UT
20 UT
Figure 8: as in Fig. 5, but at z = 6000 m
llQCllJ.l ecoo- tA lll:All - *"
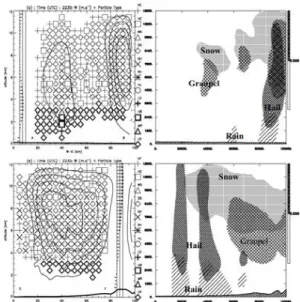
Figure 9: as in Fig. 6, but at z = 6000 m characteristics of the convective cells in the south east of the domain, two cross sections with S-POL particle classification and the corresponding simu lation of particle amount, both valid at 22:30 UTC, are presented in Fig. 10. The S-POL radar data show that the turrets topping at 10-11 km contain a copious amount of hail "HL" ( 0) and hail-graupel mixture "GH" (X). This feature is quite well re trieved by run 14 of the model where the location
of the hydrometeors with mixing ratios higher than 0.5 gkg-1 reveals a similar stratification of the mi crophysical composition of the precipitating system.
4. CONCLUSION
The ensemble of radar observations taken during MAP-IOP2a represents a unique database to study small-scale dynamical a.nd microphysical
intera.c-Figure 10: W-E (top) and S-N (bottom) vertical sections across the main convective cores at 22:30 UTC with S-POL particle classification and w (left) and modeled microphysics with threshold contour rr,r8,r9,rh > 0.5 gkg-1 (right). tions over orography. The explicit resolution of con vection in a multiple nested mesoscale model pro vides encouraging results. Hail formation and lo cation is reasonnably well captured by the four class microphysical scheme compared to polarimet ric data. Better results are expected in the future with model runs at 1 or 0.5 km scale resolution. 5. REFERENCES
Bougeault, P., P . Binder, A. Buzzi, R. Dirks, R. Houze, J.
K11P.t.t.nP.r, R.R. Smith, R. Steinar.kP.r, H. VolkP.rt an<I all the MAP scientists, 2001: The MAP special observing period.Bull. Am. Metror. Soc., 82, 433-462.
Ferrier, B. S., W.-K. Tao, and J. Simpson, 1995: A double moment multiple-phase four-class bulk ice scheme. Part TI: Simulations of convective storms in different large scale environments and comparisons with other bulk parameterizations. J. Atmos. Sci., 52, 1001-1033.
Lafore, J. P. and coauthors, 1998: The Meso-NH
Atmospheric Simulation System. Part I:
Adia-batic formulation and control simulations. Annales Ge.nphysiooe,10,90-109.
Leise, J. A., 1981: A multidimensional scale-telescoped filter and data extension package. NOAA Tech. Memo. ERL WPL-82, 18 pp. [NTIS PB8'2-164104).
Musil, D. J., 1970: Computer modeling of hailstone growth in feeder clouds. J. Atmos. Sci., 27, 474-482.
Pinty, J.-P. and P. Jabouille, 1998: A mixed-phaise cloud parameterization for use in a mesoscale non-hydrostatic model: simulations of a squall line and of orographic precipitatiQn. In Conf. on Cloud Physics, Everett, WA. Amer. Meteor. Soc., 217-220.
Tabary, P., G. Scialom, and E. Richard, 2001: Four dimensional structure of a mid-latitude orogenic squall line observed with Doppler/polarimetric radaC"S during the MAP experiment. Mon. Wea. Rev., in revision.
Ziegler, C. L., 1985: Retrieval of thermal and microphysical variables in observed concetive storms. Part I: Model development and preliminary testing. J. Atmos. Sci.,