European Heart Journal (1987) 8 (Supplement C), 21-27
Digital videodensitometric measurement of
aortic regurgitation
J. DIVERNOIS, P. CHATELAIN, P.-A. DORIOT, B. MEIER, W. RUTISHAUSER Cardiology Center, University Hospital, CH-1211 Geneva 4, Switzerland
KEY WORDS: Aortic regurgitation, videodensitometry, digital subtraction angiography, DSA.
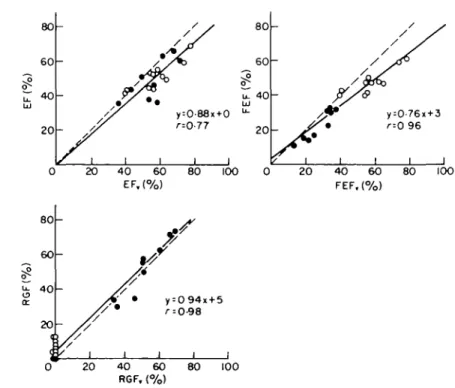
A videodensitometric method for quantification of aortic regurgitation which requires neither measurement of cardiac output nor determination of enddiastolic and endsystolic left ventricular volumes has been developed. The injection of 20 ml of contrast medium into the left ventricle is digitally recorded at 25 images s~l during 20 s using an equipment for digital subtraction angiography (Digitron 2, Siemens). The Digitron computes 2 'time dilution curves' (TDC) from the unsubtracted image sequence, for 2 regions of interest drawn around the angiographic enddiastolic and endsystolic left ventricular silhouettes. Enddiastolic and endsystolic points of the TDC are then entered into a VAX-750 computer, which calculates the ejection fraction (EF), the forward ejection fraction (FEF) and the regurgitant fraction (RGF). This is performed by a complex fitting algorithm based on a physical model of the washout process of contrast medium, which reconstructs the two best enddiastolic and endsystolic baselines in the washout parts of the two TDC. The EF, FEF and RGF obtained in 9 regurgitant' and 11 nonregurgitant patients have been compared with the corresponding values EFe, FEFC and RGFV obtained by a conventional technique (Cardiogreen and biplane LV area-length volumetry). Regression analysis yielded: EF=0-88*EFv (regression line forced through the origin), r = 077, FEF = 0-76 x FEFC + 3, r = 0-96, RGF = 0-94 x RGFV + 5, r = 0-98 (v stands for volumetry).
Introduction
Conventional quantification of aortic regurgitation requires determination of cardiac output (CO) by an indicator dilution technique or by the Fick principle, and calculation of enddiastolic and endsystolic left ventricular volumes (EDV and ESV) from a ventri-culogram. The regurgitant fraction (RGF) is obtained by comparing forward stroke volume FSV = CO/HR (HR = heart rate) and stroke volume SV = EDV -ESV according to the formula RGF(%) = 100 x (SV-FSV)/SV.
This method has some disadvantages. For instance, the two required measurements are not performed simultaneously. Another limitation consists of the moderate accuracy of the calculated volumes EDV and ESV, inherent to the geometric model of the left ventricle (LV), and of the resulting poor accuracy of the stroke volume. This latter is additionally biased by the intra- and interobserver variability in the delineation of the angiographic enddiastolic and endsystolic silhouettes. The limited accuracy of routine cardiac output determination and
conse-Addrrss jor correspondence: Dr J. Divernois, Cardiology Center, University Hospital, CH-1211 Geneva 4, Switzerland.
quently of the forward stroke volume FSV represents a third limitation.
To overcome these drawbacks, other methods based on roentgenvideodensitometry have been proposed11 ~7-91. Falliner and co-workers described a
technique which requires neither CO measurement, nor LV volumetry81. They used an analog
densito-meter to integrate the logarithmic videotape-signal of the recorded angiographic sequence inside the out-lined enddiastolic left-ventricular silhouette in each image, in order to obtain the 'densogram' or 'time dilution curve' (TDC) of the contrast medium injected into the LV. In particular, they described a solution to the problem of drifting baselines in the washout part of the TDC (explained below).
The method presented in this paper is similar to their technique. However, in order to improve the accuracy of the measured densitometric RGF, we tested several sophisticated solutions to the problem of drifting baselines. Our equipment for digital subtraction angiography (Digitron 2, Siemens) allows to define regions of interest (ROI) and to compute the corresponding TDC from the digitally recorded angiographic sequence. This simplifies apparative and operative aspects for roentgendensitometric volume and flow measurement.
Methods
THE DENSITOMETRIC APPROACH
The basic principle of the densitometric method is to compute for each image of the angiographic sequence (selective LV injection) a value M(t) pro-portional to the amount of contrast medium contained in the LV at time t. The proportionality factor is irrelevant because subsequent operations involve only ratios of contrast medium amounts. The values M(t) are obtained from a TDC as explained later. The TDC itself is obtained by summation of the digitized logarithmic video-signal log S(x,y) over all pixels (x,y) of a RO1 drawn around the enddiastolic silhouette of the LV, for each image of the sequence. Obviously constant radiographic settings of KV, mA and videoamplification are a prerequisite. With some assumptions explicited below, the time dependent concentration of contrast medium in the left ventri-cular cavity, respectively the values M(t) can be related
to the corresponding LV volumes of interest (EDV and ESV), and to the regurgitant volume.
The assumptions are:
(1) The mitral valve is competent; (2) the concentra-tion of contrast medium in the LV is homogeneous during each considered systole of the washout phase (the washout phase begins at the end of the injection); (3) the concentration of contrast medium in the regurgitant volume is equal to the concentration which was present in the LV during the systole which just terminated; (4) HR, T, (systole duration), EDV, ESV and RGF are constant during the part of the washout phase selected for determination of EF, FEF and RGF.
A schematic TDC aortic regurgitation is shown in the upper left panel of Fig. 1. The upward deflection of the curve, measured with respect to the baseline and beginning with onset of the injection, is the mentioned value M(t). Based on assumptions (1) to (4), one can show in this simplified case that the
Slog S U , y , t ) Exponential tnvtlop* End lyttollc batt-lin* E 1,,1,+T, D,
B,E beginning and tnd of Injection
— Ad( t )
A . ( t )
Figure 1 Schematic time dilution curves (TDC) in aortic regurgitation. Upper left panel: simplified TDC—the dotted line
shows the constant baseline and the enddiastolic and endsystolic envelopes of exponential washout. The dashed line shows a hypothetical case without regurgitation. Upper right panel: The periodic oscillations of the density before contrast injection define enddiastolic and endsystolic baselines. Bottom panel: With differently drifting enddiastolic and endsystolic baselines, the exponential washout is calculated between the baselines and the non-exponential envelopes. (The ordinate is in arbitrary units )
Digital videodensitometric measurement 23
i A "
4 8 12 16 Time(s)
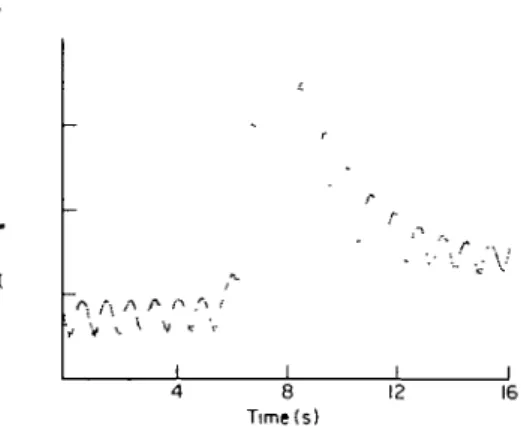
Figure 2 Real TDC of a female patient of 49 years with
an aortic regurgitation fraction of 50%, showing the con-siderable drift of the baseline (The ordinate is in arbitrary units).
enddiastolic (peaks) and endsystolic points (valleys) of the washout part lie on 2 exponentially decreasing curves (envelopes). The dashed line is the hypothetical TDC one would obtain if regurgitation disappeared at the end of the injection (the envelopes of this TDC are also exponentials). Unit and zero lines of the ordinate are arbitrary and have been skipped.
A minor problem consists in the fact that even in the absence of contrast medium in the LV, a real TDC presents a periodic oscillation, due to the varying absorption of involved tissues and ventricular blood during the cardiac cycle (see Fig. 2 and upper right panel of Fig. 1). Thus, the enddiastolic values M(t()
and the endsystolic values M(t( + T,) must be
measured relatively to an enddiastolic and an end-systolic baseline (in dotted lines), respectively. The dashed line represents again the hypothetical TDC for disappearing regurgitation, of which the envelopes are still exponentials. A major problem consists in the drift of both baselines soon after onset of the injection, shifting the TDC progressively upwards (Fig. 2 and bottom panel of Fig. 1), with the result that end-diastolic and endsystolic points (D( and Sj) of a real
TDC do not lie on exponential envelopes. However, the previous 2 exponential envelopes can be found again in the equations
M(t,) = D, - A^t/) = B, exp[Ct,j\
M(t, + T.) = S, - A^t, + T.) = B, exp[C(t, + T,)] (1)
describing the envelopes of a real TDC. A^t) and A / t ) are the (partially) unknown enddiastolic and endsystolic baselines defined relatively to the arbitrary zero line. If the unknown coefficients B*, B, and C of the 2 exponentials can be determined from the TDC,
the ejection fraction (EF), the forward ejection fraction (FEF) and the regurgitant fraction (RGF) can be calculated according to the formulas: EF(%) = [1 - (B,/Bd) expfCT,)] x 100 (2)
FEF(%) = [1 - exp(CT)] x 100
(T is the period of the cardiac cycle in the
washout phase) (3) RGF(%) = [1 - FEF/EF] x 100 (4) Determination of Bj, B, and C implies of course determination of A / t ) and A^t) also.
A simpler approach would be to calculate EF, FEF and RGF from formulae involving only appropriate differences (Cf.[8]): D,+ , ) ] x 100
= EF(%)
EFK%) = [1 ( S , -FEFK%) = [1 - + 1)] x 100 = FEF(%) RGF,(%) = (1 - FEF,/EF,) x 100 = (1 - FEF/EF) x 100 = RGF(%) Thus, 2 adjacent cardiac cycles would yield one set of values EF, FEF and RGF, whereby the fiability of the obtained EF, FEF and RGF would decrease rapidly with increasing order number / of the pair of cardiac cycles (Cf.[8]). An important underlying assumption of this solution is that the 2 unknown baseline portions corresponding to the considered pair are horizontal.A major disadvantage is that all involved differences must be highly accurate, for simple mathematical reasons. Since this was not the case in our study, we first designed a computer fitting algorithm to find 2 horizontal baselines portions for the washout part of the TDC, such that the D( and Si would lie best on
the curves
D, = Aj + Bj exp[Ct(] and
S, = A, + B, exp[C(t, + T,)], where Aj(t) = A* = constant and A^t) = A, = con-stant. This allowed to operate globally with all available cardiac cycles and to obtain the coefficients B,, B, and C needed to calculate the EF, FEF and RGF according to equations (2), (3) and (4). However, this approach sometimes led to irrealistic baselines, suggesting that the drifted true baselines were not simply horizontal as assumed. It was therefore abandoned.
The following method was finally judged appro-priate. The principle of the algorithm is also to find 2 baselines such that the enddiastolic and endsystolic
5-50
12 18
Time ( s )
Figure 3 Reconstruction of the 2 drifted baselines by the fitting algorithm, for the patient shown in Fig. 2
points Df and Sj measured relatively to these new baselines lie best on the exponential curves described by the equation pair (1). However, each baseline is now composed of a sinusoidal segment starting at the end of the true baseline segment (begin of the injection) and of a straight segment (Fig. 3). The beginning of the sinusoidal part is not critical and is set by the operator at the approximate start of the injection. The end of the straight segment can be chosen by the operator, or set by the program at the lowest endsystolic point of the washout part. The best amplitude and best wavelength of each sinusoid, as well as the best coefficients Bj, B5 and C, are found
by the fitting algorithm using the criterion above. The two resulting exponential curves correspond to the equation pair (1), and EF, FEF and RGF are now calculated using formulas (2), (3) and (4).
The various algorithms developed to reconstruct the unknown baselines were tested on many simulated TDC similar to the one of Fig. 1, bottom panel. With the retained algorithm, the obtained values EF, FEF and RGF were always within a few percents of the expected ones Variations of the results secondary to simulated irregularities such as extrasystoles, unstable cardiac period etc. were observed. However, they were within acceptable limits.
APPLICATION TO PATIENTS
10 consecutive patients with clinical aortic regurgi-tation and free of mitral regurgiregurgi-tation were examined. 18 patients without suspected aortic or mitral regurgi-tation (called 'normals' in the following) were also investigated, to assess the performances of the method for very small or zero regurgitation, which cannot be measured accurately by the conventional and by densitometric techniques with left ventricular injection but by roentgendensitometric methods using aortic injection11 ~91. The first patients (regurgitants and
normals) received intraventricular injections of 40 ml of Iohexol (Omnipaque- 350, 15 ml s~'). We lowered then the dose to 20 ml (10 ml s " ') to reduce non-linear densitometnc effects. The sequence was recorded on the Digitron in continuous mode, which provides constant radiographic parameters (kV, mA, video amplification) during the sequence. Imaging rate was 25 frames s" ' and resolution 256 x 256 x 10 bits. The injection was delayed by 5 s to secure the needed 2 initial baselines (2 s are needed to regulate the exposure parameters). The sequence duration was 20 s.
In preliminary investigations sometimes artificial aortic regurgitation induced by the catheter was found. Therefore the catheter was pulled back into
10 Time ( s )
15 20
Figure 4 Left panel: enddiastolic and endsystolic TDC from a palieni without aortic regurgitation. right panel: computer reconstruction of this case.
Digital videodensitometric measurement 25
the aorta at the end of the power injection in all normal patients. Each patient also had biplane LV cineangiography (RAO 30° and LAO 60° projections), 15 min before or after the Digitron sequence. Cardiac output was measured in all patients with regurgitation from two Cardiogreen injections into the left ventricle with sampling in the femoral artery.
Using the available Digitron software, 2 ROIs were drawn around the enddiastolic and endsystolic silhouettes of the LV on adequate mask subtracted images, and the corresponding 2 TDC were computed from the original (unsubtracted) image sequence (Fig. 4). Introduction of an endsystolic ROI allows for elimination of the aortic valve downward movement during systole. (The incursion of the first part of the ascending aorta into the enddiastolic ROI during systole produces an artificial regurgitation if only an enddiastolic window is used).
The 2 computed TDC being automatically normal-ized to the pixel area by the supplied Digitron software, the TDC do not yield the points D(, resp.
Sj, but the points D,,a0Tm, resp. S(.norm. The points D(,norm
measured on the enddiastolic TDC (see Fig. 4), and the points S,.norm measured on the endsystolic TDC
were entered from the multispot film document (Digitron) by means of a graphic tablet into a VAX-750 computer. The enddiastolic and endsystolic points of the initial baselines were also digitized. The surfaces of the 2 ROIs, also registered (number of pixels), were used to 'denormalize' the points Di,Mml,
resp. Si.norm, in order to obtain the points Df, resp. Sf. The obtained points Df and Sf, and the denormalized points of the initial baselines are used by the complex algorithm for determination of the 2 best baselines A^(t) and Aj(t), and simultaneously of the best coefficients Bj, B, and C, as previously explained. The (vertical) distances of these points relatively to the baselines found are the M(t() and M(ti + T.) of
equation pair (1). The EF, FEF and RGF are finally calculated according to equations (2), (3) and (4).
The EDV0, ESVD, and EFD were obtained in the
conventional way using the area-length method (t; stands for 'volumetry'). In 3 patients with inadequate LAO 60° view, calculations were performed using the RAO 30° view only. Determination of CO from the Cardiogreen dilution curves was performed using the standard formula, and RGFU was calculated
accord-ing to the formula given in the introduction. All
80 60 40 20 20 40 60 80 100 8 0 6 0 4 0 2 0
_
f* l--o
V \ 1 1 / y / 9 6 1 20 40 60 80 100 FEF, (%) 20 40 60 RGF, (%)Figure 5 Correlation between ejection fractions obtained by videodensitometry (EF) and
con-ventional method (EF0). Upper right panel—correlation between the forward ejection fractions
10 Time ( s )
15 20
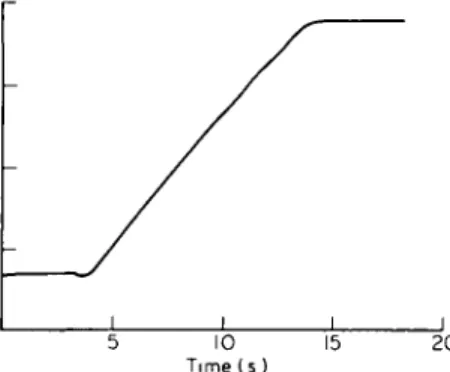
Figure 6 T D C o b t a i n e d by inflating a balloon by a 1 1 0
diluted O m n i p a q u e 350 solution from 0 to 200 ml (20 ml s " ' ) . N o a p p r e c i a b l e non-linearity is observed.
conventional data have been calculated by
cardio-logists of our catheterisation laboratory, in the usual
fashion and independently. They were gathered from
the patient reports for comparison with our method,
which was thus truly compared with routine clinical
results. From the initial 28 patients, 8 were excluded
because of irregular cardiac rhythm in the washout
phase (atria! fibrillation, supraventricular or
ventri-cular extrasystoles), respiration movements displacing
the LV silhouettes out of the ROI's, or for other
reasons mentioned below. Finally, 9 regurgitant and
11 normal patients were retained.
Results
A plot of the obtained densitometric ejection
fractions EF versus the conventional EF
Cis shown in
the upper left panel of Fig. 5. The regression line (in
plain line) has been forced through the origin because
of the small range of the EF,, values. The correlation
between densitometric forward ejection fractions FEF
and conventional FEF
Pis given in the upper right
panel. The bottom panel shows the regurgitant
fraction RGF versus the RGF,,.
Discussion
The densitometric EF are lower than the EF
Oobtained by biplane or monoplane volumetry
(area-length method). An immediate explanation would be
that the M(t) are not proportional to the true amounts
of contrast medium. However, inflating a balloon
placed in a water bath (20 cm depth) with a 1:10
diluted contrast medium solution, from 0 ml to
200 ml (20 ml s~
l), under the same radiographic
conditions as during the recording from patients,
yielded an almost perfectly straight line as shown in
Fig. 6. So, there is no evidence for non-linearity with
these settings in our system. Another reason would
be that assumption (3) is not fulfilled, but this may
produce lower FEF but not lower EF. Thus, we offer
3 hypothetical explanations:
(a) Some contrast medium remains trapped in the
LV cavity during the washout process, so that the
stroke volume would not be recruited in proportion
to the contrast medium. This could be due to undyed
blood coming from the left atrium around the anterior
mitral leaflet which is preferably ejected during
systole. Those effects, however, should be minimized
by the additional mixing due to the aortic
regurgita-tion.
(b) Concomitant opacification of the myocardium
occurs (but the reconstruction of the base lines takes
care of this effect).
(c) The EF are accurate and the EF,, overestimate
the true ejection fractions. It is of interest that the
results of Falliner and co-workers
[81were quite
similar to ours as far as trends are concerned.
The densitometric RGF are in good agreement
with the RGF
D.
The FEF are lower than the FEF
P. If the EF really
underestimates the true EF by correct RGF, then the
FEF also underestimates the true FEF.
Underestima-tion of the true FEF is also possible by correct EF if
assumption (3) is not well fulfilled (if the concentration
of contrast medium in the regurgitant volume would
be higher than in the just previously ejected volume).
But this would imply that the RGF are too high.
Moreover, the obtained FEF are accurate if one
accepts the EF and RGF results.
More generally, acceptance of any two of the 3 sets
of results EF, FEF and RGF implies acceptance of
the third also, since the RGF were obtained from the
EF and FEF [equation (4)].
In the introduction, some unsatisfying aspects of
the conventional method were pointed out. However,
an advantage of this latter over the densitometric
approach is its greater tolerance for irregularities of
the cardiac cycle. Marked irregularities in the TDC
produced EF, FEF and RGF values which were
clearly different from the expected values EF
P, FEF
Pand RGF
C(these patients were therefore excluded).
Some erroneous values could also be attributed to
respiratory movements during the Digitron sequence,
confirmed by retrospective examination of the
sequence recorded also on videotape (these patients
were also excluded).
Digital videodensilometric measurement 27
correct TDC by presumed normal patients were
plausible: The first patient had undergone an aortic
commissurotomy. The other patient had presented
massive mitral regurgitation on a cineangiogram
performed 6 months prior to the study, after an
infarct of the inferior wall. However, he had no slight
regurgitation during the conventional
ventriculo-graphy. Both were excluded from the study.
Conclusion
The method described in this paper shows an
excellent correlation between densitometrically and
conventionally measured aortic regurgitation
frac-tions. The main reason of this lies in the performed
reconstruction of the drifting baselines and in the
introduction of an endsystolic ROI. The ejection
fractions and forward ejection fractions are also well
correlated with the corresponding conventional
values, but in average lower. Explanations are offered
but densitometry is probably more accurate than
conventional methods.
References
[ I ] Rutishauser W. Aorteninsuffizjeru. In. Kreislaufanalyse mittels Roentgendensitometrie Hans Huber Verlag, 1969; 89-92.
[2] Von Bernuth G, Tsakms AG, Wood EH. Quantitation of experimental aortic regurgitation by
videodensi-tometry in intact dogs. Circulation 1970: 41/42 (Suppl III) 60.
[3] Bursch JH, Heintzen PH. Simon R. Roentgenvideo-densitometric determination of the residual fraction of the normal left ventricle and regurgitation fraction in experimental aortic regurgitation. Physiologist 1972; 15: 3.
[4] Simon R, Steiger U, Wirz P, Krayenbuhl HP, Schonbeck M, Rutishauser W. Quantifiziening von Aortenklap-peninsufuzienzen durch videodensitometnsche Kon-trastmittelmengenmessungen. Schweiz Med Wochen-schr 1974; 104: 1562-64.
[5] Bursch JH. Heintzen PH. Some principles for circulatory studies using videodensitometry. In: Heintzen PH, Bursch JH,eds. Roentgen-video-techniques for dynamic studies of structure and function of the heart and circulation, 2nd international conference. Stuttgart: Georg Thieme, 1978; 2-11.
[6] Wessel A, Faltz Ch, Bursch JH. Videodensitometric and videometnc studies of regurgitation and left ventricular volume in experimental aortic insufficiency. In: Heintzen PH, Bursch JH, eds. Roentgen-video-techniques for dynamic studies of structure and function of the heart and circulation, 2nd international conference. Stutt-gart: Georg Thieme, 1978; 80-4.
[7] Simon R. Klinische Kontrastmittel-Densitometrie. Habilitationsschrift. Medizinische Hochschule Hann-over 1981; 61-3.
[8] Falliner A, Bursch JH, Wessel A, Faltz HC, Heintzen PH Zuverlassigkeit der Roentgen-videodensitometne fur Klappeninsuffizienzmessungen und fur die Bestimmung der ventnkularen Auswurffraktion. 2 Kardiol 1981; 70: 754-60.
[9] Erikson U. Densitometry in the diagnosis of aortic incompetence. Acta Radiol Diagn 1976; 17: 361-8