Cell-State-Specific Metabolic Dependency
in Hematopoiesis and Leukemogenesis
The MIT Faculty has made this article openly available.
Please share
how this access benefits you. Your story matters.
Citation
Wang, Ying-Hua et al. “Cell-State-Specific Metabolic Dependency in
Hematopoiesis and Leukemogenesis.” Cell 158.6 (2014): 1309–1323.
As Published
http://dx.doi.org/10.1016/j.cell.2014.07.048
Publisher
Elsevier
Version
Author's final manuscript
Citable link
http://hdl.handle.net/1721.1/105820
Terms of Use
Creative Commons Attribution-NonCommercial-NoDerivs License
Cell state-specific metabolic dependency in hematopoiesis and
leukemogenesis
Ying-Hua Wang1,2,3, William J. Israelsen4, Dongjun Lee1,2,3, Vionnie W.C. Yu1,2,3, Nathaniel T. Jeanson1,2,3, Clary B Clish6, Lewis C. Cantley7,8, Matthew G. Vander Heiden4,5, and David T. Scadden1,2,3
1Center for Regenerative Medicine and Cancer Center, Massachusetts General Hospital, Boston,
MA 02114 USA
2Harvard Stem Cell Institute, Cambridge, MA 02114 USA
3Department of Stem Cell and Regenerative Biology, Harvard University, Cambridge, MA 02138
USA
4Koch Institute for Integrative Cancer Research at Massachusetts Institute of Technology,
Cambridge, MA 02139 USA
5Dana-Farber Cancer Institute, Harvard Medical School, Boston, MA 02115, USA
6Metabolite Profiling Platform, Broad Institute of MIT and Harvard, Cambridge, MA 02142, USA 7Beth Israel Deaconess Medical Center, Department of Medicine, MA 02115, USA
8Department of Systems Biology, Harvard Medical School, Boston, MA 02115, USA
SUMMARY
The balance between oxidative and non-oxidative glucose metabolism is essential for a number of pathophysiological processes. By deleting enzymes that affect aerobic glycolysis with different potencies, we examine how modulating glucose metabolism specifically affects hematopoietic and leukemic cell populations. We find that deficiency in the M2 pyruvate kinase isoform (PKM2) reduces levels of metabolic intermediates important for biosynthesis and impairs progenitor function without perturbing hematopoietic stem cells (HSC), whereas lactate dehydrogenase-A (LDHA) deletion significantly inhibits the function of both HSC and progenitors during
hematopoiesis. In contrast, leukemia initiation by transforming alleles putatively affecting either HSC or progenitors is inhibited in the absence of either PKM2 or LDHA, indicating that the cell state-specific responses to metabolic manipulation in hematopoiesis do not apply to the setting of leukemia. This finding suggests that fine-tuning the level of glycolysis may be therapeutically explored for treating leukemia while preserving HSC function.
© 2014 Elsevier Inc. All rights reserved
Correspondence: David T. Scadden, 185 Cambridge Street Boston, MA 02114 [email protected].
Publisher's Disclaimer: This is a PDF file of an unedited manuscript that has been accepted for publication. As a service to our
customers we are providing this early version of the manuscript. The manuscript will undergo copyediting, typesetting, and review of
NIH Public Access
Author Manuscript
Cell. Author manuscript; available in PMC 2015 September 11.
Published in final edited form as:
Cell. 2014 September 11; 158(6): 1309–1323. doi:10.1016/j.cell.2014.07.048.
NIH-PA Author Manuscript
NIH-PA Author Manuscript
INTRODUCTION
Metabolic state influences cell state and metabolism must be adapted to support specific cell functions. Warburg’s finding that cancer cells preferentially rely on aerobic glycolysis (AG) is a well studied example of how glucose metabolism reflects a particular cell state (Cairns et al., 2011). Nonetheless, the requirement for specific metabolic programs in defined populations of parenchymal cells remains to be explored. Furthermore, little is known about what differential metabolic requirements, if any, exist between normal proliferative cell populations and their malignant counterparts, an issue that the hematopoietic system is uniquely well suited to address. Studies on cancer cell lines have indicated that increased glucose uptake with lactate production regardless of oxygen concentration, or AG, is promoted in part by expression of the M2 isoform of pyruvate kinase (PK) (Christofk et al., 2008a) and the muscle form of lactate dehydrogenase A (LDHA) (Fantin et al., 2006; Le et al., 2010). These two enzymes catalyze the final two steps in glucose fermentation to lactate, and both have attracted attention as potential therapeutic targets. PK catalyzes conversion of phosphoenolpyruvate (PEP) and ADP to pyruvate and ATP. In mammals, the M1 and M2 isoforms are different splice products of PK expressed in tissues other than liver, kidney and red blood cells. PKM1 is expressed in differentiated adult tissues that have high demand for ATP production and metabolize glucose preferentially via oxidative phosphorylation. PKM2 is expressed in early embryonic tissues, cancers and adult cells that have high anabolic activity (Clower et al., 2010; Imamura and Tanaka, 1972). Although PKM1 and PKM2 only differ in the alternatively spliced exon, there are marked differences in their enzymatic activity and regulation. PKM1 exists as a stable tetramer and is constitutively active. The activity of PKM2, in contrast, is allosterically regulated and can exist as a high activity tetramer or a low activity non-tetramer (Anastasiou et al., 2012). PKM2 is activated by metabolic intermediates such as fructose-1,6-bisphosphate (FBP), serine and SAICAR and inhibited by tyrosine-phosphorylated peptides, ROS, and by post-translational modifications (Chaneton et al., 2012; Christofk et al., 2008b; Hitosugi et al., 2009; Keller et al., 2012; Lv et al., 2011; Yalcin et al., 2011). Reduced PKM2 activity favors AG and generation of intermediates necessary for macromolecule synthesis. Pharmacological activation of PKM2 or forced expression of PKM1 decreases AG in cancer cell lines and suppresses
tumorigenesis (Anastasiou et al., 2012; Israelsen et al., 2013; Parnell et al., 2013). PKM2 may therefore serve as a tunable means by which the balance of oxidative phosphorylation versus AG can be shifted to meet different cellular needs.
A distinct, defined regulator of AG versus oxidative phosphorylation is the tetrameric enzyme, LDH, which catalyzes the conversion of pyruvate to lactate. By oxidizing NADH, this reaction regenerates NAD+ to support continued flux through glycolysis. Two LDH subunit isoforms, LDHA and LDHB, are encoded by different genes and combine in varying ratios to form five LDH isozymes (A4, A3B1, A2B2, A1B3, and B4), each with distinct kinetic properties. Many human cancers have higher LDHA levels than normal tissues and elevated LDHA expression has been correlated with poor prognosis and drug resistance (Behringer et al., 2003; Dimopoulos et al., 1991). In addition, LDHA is a direct target gene of c-Myc and HIF-1α, and thought to be a means by which they reprogram metabolism in cancer (Semenza et al., 1996; Shim et al., 1997). Consistent with these observations,
NIH-PA Author Manuscript
NIH-PA Author Manuscript
inhibition of LDHA by either RNAi or small molecules suppresses AG, affects cellular redox state and blocks tumor progression (Fantin et al., 2006; Granchi et al., 2011; Le et al., 2010).
In the hematopoietic system, HSC function has been shown to be sensitive to metabolic perturbations including depletion of HIF-1α and pyruvate dehydrogenase kinase (PDK) (Simsek et al., 2010; Takubo et al., 2010; Takubo et al., 2012). It is not clear if distinctive cell states such as progenitors or hematopoietic malignancies have similar metabolic dependencies as HSCs. Given the role of PKM2 and LDHA in mediating AG in cancer, genetic manipulation of PKM2 and LDHA in the hematopoietic system provides a unique opportunity to address the importance of AG in the context of defined normal and malignant cell types in vivo. In this study, we observed that PKM2 and LDHA are the predominant isoforms expressed by BM hematopoietic cells and therefore used engineered mouse strains to conditionally alter those genes in normal and malignant hematopoietic cells. We
demonstrated that modulating AG has effects on normal hematopoietic cells that depend upon cell state and negatively impacts leukemic growth regardless of cell state. The differential sensitivity of normal and malignant cells to modulation of AG suggests a potential therapeutic opportunity for leukemia intervention.
RESULTS
PKM2 is the predominant isoform of PK expressed in normal hematopoietic and leukemic cells
To determine which PKM isoform is expressed in BM hematopoietic cells in mice, we isolated HSPCs (Lin−cKit+Sca1+, LKS), long-term HSCs (Lin−cKit+Sca1+CD150+CD48−, SLAM) and granulocyte/macrophage progenitors (Lin−Sca1−cKit+CD34+CD16/32hi, GMP) and performed RT-PCR across the alternatively spliced exons, and distinguished between PKM1 and PKM2 message by restriction enzyme digest (Clower et al., 2010; Israelsen et al., 2013). Our data show that PKM2 is the predominant PK isoform mRNA species present in all BM hematopoietic cells (Figure 1A). Expression of PKM2 was confirmed by isoform specific qPCR and western blotting (Figures 1B and 1E). The expression of PKM2 was also examined by intracellular staining with PKM2 antibody and flow cytometry (Figure S1A). PKM2 protein levels appeared to be the highest in Lin+ cells. In Lin− cells all the subsets expressed similar levels of PKM2 except the LS cells that expressed lower levels. There is no difference in PKM2 expression between LKS/CD150+ cells and LKS/CD150− cells. PKM2 is also expressed in leukemic cell lines (Figure 1A).
Conditional deletion of PKM2 in the hematopoietic lineage
Because PKM2 is implicated in promoting AG in cancer cells, we tested whether it is also important for the maintenance of glycolysis in HSCs (Suda et al., 2011). To this end, we utilized a conditional knockout (KO) mouse strain that contains floxed PKM2 specific exon 10 (PKM2fl/fl) (Israelsen et al., 2013) and an Mx1-cre transgene (PKM2fl/fl:Mx1-cre+). PKM2fl/fl:Mx1-cre− mice were used as wild-type (WT) controls. In this model, expression of cre recombinase in BM hematopoietic cells is induced by intraperitoneal (i.p.)
administration of polyinosinic:polycytidylic acid (poly(I:C)). Following poly(I:C) injection,
NIH-PA Author Manuscript
NIH-PA Author Manuscript
BM cells were analyzed and deletion of the PKM2 was confirmed by genomic DNA, mRNA and protein evaluation (Figures 1C-1E). Interestingly, deletion of PKM2 led to PKM1 expression in all BM subpopulations (Figures 1C-E). To quantify the efficiency of PKM2 deletion and PKM1 expression, we performed an intracellular staining of PKM1 and PKM2 proteins followed by flow cytometry. Nearly 90% of whole BM cells were depleted with PKM2 and expressed PKM1 poly(I:C) injection (Figures 1F, S1B and S1C). In the progenitor and stem cell populations, deletion of PKM2 and expression of PKM1 were induced in ~100% of cells (Figures 1F, S1B and S1C). Interestingly, staining cells with an antibody recognizing a common epitope shared by PKM1 and PKM2 (anti-PKM), we observed lower PK expression in PKM2 KO cells compared to control (Figure S1D). Therefore, although PKM1 is induced in PKM2 mutant cells, it is expressed at lower levels than PKM2 in WT cells. This finding is further supported by lower PK enzymatic activity in PKM2−/− cells than WT cells (Figure S1E). Deletion of exon 10 led to the appearance of a misspliced PKM transcript (Figure 1C). A similar transcript was observed following exon 10 deletion in tumors and represented direct joining of exon 8 to 11 that was not translated into a functional protein (Israelsen et al., 2013). Taken together, these results suggest that incomplete repression of exon 9 during splicing allows some PKM1 expression in
hematopoetic cells following excision of exon 10, but overall PK expression is less than that in WT cells. Because PKM1 favors glucose metabolism via oxidative phosphorylation while PKM2 promotes AG, expression of PKM1 in PKM2−/− cells provides an ideal system to address which metabolic mode plays a more important role in hematopoietic cells.
Deletion of PKM2 does not affect hematopoiesis under homeostatic conditions but compromises long-term hematopoiesis in transplantation
To examine the effect of PKM2 deletion on normal hematopoiesis, spleen and BM were analyzed one month following poly(I:C) injection. No significant difference in spleen size, BM cellularity or colony forming ability was observed between PKM2−/− and PKM2fl/fl mice (data not shown). Blood counts of mice for one year after deletion did not reveal significant differences between WT and KO mice (data not shown). Deletion of PKM2 was maintained throughout the duration of the experiment (Figure S1F). Therefore, PKM2 is not required for normal hematopoiesis under homeostasis. Testing whether PKM2 plays a role in hematopoiesis under stress conditions, we performed competitive BM transplantation to assess BM repopulating ability. PKM2−/− or control (CD45.1+) BM mononuclear cells (MNCs) were mixed with competitor BM MNCs (CD45.2+) at a 1:1 ratio and transplanted into lethally irradiated congenic mice (CD45.2+). Peripheral blood was analyzed monthly to measure the contribution from different genotypes. After six months, the PKM2−/− BM cells displayed a moderate but significant decrease in repopulating mature blood cells compared to WT control (Figure 2A). Interestingly the defect was observed specifically in the lymphoid lineage. We then analyzed the BM chimerism at this time point. There was no significant difference in the levels of HSC (SLAM) chimerism. However, progenitor populations including the LS subset displayed less chimerism in the PKM2−/− group (Figure 2B).
Because the competitive disadvantage of PKM2−/− cells in the BM was observed in progenitor populations, we hypothesized that PKM2 might play a role in hematopoietic
NIH-PA Author Manuscript
NIH-PA Author Manuscript
progenitor cell proliferation and expansion. HSPCs sorted from primary recipients were transplanted in equal numbers with competitor BM MNCs into secondary recipient mice. PKM2−/− HSPCs displayed a marked defect in repopulating both myeloid and lymphoid progeny in as early as 4 to 8 weeks following transplantation (Figure 2C). Similar phenotype was observed in tertiary transplantation with HSPCs (Figure 2D). Because the Mx1
promoter has been shown to be activated in BM stromal cells (Walkley et al., 2007) that play a pivotal role in regulating HSC function, we tested whether PKM2 deletion affected hematopoiesis in a cell-intrinsic manner. BM MNCs from PKM2fl/fl:Mx1-cre+ (before deletion) or PKM2fl/fl:Mx1-cre− mice were transplanted together with competitor BM MNCs at 1:1 ratio into lethally irradiated animals. After 10 weeks the recipient mice received poly(I:C) and the peripheral blood was analyzed for 20 weeks. Chimerism of blood cells was equal between PKM2fl/fl:Mx1-cre+ and PKM2fl/fl:Mx1-cre− groups before poly(I:C) injection. Twenty weeks following poly(I:C) injection, mice transplanted with PKM2fl/fl:Mx1-cre+ cells displayed markedly reduced chimerism in multiple lineages compared to controls (Figure 2E). To further assess the role of PKM2 in cell proliferation, we analyzed cell cycle status of BM cells from primary recipients by staining with Ki-67 and DAPI. Among BM subsets, only LKS cells from PKM2−/− mice displayed a decreased proportion in S/G2/M phase with increased G0 phase (Figure 2F). The cycling status of HSCs and mature cell populations was not changed (data not shown). HSPCs seeded in methylcellulose colony assays revealed no difference in colony number, but there was a slight but statistically significant decrease in cell number (Figure 2G), suggesting impaired proliferation in the absence of PKM2. These data demonstrate that PKM2 deletion impairs BM repopulating capacity cell autonomously, likely by affecting progenitor cell
proliferation.
Metabolic changes induced by PKM2 ablation and PKM1 expression
Given that PKM2 is important in maintaining AG in cancer cells, we hypothesized that loss of PKM2 would lead to a more oxidative metabolism in hematopoietic cells. We therefore measured intracellular pimonidazole (Pimo) labeling of BM cells isolated from Pimo-treated. Pimo reacts with free sulfhydryl groups, such as reduced cysteine residues on proteins, to form adducts that can then be detected by antibody staining (Varia et al., 1998). At a given oxygen concentration Pimo adduct formation is determined by the availability of free sulfhydryl groups and thus can be used as a stable readout of the redox state of the cell during the in vivo labeling period. In keeping with a previous study (Takubo et al., 2010), HSCs showed higher Pimo staining than mature cells. Depletion of PKM2 significantly reduced the Pimo staining in both stem cell and progenitor cell populations (Figure 3A), suggesting that these cells have a higher oxidative state in the absence of PKM2. Next we accessed mitochondrial membrane potential by tetramethylrhodamine ethyl ester (TMRE), a cell-permeant fluorescent dye that concentrates in mitochondria in proportion to the
membrane potential. As previously observed using MitoTracker (Simsek et al., 2010), staining with TMRE was lower in HSCs than in mature cells. Interestingly, PKM2−/− HSPCs but not stem cells displayed significantly increased TMRE staining compared to WT counterparts (Figure 3B), consistent with increased mitochondrial membrane potential in this population. We also observed that PKM2 deletion led to reduced lactate production in HSPCs (Figure 3C). Interestingly, this difference was only significant when the cells were
NIH-PA Author Manuscript
NIH-PA Author Manuscript
incubated under hypoxic (1% O2) but not standard culture conditions (20% O2) (Figure 3C).
Oxygen concentrations in the BM environment are closer to 1% than 20% (Parmar et al., 2007; Spencer et al., 2014). Taken together, these results are consistent with the hypothesis that loss of PKM2 and expression of PKM1 results in a shift of glucose metabolism away from AG at physiological oxygen concentrations. To determine whether PKM2 depletion indeed enhanced mitochondrial respiration, we isolated Lin− cells from PKM2fl/fl and PKM2−/− mice and measured oxygen consumption rate (OCR) using a Seahorse XF Analyzer. The basal respiration rate is comparable between PKM2 WT and KO cells; however, the maximal OCR is markedly increased in PKM2−/− cells suggesting that the total electron transport capacity is enhanced in the absence of PKM2 (Figure 3D).
To further delineate the metabolic status in PKM2−/− HSPCs, metabolites were measured. Freshly isolated LKS cells were incubated in serum-free medium in the presence of 20% O2
overnight. Metabolites were extracted and analyzed by liquid chromatography-mass spectrometry (LC-MS). Moderately increased levels of TCA cycle intermediates (citrate, isocitrate and malate) were observed (Figure 3E). Several glycolytic intermediates upstream of PK also accumulated to higher levels in PKM2−/− cells, including phosphorylated glucose or fructose, glyceraldehyde-3-P, phosphoglycerate, and PEP (Figure 3E). Although the PK substrate PEP accumulated about eight-fold higher in PKM2−/− cells than in control, the amount of pyruvate was not changed. This may be explained by overall decrease in the PK activity despite homogeneous expression of PKM1 in PKM2 KO cells (Figure S1E), and the fact that pyruvate levels are affected by enzyme activities other than PK. Elevated
mitochondrial respiration in PKM2−/− cells may reflect an increased capacity to breakdown pyruvate, consistent with the lack of pyruvate accumulation. The levels of multiple
nucleotide mono- and diphosphates in PKM2−/− cells were also altered (Figure 3E). In addition, PKM2−/− HSPCs also displayed a moderate decrease of many amino acids, especially non-essential amino acids that are synthesized from central carbon metabolic intermediates (Figure 3F). Taken together, these data are consistent with the hypothesis that PKM2 deletion with PKM1 expression impairs AG, enhances oxidative metabolism and limits the macromolecule biosynthesis required for cell proliferation.
Deletion of LDHA compromises long-term BM repopulation capacity via a different mechanism than that observed in PKM2−/−mice
To further test whether AG is indeed important for hematopoiesis and leukemogenesis, we generated a mouse strain with floxed LDHA (LDHAfl/fl) alleles; LDHA is the predominate LDH isoform expressed in mouse BM hematopoietic cells (Figure 4A). LDHA conditional mice (LDHAfl/fl) (Figure S2A) were crossed to Mx1-cre mice. Deletion of LDHA was induced by poly (I:C) and confirmed by genomic DNA and mRNA analysis (Figures 4B and S2B-S2D). LDHA deletion did not cause upregulation of LDHB (data not shown). Lactate production by LDHA−/− HSPCs dramatically decreased compared to WT cells in both normoxic and hypoxic conditions (Figure 4C), suggesting that loss of LDHA abrogated both aerobic and anaerobic glycolysis. Erythropoiesis was markedly affected by LDHA deletion as anticipated since red cells depend upon LDH, but no acute changes in other BM
hematopoietic cells under homeostatic conditions were observed (data not shown). Serial BM competitive transplantation was then performed to test whether LDHA is important for
NIH-PA Author Manuscript
NIH-PA Author Manuscript
hematopoiesis under stress conditions. In the primary transplantation, there was an initial advantage of LDHA−/− BM in repopulating multi-lineage blood cells, but this advantage disappeared at a later time point (Figure 4D). When the BM from the primary recipients was transplanted into secondary recipients, LDHA−/− BM displayed marked defects in
repopulation capacity (Figure 4E) with dramatically decreased chimerism among HSCs and others in BM (Figure 4F).
Since deletion of LDHA resulted in a loss of lactate production and defects in long-term BM repopulation, we hypothesized that LDHA depletion impairs growth and expansion of rapidly proliferating progenitor cells. To test this, HSPCs were cultured in cytokine-supplemented methylcellulose media under conditions of normoxia (20% O2) or hypoxia
(1% O2) for one week and the numbers of colonies and cells were counted. In normoxic
conditions, LDHA−/− HSPCs failed to form colonies (Figures 4G). When cultured under hypoxic conditions, LDHA−/− cells were able to form colonies but with markedly smaller size compared to the WT group (Figure S3A). The average number of cells per colony in the LDHA−/− group was decreased by over 60% (Figure 4G). Similar results were obtained when WBM cells were cultured (Figures S3B and S3C). Cell cycle analysis showed that the percentage of cycling cells (S/G2/M) was lower in both progenitor and stem populations from LDHA−/− mice (Figure 4H). Expression of Cyclin D1, a gene important for cell cycle progression through G1 phase (Baldin et al., 1993), was markedly decreased in LDHA−/− HSPCs (Figure S3D). Moreover, decreased expression of HIF1α pathway genes (Hif1α,
Pdk1 and Slc2a1) and anti-apoptotic genes (Bcl-2 and Bcl-XL) was noted in LDHA−/−
HSPCs (Figure S3E).
Because loss of PKM2 moderately decreased lactate production under hypoxia while LDHA deletion abrogated over 90% of lactate generation regardless of oxygen abundance, we hypothesized that LDHA−/− cells exclusively utilize mitochondria respiration to regenerate NAD+ to allow continued glucose metabolism. Indeed, both basal and maximal respiration rates are markedly elevated in LDHA−/− Lin− cells compared to WT control cells (Figure 5A). In addition, hematopoietic progenitor and stem cells from LDHA−/− mice exhibit higher staining for TMRE (Figure 5B) and lower staining for Pimo (Figure 5C), suggesting enhanced mitochondrial membrane potential and a more oxidative state in these cells. Metabolite profiling also revealed that depletion of LDHA led to accumulation of upstream glycolytic intermediates (Figure S4A). Interestingly, the abundance of TCA cycle
intermediates was not changed, despite increased OCR. The levels of multiple nucleotide mono- and diphosphates and amino acids were also decreased in LDHA deleted cells compared to controls (Figures S4A and S4B), consistent with a reduced anabolic activity upon LDHA depletion. In addition to supporting energy production, electron transfer along the mitochondrial respiration chain contributes to the formation of ROS. To test whether enhanced oxygen consumption resulted in higher ROS production, we analyzed BM cells using a ROS indicator, carboxy-H2DCFDA. While PKM2 deletion did not change the ROS level (data not shown), all BM subsets including HSCs from LDHA−/− mice exhibited enhanced levels of ROS (Figure 5D). Because excess ROS has been shown to impair HSC maintenance and long-term repopulation ability (Ito et al., 2004), the increased production of
NIH-PA Author Manuscript
NIH-PA Author Manuscript
ROS in LDHA−/− but not PKM2−/− mice may explain why the stem cell pool was compromised in the former but maintained in the latter throughout serial transplantation. Testing if excess ROS contributes to functional defects of LDHA−/− HSPCs, we performed a rescue experiment by using the antioxidant N-acetyl-L-cysteine (NAC). NAC has been reported to decrease ROS both in vitro and in vivo (Ito et al., 2004; Miyamoto et al., 2007). First, HSPCs were cultured with or without NAC for 48 hours. While NAC did not alter the levels of ROS in HSPCs from LDHAfl/fl mice, it decreased ROS levels in LDHA−/− HSPCs (Figure 5E) and partially rescued the in vitro growth defect of LDHA−/− HSPCs (Figure 5F). To determine whether NAC was able to reverse the increased ROS levels in vivo, LDHA−/− or control mice were fed with regular water or water containing NAC immediately after the last dose of poly(I:C) for 8 weeks. Elevated ROS in LDHA−/− mice was completely reversed by NAC (Figure 5G). Finally, we test whether in vivo NAC treatment also rescued the long-term repopulating defect of LDHA KO BM. Serial BM transplantation was performed and regular or NAC-containing water was provided throughout the experiment (16 weeks for primary and 20 weeks for secondary). Analysis of white blood cell chimerism in secondary recipient animals revealed partial rescue of LDHA−/− BM function by NAC treatment (Figure 5H). The functional rescue of LDHA−/− cells by NAC appears to be at the level of stem cells as the long term HSCs in the BM were partially recovered by NAC (Figure 5I). These data demonstrate that loss of LDHA suppresses proliferation of progenitors and compromises long-term stem cells. The effect on stem cells is caused, at least partially, by increased ROS upon LDHA depletion. Therefore, metabolic changes of different
magnitudes resulting from deletion of the two glycolytic genes, PKM2 and LDHA, both impair long-term repopulation capacity, but appear to affect different hematopoietic cell populations.
Impact of altered glycolysis on leukemogenesis in vivo
While some studies suggest that PKM2 can play a role in cancer cell proliferation (Chaneton et al., 2012; Christofk et al., 2008a; Goldberg and Sharp, 2012; Luo et al., 2011; Lv et al., 2011), other studies show that this isoform is not required for tumor maintenance and growth (Cortes-Cros et al., 2013; Israelsen et al., 2013). Inhibition of LDHA leads to oxidative stress and anti-tumor effects in cancer cell lines (Fantin et al., 2006; Granchi et al., 2011; Le et al., 2010). Those reports however, are mainly based on studies of cell lines derived from solid tumors. Leukemia grows in a very different tissue environment. To address whether in vivo leukemogenesis relies on AG, we transduced human leukemia genes BCR-ABL or MLL-AF9 into mouse BM cells to induce CML or AML-like disease,
respectively. These leukemic alleles are thought to induce disease in different subpopulations of hematopoietic cells. BCR-ABL induces a stem cell-based disease (Takahashi et al., 1998) and MLL-AF9 induces a myeloid progenitor (GMP) disease (Krivtsov et al., 2006). These models therefore could test whether the differential effect of LDHA and PKM2 on normal stem and progenitor cells might result in distinct effects on leukemogenesis. PKM2 or LDHA KO and control mice were given 5-FU (150 mg/kg) and BM cells were harvested 5-6 days later and infected with retrovirus expressing BCR-ABL or MLL-AF9. Next, equal numbers of infected WT or KO cells were injected together with
NIH-PA Author Manuscript
NIH-PA Author Manuscript
equal numbers of supporting normal BM cells into lethally irradiated mice for leukemia development. For both CML and AML, mice transplanted with PKM2−/− or LDHA−/− cells displayed significantly prolonged disease latency (Figures 6A and 6B). Expression of Cyclin D1 was markedly lower in PKM2−/− and LDHA−/− leukemic cells compared to WT control (Figure 6C). As in normal BM, PKM1 was expressed in PKM2−/− leukemic cells and the deletion of PKM2 and LDHA was maintained through disease progression in mice initially transplanted with PKM2−/− and LDHA−/− cells, respectively (Figures S5A-S5D).
We next sought to determine if the leukemogenesis defect observed from PKM2 and LDHA knockout cells was accompanied by alterations in cellular metabolism. Deletion of PKM2 or LDHA resulted in decreased AG in leukemic cells, as revealed by decreased lactate
production (Figures 6D and 6E). Interestingly, the extent to which glycolysis is inhibited is markedly different between these two mutants. While PKM2−/− leukemic cells produced approximately 30% less lactate than WT cells under hypoxic conditions (Figure 6D), loss of LDHA suppressed >90% regardless of oxygen tension (Figure 6E) and markedly reduced glucose consumption (Figure S5E). In contrast to reduced lactate production, oxygen consumption is increased in both PKM2−/− and LDHA−/− leukemic cells compared to WT control (Figure 6F), suggesting enhanced mitochondrial respiration in the absence of PKM2 or LDHA. Measurement of intracellular metabolites revealed a profile similar to that seen in corresponding HSPCs. Both PKM2−/− and LDHA−/− leukemic cells have higher levels of glycolytic intermediates and lower levels of multiple amino acids compared to control cells (Figures S6). PKM2−/− leukemic cells also have higher abundance of TCA cycle
intermediates (Figure S6). These data suggest that depletion of PKM2 or LDHA enforces metabolic shift from glycolysis to mitochondrial respiration and compromises leukemia induction in mice.
Recently PKM2 was reported to play a critical role in protecting acute oxidative stress in human lung cancer cells (Anastasiou et al., 2011). Given that depletion of PKM2 or LDHA in leukemic cells enhanced mitochondrial respiration, we asked whether these cells have compromised capacity for ROS buffering. AML cells from leukemic mice were incubated in the presence or absence of paraquat, a potent generator of mitochondrial ROS, for up to 8 hours. Intracellular ROS was measured by MitoSox Red staining. Endogenous ROS levels without paraquat treatment were comparable between PKM2−/−, LDHA−/− and WT leukemic cells (Figure S7A). Treatment with paraquat drastically enhanced intracellular ROS in all groups with equal efficiency. By staining with viability dye we also observed a higher death rate in LDHA−/− leukemic cells (Figure S7B). Although elevating intracellular ROS, paraquat did not further induce cell death in PKM2−/− or LDHA−/− leukemic cells. Therefore, we conclude that depletion of PKM2 or LDHA does not impair the ROS-buffering capacity in AML cells.
Given that PKM2 and LDHA are important for leukemia initiation, we asked whether they are also important for leukemia maintenance and whether a differential sensitivity exists between normal and malignant cells in response to targeting these two enzymes. Therefore, BM MNCs were prepared from 5-FU treated PKM2fl/fl:Mx1-cre+ or LDHAfl/fl:Mx1-cre+ mice and infected with MLL-AF9 retrovirus. Virally transduced cells were transplanted and after leukemia developed, GFP+ leukemic cells (PKM2fl/fl:Mx1-cre+ or LDHAfl/fl
:Mx1-NIH-PA Author Manuscript
NIH-PA Author Manuscript
cre+) were isolated and co-transplanted with normal BM MNCs that bear the same floxed gene and Mx1-cre gene into lethally irradiated mice. Two weeks later, the secondary recipients were given PBS or poly(I:C) to delete PKM2 or LDHA (Figure 7A). Poly(I:C) does not change leukemia growth on WT background (Sykes et al., 2011). Mice were assessed for leukemic burden by spleen weight and leukemic cell (GFP+) counts in the peripheral blood and BM. In parallel, the numbers of non-leukemic GFP− cells were also quantified to evaluate the effect of PKM2 or LDHA deletion on normal hematopoiesis within the same time window. Deletion of either PKM2 or LDHA significantly suppressed leukemia progression (Figures 7B-7D) while normal white blood cells were not decreased by depletion of either gene (Figures 7C and 7D). Indeed, normal cells were actually increased following deletion of either PKM2 or LDHA. These data suggest that the glycolytic pathway is important for leukemia maintenance and progression and leukemic cells are more sensitive to the inhibition of AG than normal hematopoietic cells.
DISCUSSION
Matching metabolic output with the demands of cellular function is essential for tissue integrity under homeostatic and stress conditions. The studies presented here demonstrate that PKM2 deletion appears to enhance oxidative phosphorylation at the expense of
glycolysis and biomass intermediates in primary hematopoietic progenitors; these results are consistent with a model in which this highly proliferative compartment depends upon AG. The lack of change in ROS upon PKM2 depletion suggests that the degree to which
oxidative glucose metabolism is used is neither as dramatic as LDHA deletion nor sufficient to affect HSC function. The fact that the metabolic parameters are perturbed does not exclude a role for non-metabolic PKM2 functions as has been proposed by others (Luo et al., 2011; Lv et al., 2011; Yang et al., 2011). However, deletion of another metabolic regulator of glycolysis, LDHA, also induced a progenitor defect, thereby suggesting that it is the metabolic functions of PKM2 that dominate in the progenitor phenotype.
In the case of LDHA depletion, there is a loss of HSCs as well as a compromise in progenitor function. The compromise of HSC number is in association with a greater compromise of AG in the LDHA mutant animal and sufficient activation of mitochondrial respiration to generate a detectable increase in ROS. Since the functional defect of LDHA deletion can be partially rescued by antioxidant, it is likely that the excessive ROS levels lead to a decrease in HSC maintenance (Ito, Hirao et al. 2004). The phenotype of LDHA mutant resembles that of the PDK mutant (Takubo et al., 2012) in that both display defects in long-term repopulating activity following transplantation. However, inhibition of PDK only affects stem cells while deletion of LDHA compromises both stem and progenitor populations. Such a distinction may be explained by a differential magnitude in the shift away from AG. PDK indirectly inhibits the conversion of pyruvate to acetyl-CoA to decrease pyruvate oxidation, while LDHA is a direct mediator of pyruvate fermentation to lactate.
Notably, neither modest (PKM2−/−) nor extreme (LDHA−/−) inhibition of AG was sufficient to prevent the development of leukemia induced by the two leukemogenic alleles studied. These data would indicate that this metabolic program is not an absolute requirement for
NIH-PA Author Manuscript
NIH-PA Author Manuscript
cancer initiation. Establishment of malignancy is not dependent on either the metabolic or other putative roles of PKM2, but the progression of either a stem cell (BCR-ABL) or progenitor cell (MLL-AF9) driven leukemia was compromised when the glycolytic enzymes were deleted.
A different phenotype was observed when PKM2 was deleted in a mouse model of breast cancer (Israelsen et al., 2013) with accelerated disease and PKM1 re-expression in the non-proliferating subpopulation of tumor cells. Those data indicate that PKM2 deletion and no re-expression of PKM1 is associated with tumor proliferation, while PKM1 may be required by non-proliferating cells to survive environmental stress in a solid tumor. It remains to be determined whether PKM1 expression increases total PK activity in non-proliferating tumor cells and whether the differential expression pattern of PKM1 leads to additional metabolic alterations. In the hematopoietic system, PKM1 expression was observed in all cells following PKM2 deletion. The hematopoietic progenitor cell function is not affected by PKM2 deletion under homeostatic conditions but is compromised during the stress of transplantation that drives rapid cell proliferation. This suggests that replacing PKM2 with PKM1 results in a loss of flexibility to tune PK activity that is critical for cells to meet different metabolic needs. Fast-growing cells such as hematopoietic progenitor or leukemic cells rely on the capability of PKM2 to regulate their PK activity to support anabolic metabolism. Thus, the difference in disease outcomes between these two models may be explained by the differential expression pattern of PKM1. This may also reflect distinct metabolic dependency between these two tissue types studied.
Leukemia of either of the two types studied appears to use metabolic processes important for normal hematopoiesis to its advantage and by doing so may acquire disproportionate vulnerability to disruption of those pathways. While the impairment of glycolysis induced by either PKM2 or LDHA deletion affected normal hematopoietic function only under the stress condition of serial transplantations, its effects on leukemic latency were evident with first transplantation. In addition, parallel depletion of either of these two genes in normal and malignant cells markedly compromises leukemic cell growth but not normal hematopoiesis. These observations imply a therapeutic window where suppression of glycolysis may preferentially reduce the kinetics of leukemia cell growth. However, the LDHA data indicate that extreme suppression of glycolysis may have more marked effects on normal hematopoiesis. These data therefore suggest that leukemia, like the normal cells from which it arises, depends upon how glucose is metabolized and therapeutic shifts away from AG must be carefully titrated to avoid compromise of the regenerative processes on which tissue maintenance depends.
EXPERIMENTAL PROCEDURES
MiceGeneration of PKM2fl/+ mouse strain was described previously (Israelsen et al., 2013)and crossed with Mx1-cre− mice. were crossed to obtain PKM2fl/fl:Mx1-cre+ and
PKM2fl/fl:Mx1-cre− mice. LDHAfl/+ mouse was generated by crossing
LDHAtm1a(EUCOMM)Wtsi to FLP transgenic mouse and then Mx1-cre+ to create
NIH-PA Author Manuscript
NIH-PA Author Manuscript
LDHAfl/fl:Mx1-cre− mice. Deletion of PKM2 or LDHA was achieved by i.p. injection of poly(I:C) every other day for six days.
Flow Cytometry and Antibodies
BM MNCs were stained with a cocktail of biotinylated antibodies for CD3ε , CD4, CD8, CD11b, CD45R/B220, Gr-1, Ter119 and IL-7R and then with fluorochrome-tagged streptavidin and antibodies for stem/progenitor cell markers, including cKit, Sca1, CD48 and CD150. When necessary, the samples were then fixed and permeabilized for
intracellular staining with PKM1 and PKM2 antibodies. The samples were analyzed with LSRII flow cytometer (Beckman Decon, BD). To isolate HSPCs, BM MNCs were stained with lineage cocktail antibodies followed by incubation with streptavidin-loaded magnetic beads. The suspension was passed through a magnate column to remove all lineage positive cells. Lin− cells were then stained with antibodies against cKit, Sca1, CD150, CD48 and subjected to sorting using a FACSAria instrument (BD).
Bone Marrow Transplantation
For whole BM transplantation, 5x10⁵ BM MNCs from indicated mice were co-transplanted with equal number of WT cells into lethally irradiated congenic mice. For HSPC
transplantation, 2000 LKS cells were transplanted with 4x10⁵ competing BM into lethally irradiated recipient animals. To induce leukemia in mice, BM MNCs were harvested from 5-FU treated mice and infected with MSCV containing MLL-AF9 or BCR-ABL and GFP genes. Equal numbers of infected cells were co-transplanted with supporting BM MNCs into lethally irradiated mice for leukemia development.
Measurement of ROS, Mitochondrial Membrane Potential and Cellular Hypoxia
Cellular ROS was measured by staining cells with 5-(and-6)-carboxy-2',7'-dichlorodihydrofluorescein diacetate (carboxy-H2DCFDA) or MitoSox Red (Life
Technologies) followed by flow cytometry analysis. Mitochondrial membrane potential was analyzed with flow cytometry for TMRE staining (Life Technologies). To measure cellular redox status, mice were injected with 60 mg/kg pimonidazole HCl (Pimo). Ninety minutes later BM cells were harvested and stained with surface markers followed by intracellular staining with FITC-anti-Pimo antibody (Hyproxyprobe). FACS analysis was performed with an LSRII flow cytometer (BD).
Oxygen Consumption Assay
Oxygen consumption rate (OCR) was analyzed in an XF24 Extracellular Flux Analyzer (Seahorse Biosciences) as previously described (Wu et al., 2007) and following the manufacturer’s protocol. Additional details are described in the Extended Experimental Procedures.
Measurement of Metabolites
HSPCs or leukemic cells were incubated in StemSpan serum free medium (Stem Cell Technologies) for 8-10 hours. Cells were lysed in ice-cold 80% methanol containing 0.1% formic acid, dried and reconstituted in water. The soluble faction was analyzed by LC-MS
NIH-PA Author Manuscript
NIH-PA Author Manuscript
as previously described (Christofk et al., 2008a). Lactate and glucose in the supernatant were measured by a YSI 7100 Bioanalytical System (YSI Life Sciences).
Statistical Analyses
Unpaired, two-tailed Student’s t tests were used for analyses comparing two experimental groups. Log-rank tests were used on Kaplan-Meier survival analyses. For all bar graphs, data are represented as mean ± SEM.
Supplementary Material
Refer to Web version on PubMed Central for supplementary material.
Acknowledgments
We thank Drs. Borja Saez, Rushdia Yusuf, Dongsu Park, Stephen Sykes, Demetrios Kalaitzidis and Ninib Baryawno for technical help and valuable suggestions; MGH CRM Flow Core for help with flow cytometry; Min Wu and the lab of Marcia Haigis at HMS for help with the Seahorse Analyzer. Y.H.W was supported by NIH-HSCI Training Grant (5T32HL87735-4) and American Cancer Society. D.L was supported by MGH Fund for Medical Discovery. V.W.C.Y was supported by MGH Federal Share of the Program Income under C06 CA059267, Proton Therapy Research and Treatment Center, BD Biosciences Stem Cell Grant, Bullock-Wellman Fellowship and Tosteson & Fund for Medical Discovery Fellowship. M.V.H was supported by NIH grants P30CA147882 and R01CA168653, as well as Smith Family, the Stern Family, the Burroughs Wellcome Fund, the Ludwig Foundation, and the Damon Runyon Cancer Research Foundation. M.V.H is a consultant and scientific advisory board member for Agios Pharmaceuticals. D.T.S is supported by NIH grants DK050234, HL044851 and CA148180.
REFERENCES
Anastasiou D, Poulogiannis G, Asara JM, Boxer MB, Jiang JK, Shen M, Bellinger G, Sasaki AT, Locasale JW, Auld DS, et al. Inhibition of pyruvate kinase M2 by reactive oxygen species contributes to cellular antioxidant responses. Science. 2011; 334:1278–1283. [PubMed: 22052977] Anastasiou D, Yu Y, Israelsen WJ, Jiang JK, Boxer MB, Hong BS, Tempel W, Dimov S, Shen M, Jha
A, et al. Pyruvate kinase M2 activators promote tetramer formation and suppress tumorigenesis. Nat Chem Biol. 2012; 8:839–847. [PubMed: 22922757]
Baldin V, Lukas J, Marcote MJ, Pagano M, Draetta G. Cyclin D1 is a nuclear protein required for cell cycle progression in G1. Genes Dev. 1993; 7:812–821. [PubMed: 8491378]
Behringer B, Pitako JA, Kunzmann R, Schmoor C, Behringer D, Mertelsmann R, Lubbert M. Prognosis of older patients with acute myeloid leukemia receiving either induction or noncurative treatment: a single-center retrospective study. Ann Hematol. 2003; 82:381–389. [PubMed: 12756497]
Cairns RA, Harris IS, Mak TW. Regulation of cancer cell metabolism. Nat Rev Cancer. 2011; 11:85– 95. [PubMed: 21258394]
Chaneton B, Hillmann P, Zheng L, Martin AC, Maddocks OD, Chokkathukalam A, Coyle JE, Jankevics A, Holding FP, Vousden KH, et al. Serine is a natural ligand and allosteric activator of pyruvate kinase M2. Nature. 2012; 491:458–462. [PubMed: 23064226]
Christofk HR, Vander Heiden MG, Harris MH, Ramanathan A, Gerszten RE, Wei R, Fleming MD, Schreiber SL, Cantley LC. The M2 splice isoform of pyruvate kinase is important for cancer metabolism and tumour growth. Nature. 2008a; 452:230–233. [PubMed: 18337823] Christofk HR, Vander Heiden MG, Wu N, Asara JM, Cantley LC. Pyruvate kinase M2 is a
phosphotyrosine-binding protein. Nature. 2008b; 452:181–186. [PubMed: 18337815]
Clower CV, Chatterjee D, Wang Z, Cantley LC, Vander Heiden MG, Krainer AR. The alternative splicing repressors hnRNP A1/A2 and PTB influence pyruvate kinase isoform expression and cell metabolism. Proceedings of the National Academy of Sciences of the United States of America. 107:1894–1899. [PubMed: 20133837]
NIH-PA Author Manuscript
NIH-PA Author Manuscript
Clower CV, Chatterjee D, Wang Z, Cantley LC, Vander Heiden MG, Krainer AR. The alternative splicing repressors hnRNP A1/A2 and PTB influence pyruvate kinase isoform expression and cell metabolism. Proc Natl Acad Sci U S A. 2010; 107:1894–1899. [PubMed: 20133837]
Cortes-Cros M, Hemmerlin C, Ferretti S, Zhang J, Gounarides JS, Yin H, Muller A, Haberkorn A, Chene P, Sellers WR, et al. M2 isoform of pyruvate kinase is dispensable for tumor maintenance and growth. Proc Natl Acad Sci U S A. 2013; 110:489–494. [PubMed: 23267074]
Dimopoulos MA, Barlogie B, Smith TL, Alexanian R. High serum lactate dehydrogenase level as a marker for drug resistance and short survival in multiple myeloma. Ann Intern Med. 1991; 115:931–935. [PubMed: 1952489]
Fantin VR, St-Pierre J, Leder P. Attenuation of LDH-A expression uncovers a link between glycolysis, mitochondrial physiology, and tumor maintenance. Cancer Cell. 2006; 9:425–434. [PubMed: 16766262]
Goldberg MS, Sharp PA. Pyruvate kinase M2-specific siRNA induces apoptosis and tumor regression. J Exp Med. 2012; 209:217–224. [PubMed: 22271574]
Granchi C, Roy S, Giacomelli C, Macchia M, Tuccinardi T, Martinelli A, Lanza M, Betti L, Giannaccini G, Lucacchini A, et al. Discovery of N-hydroxyindole-based inhibitors of human lactate dehydrogenase isoform A (LDH-A) as starvation agents against cancer cells. J Med Chem. 2011; 54:1599–1612. [PubMed: 21332213]
Hitosugi T, Kang S, Vander Heiden MG, Chung TW, Elf S, Lythgoe K, Dong S, Lonial S, Wang X, Chen GZ, et al. Tyrosine phosphorylation inhibits PKM2 to promote the Warburg effect and tumor growth. Sci Signal. 2009; 2 ra73.
Imamura K, Tanaka T. Multimolecular forms of pyruvate kinase from rat and other mammalian tissues. I. Electrophoretic studies. J Biochem. 1972; 71:1043–1051. [PubMed: 4342282] Israelsen WJ, Dayton TL, Davidson SM, Fiske BP, Hosios AM, Bellinger G, Li J, Yu Y, Sasaki M,
Horner JW, et al. PKM2 isoform-specific deletion reveals a differential requirement for pyruvate kinase in tumor cells. Cell. 155:397–409. [PubMed: 24120138]
Israelsen WJ, Dayton TL, Davidson SM, Fiske BP, Hosios AM, Bellinger G, Li J, Yu Y, Sasaki M, Horner JW, et al. PKM2 isoform-specific deletion reveals a differential requirement for pyruvate kinase in tumor cells. Cell. 2013; 155:397–409. [PubMed: 24120138]
Ito K, Hirao A, Arai F, Matsuoka S, Takubo K, Hamaguchi I, Nomiyama K, Hosokawa K, Sakurada K, Nakagata N, et al. Regulation of oxidative stress by ATM is required for self-renewal of haematopoietic stem cells. Nature. 2004; 431:997–1002. [PubMed: 15496926]
Keller KE, Tan IS, Lee YS. SAICAR stimulates pyruvate kinase isoform M2 and promotes cancer cell survival in glucose-limited conditions. Science. 2012; 338:1069–1072. [PubMed: 23086999] Krivtsov AV, Twomey D, Feng Z, Stubbs MC, Wang Y, Faber J, Levine JE, Wang J, Hahn WC,
Gilliland DG, et al. Transformation from committed progenitor to leukaemia stem cell initiated by MLL-AF9. Nature. 2006; 442:818–822. [PubMed: 16862118]
Le A, Cooper CR, Gouw AM, Dinavahi R, Maitra A, Deck LM, Royer RE, Vander Jagt DL, Semenza GL, Dang CV. Inhibition of lactate dehydrogenase A induces oxidative stress and inhibits tumor progression. Proc Natl Acad Sci U S A. 2010; 107:2037–2042. [PubMed: 20133848]
Luo W, Hu H, Chang R, Zhong J, Knabel M, O'Meally R, Cole RN, Pandey A, Semenza GL. Pyruvate kinase M2 is a PHD3-stimulated coactivator for hypoxia-inducible factor 1. Cell. 2011; 145:732– 744. [PubMed: 21620138]
Lv L, Li D, Zhao D, Lin R, Chu Y, Zhang H, Zha Z, Liu Y, Li Z, Xu Y, et al. Acetylation targets the M2 isoform of pyruvate kinase for degradation through chaperone-mediated autophagy and promotes tumor growth. Mol Cell. 2011; 42:719–730. [PubMed: 21700219]
Miyamoto K, Araki KY, Naka K, Arai F, Takubo K, Yamazaki S, Matsuoka S, Miyamoto T, Ito K, Ohmura M, et al. Foxo3a is essential for maintenance of the hematopoietic stem cell pool. Cell Stem Cell. 2007; 1:101–112. [PubMed: 18371339]
Parmar K, Mauch P, Vergilio JA, Sackstein R, Down JD. Distribution of hematopoietic stem cells in the bone marrow according to regional hypoxia. Proc Natl Acad Sci U S A. 2007; 104:5431–5436. [PubMed: 17374716]
NIH-PA Author Manuscript
NIH-PA Author Manuscript
Parnell KM, Foulks JM, Nix RN, Clifford A, Bullough J, Luo B, Senina A, Vollmer D, Liu J, McCarthy V, et al. Pharmacologic activation of PKM2 slows lung tumor xenograft growth. Mol Cancer Ther. 2013; 12:1453–1460. [PubMed: 23720766]
Semenza GL, Jiang BH, Leung SW, Passantino R, Concordet JP, Maire P, Giallongo A. Hypoxia response elements in the aldolase A, enolase 1, and lactate dehydrogenase A gene promoters contain essential binding sites for hypoxia-inducible factor 1. J Biol Chem. 1996; 271:32529– 32537. [PubMed: 8955077]
Shim H, Dolde C, Lewis BC, Wu CS, Dang G, Jungmann RA, Dalla-Favera R, Dang CV. c-Myc transactivation of LDH-A: implications for tumor metabolism and growth. Proc Natl Acad Sci U S A. 1997; 94:6658–6663. [PubMed: 9192621]
Simsek T, Kocabas F, Zheng J, Deberardinis RJ, Mahmoud AI, Olson EN, Schneider JW, Zhang CC, Sadek HA. The distinct metabolic profile of hematopoietic stem cells reflects their location in a hypoxic niche. Cell Stem Cell. 2010; 7:380–390. [PubMed: 20804973]
Spencer JA, Ferraro F, Roussakis E, Klein A, Wu J, Runnels JM, Zaher W, Mortensen LJ, Alt C, Turcotte R, et al. Direct measurement of local oxygen concentration in the bone marrow of live animals. Nature. 2014; 508:269–273. [PubMed: 24590072]
Suda T, Takubo K, Semenza GL. Metabolic regulation of hematopoietic stem cells in the hypoxic niche. Cell Stem Cell. 2011; 9:298–310. [PubMed: 21982230]
Sykes SM, Lane SW, Bullinger L, Kalaitzidis D, Yusuf R, Saez B, Ferraro F, Mercier F, Singh H, Brumme KM, et al. AKT/FOXO Signaling Enforces Reversible Differentiation Blockade in Myeloid Leukemias. Cell. 2011; 146:697–708. [PubMed: 21884932]
Takahashi N, Miura I, Saitoh K, Miura AB. Lineage involvement of stem cells bearing the philadelphia chromosome in chronic myeloid leukemia in the chronic phase as shown by a combination of fluorescence-activated cell sorting and fluorescence in situ hybridization. Blood. 1998; 92:4758–4763. [PubMed: 9845542]
Takubo K, Goda N, Yamada W, Iriuchishima H, Ikeda E, Kubota Y, Shima H, Johnson RS, Hirao A, Suematsu M, et al. Regulation of the HIF-1alpha level is essential for hematopoietic stem cells. Cell Stem Cell. 2010; 7:391–402. [PubMed: 20804974]
Takubo K, Nagamatsu G, Kobayashi CI, Nakamura-Ishizu A, Kobayashi H, Ikeda E, Goda N, Rahimi Y, Johnson RS, Soga T, et al. Regulation of glycolysis by Pdk functions as a metabolic checkpoint for cell cycle quiescence in hematopoietic stem cells. Cell Stem Cell. 2012; 12:49–61. [PubMed: 23290136]
Varia MA, Calkins-Adams DP, Rinker LH, Kennedy AS, Novotny DB, Fowler WC Jr. Raleigh JA. Pimonidazole: a novel hypoxia marker for complementary study of tumor hypoxia and cell proliferation in cervical carcinoma. Gynecol Oncol. 1998; 71:270–277. [PubMed: 9826471] Walkley CR, Shea JM, Sims NA, Purton LE, Orkin SH. Rb regulates interactions between
hematopoietic stem cells and their bone marrow microenvironment. Cell. 2007; 129:1081–1095. [PubMed: 17574022]
Wu M, Neilson A, Swift AL, Moran R, Tamagnine J, Parslow D, Armistead S, Lemire K, Orrell J, Teich J, et al. Multiparameter metabolic analysis reveals a close link between attenuated mitochondrial bioenergetic function and enhanced glycolysis dependency in human tumor cells. Am J Physiol Cell Physiol. 2007; 292:C125–136. [PubMed: 16971499]
Yalcin S, Marinkovic D, Mungamuri SK, Zhang X, Tong W, Sellers R, Ghaffari S. ROS-mediated amplification of AKT/mTOR signalling pathway leads to myeloproliferative syndrome in Foxo3(−/−) mice. Embo J. 2011; 29:4118–4131. [PubMed: 21113129]
Yang W, Xia Y, Ji H, Zheng Y, Liang J, Huang W, Gao X, Aldape K, Lu Z. Nuclear PKM2 regulates beta-catenin transactivation upon EGFR activation. Nature. 2011; 480:118–122. [PubMed: 22056988]
NIH-PA Author Manuscript
NIH-PA Author Manuscript
Highlights
• Loss of PKM2 or LDHA affects aerobic glycolysis (AG) and reduces leukemia growth.
• Normal cells have cell state-specific sensitivity to the depletion of each enzyme.
• Progenitor and stem cells deplete by modest or extreme AG inhibition respectively.
• Leukemias of either cell type have sensitivity to even modest AG reduction.
NIH-PA Author Manuscript
NIH-PA Author Manuscript
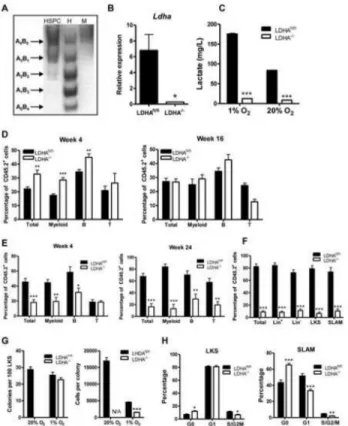
Figure 1. Conditional deletion of PKM2 in mouse BM
(A) PKM2 is the predominant PK isoform expressed by BM hematopoietic cells. RNA was prepared from muscle (M), spleen (Spl), whole BM (WBM), BM subsets (LKS, SLAM, GMP), (A) and leukemic cell lines (K562, THP1). PKM transcript was amplified by RT-PCR, followed by digestion with PstI for exon 10 (PKM2) and/or NcoI for exon 9 (PKM1). Un, uncut WBM.
(B) qPCR assay of PKM2 expression in BM subsets. WBM (whole BM), LK (Lin−cKit+Sca1−), LS (Lin−cKit−Sca1+), LKS (Lin−cKit+Sca1+).
(C) PKM2fl/fl:Mx1-cre+ (M2−/−) or PKM2fl/fl:Mx1-cre− (M2fl/fl) mice were injected with poly(I:C) to delete the exon 10 of PKM2. Genomic DNA isolated from BM MNCs was analyzed by PCR (upper panel). cDNA was amplified and digested by restriction enzyme as described in A (lower panel). Arrow indicates the misspliced PKM transcript.
(D) qPCR of PKM2 and PKM1 transcripts from PKM2fl/fl and PKM2−/− BM cells. (E) Western blotting of PKM proteins in BM MNCs.
(F) Flow cytometry analysis of PKM2 (left) and PKM1 (right) expressing cells in the BM. (n=4-5). Representative FACS plots were shown in Figure S1.
NIH-PA Author Manuscript
NIH-PA Author Manuscript
Figure 2. Deletion of PKM2 affects long-term reconstitution potential of HSCs
(A) BM MNCs from PKM2fl/fl and PKM2−/− mice (CD45.1+) were mixed with competitor BM cells (CD45.2+) at 1:1 ratio and transplanted into lethally irradiated hosts (CD45.2+). Chimerism of multiple-lineage mature cells including myeloid (Gr1+CD11b+), B (CD19+) and T (CD3? +) cells, was analyzed at indicated time points (*p<0.05, n=9).
(B) BM chimerism of recipient mice from A was analyzed at 24–week point post transplantation (*p<0.05, n=9).
(C) HSPCs were sorted from the primary recipient mice and transplanted with competitor BM cells into lethally irradiated hosts. PB was analyzed for mature cell chimerism (*p<0.05, **p<0.01, n=9-10).
(D) HSPCs were sorted from secondary recipient mice and transplanted with competitor BM cells into lethally irradiated hosts and blood chimerism was analyzed at week four (*p<0.05, n=6).
(E) BM NMCs from PKM2 fl/fl:Mx1-cre+ or PKM2fl/fl:Mx1-cre- mice (no poly(I:C) treatment) were transplanted with competitor BM at 1:1 ratio into lethally irradiated hosts. After 10 weeks, the recipient mice received three doses of poly(I:C) and peripheral blood chimerism was analyzed after 20 weeks. The left panel shows the total white blood cell chimerism on the day prior to poly(I:C) treatment and the right panel shows chimerism at 20-week time point post poly(I:C) injection (*p<0.05, **p<0.01, ***p<0.001, n=6-9). (F) Cell cycle status of HSPCs from the primary BM transplantation recipient mice (*p<0.05, **p<0.01, n=4-5).
(G) Proliferation assay of HSPCs. Equal number of LKS cells from PKM2fl/fl and PKM2−/− mice were cultured in methylcellulose medium for 7 days under hypoxic condition and cell number was counted (*p<0.05, n=3).
For all bar graphs, data represented as the mean ± SEM.
NIH-PA Author Manuscript
NIH-PA Author Manuscript
Figure 3. Metabolic characterization of PKM2 deleted HSPCs
(A) Pimo staining to assess the redox state in HSPCs. Pimo was injected into PKM2fl/fl and PKM2−/− mice. Ninety minutes later BM cells were harvested and stained with surface markers, followed by intracellular staining with anti-Pimo antibody. Samples were then analyzed by FACS. (*p<0.05, **p<0.01, ***p<0.001, n=5).
(B) Mitochondrial membrane potential measurement with TMRE staining followed by flow cytometry analysis (*p<0.05, ***p<0.001, n=5-6).
(C) Measurement of lactate production. LKS and LK cells were incubated in serum free medium under normoxia (20% O2) or hypoxia (1% O2) conditions. The concentration of
lactate in the supernatant was measured 12 hours later (**p<0.01, ***p<0.001, n=3). (D) Oxygen consumption assay. Lin− cells were isolated and oxygen consumption rate (OCR) was measured by a Seahorse XF24 Analyzer.
(E and F) HSPCs were incubated in serum free medium for 12 hours. Cellular metabolites were extracted with 80% ice-cold methanol and analyzed by LC-MS. The relative abundance of central metabolites (E) and amino acids (F) were shown.
For all bar graphs, data represented as the mean ± SEM.
NIH-PA Author Manuscript
NIH-PA Author Manuscript
Figure 4. LDHA plays important roles in long-term hematopoiesis
(A) In-gel zymography of LDHA and LDHB in HSPC, heart (H) and muscle (M). (B) qPCR analysis of LDHA transcripts in BM MNCs from LDHAfl/fl:Mx1-cre+ (LDHA−/−) and LDHAfl/fl:Mx1-cre+ (LDHAfl/fl) following poly(I:C) injection (***p<0.05, n=3).
(C) Lactate production by HSPCs. HSPCs were incubated in serum free medium under normoxia (20% O2) or hypoxia (1% O2) conditions for 12 hours. The concentration of
lactate in the supernatant was measured (***p<0.001, n=3).
(D) PB chimerism in primary BM transplantation (**p<0.01, ***p<0.001, n=10). (E) PB chimerism in secondary BM transplantation (**p<0.01, ***p<0.001, n=7-10). (F) BM chimerism in secondary recipients 24 weeks post transplantation (***p<0.001, n=5-9).
(G) HSPCs were plated in methylcellulose medium and incubated under nomoxic (20% O2)
or hypoxic (1% O2) conditions for seven days. The numbers of colonies (left panel) and
cells per colony (right panel) were counted (***p<0.001, n=3-4).
(H) Cell cycle analysis shows LDHA deletion reduces the frequency of cycling cells (S/G2/M) in both LKS and SLAM populations (*p<0.05, **p<0.01, ***p<0.001, n=5-6). For all bar graphs, data represented as the mean ± SEM. Please also see Figure S3.
NIH-PA Author Manuscript
NIH-PA Author Manuscript
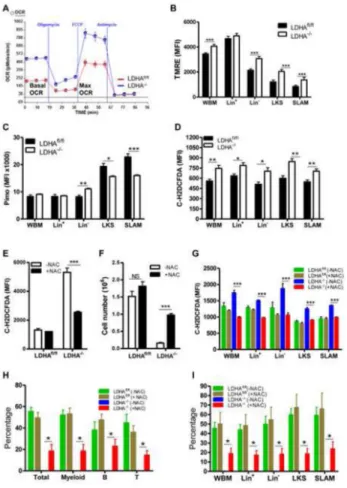
Figure 5. Antioxidant Treatment Partially Rescues the Functional Defects of LDHA−/− BM cells in vitro and in vivo
(A) Lin− cells were isolated from LDHAfl/fl and LDHA−/− mice and oxygen consumption rate (OCR) was measured by a Seahorse XF24 Analyzer.
(B) Mitochondrial membrane potential measurement with TMRE staining followed by flow cytometry analysis (*p<0.05, ***p<0.001, n=6-7).
(C) Pimo staining shows higher oxidative state in LDHA−/− HSPCs and HSCs. (*p<0.05, **p<0.01, ***p<0.001, n=5).
(D) ntracellular ROS levels were increased upon LDHA deletion,. (*p<0.05, **p<0.01, n=5).
(E) n vitro NAC treatment reverses increased ROS in LDHA−/− HSPCs. Freshly isolated HSPCs were incubated in medium supplemented with (+NAC) or without NAC (-NAC) for 48 hours. Cells were then stained with carboxy-H2DCFDA followed by flow cytometry analysis (***p<0.001, n=3).
(F) In vitro NAC treatment reverses the defects in daughter production of LDHA−/− HSPCs. 2000 HSPCs were cultured in methylcellulose medium with or without NAC for one week and cell number were counted (***p<0.001, n=3).
(G) In vivo NAC treatment reverses increased ROS levels in LDHA−/− HSPCs. Immediately following poly(I:C) injection, LDHA-deficient and control mice were divided into two groups. One group was fed with regular water and the other group with water containing 40mM NAC for eight weeks. Intracellular ROS was accessed by staining with carboxy-H2DCFDA followed by flow cytometry analysis (***p<0.001, n=4-6).
NIH-PA Author Manuscript
NIH-PA Author Manuscript
(H and I) In vivo NAC treatment partially rescues the long-term repopulation defects of LDHA−/− BM in serial transplantation assay. Serial transplantation was performed as described in Figure 4. In both primary and secondary transplantation, recipient mice were fed with either regular water (- NAC) or water containing 40mM NAC (+NAC) immediately following BMT. The duration of primary BMT is 16 weeks. The chimerism of
hematopoietic cells in the blood (H) and BM (I) of the secondary recipients was analyzed 20 weeks post transplantation (*p<0.05, n=5).
For all bar graphs, data represented as the mean ± SEM.
NIH-PA Author Manuscript
NIH-PA Author Manuscript
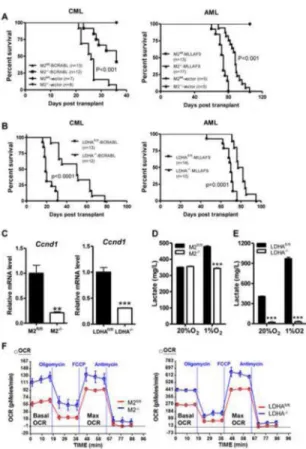
Figure 6. Loss of either PKM2 or LDHA extends disease latency of m yeloid leukemia in mice
(A) PKM2fl/fl:Mx1-cre+ and PKM2fl/fl:Mx1-cre− mice were treated with poly(I:C). After 4 weeks these animals were given 5-FU (150mg/kg). Six days later BM mononuclear cells were harvested, infected with retrovirus expressing BCR-ABL (CML) or MLL-AF9 (AML) and transplanted into sublethally irradiated recipient mice for disease development. Kaplan-Meier survival curve of animals that developed leukemia was shown.
(B) Kaplan-Meier survival analysis of animals transplanted with retrovirually transduced BM cells prepared from LDHAfl/fl and LDHA−/− mice.
(C) qPCR analysis of Cyclin D1 (Ccnd1) mRNA expression in leukemic cells (**p<0.01,***p<0.001, n=3). Data represented as the mean ± SEM.
(D) Lactate production by PKM2fl/fl and PKM2−/− CML cells (***P<0.001, n=5). Data represented as the mean ± SEM.
(E) Lactate production by LDHAfl/fl and LDHA−/− AML cells (***P<0.001, n=3). Data represented as the mean ± SEM.
(F) Measurement of oxygen consumption rate of AML leukemic cells. Please also see Figures S5-S7.
NIH-PA Author Manuscript
NIH-PA Author Manuscript
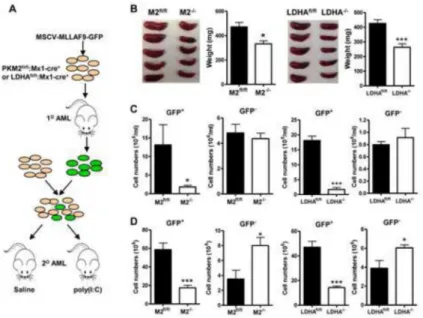
Figure 7. Deletion of PKM2 or LDHA retards progression of established leukemia without compromising normal hematopoietic cells
(A) Experimental scheme. BM MNCs from 5-FU treated PKM2fl/fl:Mx1-cre+ or
LDHAfl/fl:Mx1-cre+ mice were infected with MLL-AF9 virus to generate primary leukemia. 50,000 primary leukemic cells (GFP+) were co-transplanted with 500,000 normal BM cells (GFP-) that contain the same floxed gene and Mx1-cre into lethally irradiated hosts. Seven to ten days later, the recipient mice were administered with or saline (PKM2fl/fl, LDHAfl/fl) or poly(I:C) to delete PKM2 or LDHA gene (PKM2−/−, LDHA−/−). At the first presentation of leukamia, all mice were euthanized to access leukemia burden.
(B) Size and mean weight of spleens (n=6). Data represented as the mean ± SEM. (C) The numbers of leukemic cell (GFP+) and normal hematopoietic cells (GFP−) in peripheral
(D) The numbers of leukemic cell (GFP+) and normal hematopoietic cells (GFP−) in the BM. For all the figures, *p<0.05, ***p<0.001, n=6. Data represented as the mean ± SEM.