Publisher’s version / Version de l'éditeur:
Canadian Geotechnical Journal, 31, 6, pp. 803-816, 1994
READ THESE TERMS AND CONDITIONS CAREFULLY BEFORE USING THIS WEBSITE.
https://nrc-publications.canada.ca/eng/copyright
Vous avez des questions? Nous pouvons vous aider. Pour communiquer directement avec un auteur, consultez la première page de la revue dans laquelle son article a été publié afin de trouver ses coordonnées. Si vous n’arrivez pas à les repérer, communiquez avec nous à PublicationsArchive-ArchivesPublications@nrc-cnrc.gc.ca.
Questions? Contact the NRC Publications Archive team at
PublicationsArchive-ArchivesPublications@nrc-cnrc.gc.ca. If you wish to email the authors directly, please see the first page of the publication for their contact information.
NRC Publications Archive
Archives des publications du CNRC
This publication could be one of several versions: author’s original, accepted manuscript or the publisher’s version. / La version de cette publication peut être l’une des suivantes : la version prépublication de l’auteur, la version acceptée du manuscrit ou la version de l’éditeur.
Access and use of this website and the material on it are subject to the Terms and Conditions set forth at
Comparison of predicted and observed responses of pipeline to
differential frost heave
Rajani, B. B.; Morgenstern, N. R.
https://publications-cnrc.canada.ca/fra/droits
L’accès à ce site Web et l’utilisation de son contenu sont assujettis aux conditions présentées dans le site LISEZ CES CONDITIONS ATTENTIVEMENT AVANT D’UTILISER CE SITE WEB.
NRC Publications Record / Notice d'Archives des publications de CNRC:
https://nrc-publications.canada.ca/eng/view/object/?id=be1b490a-930c-4777-9ce7-b1410c4d19c1 https://publications-cnrc.canada.ca/fra/voir/objet/?id=be1b490a-930c-4777-9ce7-b1410c4d19c1Com pa rison of pre dic t e d a nd obse rve d re sponse s of pipe line t o
diffe re nt ia l frost he a ve
N R C C - 3 8 9 9 5
R a j a n i , B . B . ; M o r g e n s t e r n , N . R .
J a n u a r y 1 9 9 4
A version of this document is published in / Une version de ce document se trouve dans:
Canadian Geotechnical Journal, 31, (6), pp. 803-816, 94
http://www.nrc-cnrc.gc.ca/irc
The material in this document is covered by the provisions of the Copyright Act, by Canadian laws, policies, regulations and international agreements. Such provisions serve to identify the information source and, in specific instances, to prohibit reproduction of materials without written permission. For more information visit http://laws.justice.gc.ca/en/showtdm/cs/C-42
Les renseignements dans ce document sont protégés par la Loi sur le droit d'auteur, par les lois, les politiques et les règlements du Canada et des accords internationaux. Ces dispositions permettent d'identifier la source de l'information et, dans certains cas, d'interdire la copie de documents sans permission écrite. Pour obtenir de plus amples renseignements : http://lois.justice.gc.ca/fr/showtdm/cs/C-42
Comparison of predicted and observed responses of pipeline to differential
frost heave
B. RAJANI
Institute for Research in Construction, National Research Council of Canada, Ottawa, ON KIA OR6, Canada
AND
N. MORGENSTERN
Department of Civil Engineering, The University of Alberta, Edmonton, AB T6G 2G7, Canada
Received February 14, 1994 Accepted July 12, 1994
This paper describes the application of a simplified Winkler model to simulate the observed time-dependent responses of a pipeline at Caen, France, subjected to differential frost heave. The numerical Winkler model developed for a semi-infinite beam embedded in a creeping medium was used to evaluate the response of the Caen pipeline. Despite its simplicity, the Winkler model is able to predict the overall response of deflections and stresses which com-pares satisfactorily with observed data. In a previous study, the same Winkler analysis was applied to small-scale model steel pipelines embedded in polycrystalline ice, and satisfactory comparisons between the predicted and observed responses were obtained. Consequently, the analyses presented in this paper serve to reconfirm that the Winkler model can also be applied to analyze large-diameter pipelines subjected to differential frost heave.
Key words: chilled pipelines, creeping foundation, frozen soils, frost heave.
Cet article decrit Ia simulation au moyen d'un modele simplifie des reactions en fonction du temps observees
a
Caen, France, d'un pipeline subissant un soulevement differentiel du au gel. Le modele numerique de Winkler mis au point pour une poutre semi-infinie enfouie dans un milieu en fluage a ete utilise pour evaluer Ia reaction du pipeline de Caen. En depit de sa simplicite, le modele de Winkler peut faire des predictions de Ia reaction globale des deflexions et des contraintes se comparant de fa"on satisfaisante aux donnees observees. Dans une etude anterieure, Ia meme analyse de Winkler a ete appliqueea
un modelea
petite echelle de pipelines d' acier enfouis dans de Ia glace polycristalline, et !'on a obtenu des comparaisons satisfaisantes entre les reactions predites et observees. En consequence, les analyses presentees dans cet article a permis de reconfirmer que le modele de Winkler peut aussi s'appliquera
I' analyse de pipelines de fort diametre assujettis
a
du soulevement differentiel dG au gel.Mots c!es : pipelines froids, fondation en fluage, sols geles, soulevement dG au gel.
[Traduit par Ia redaction] Can. Geotech. J. 31, 803-816 (1994)
Introduction
803
Various proposals for the construction of a chilled gas pipeline to carry gas from the northern Canadian frontier regions have been under discussion since the late 1970s. During the design stage, when the first preliminary studies were carried out, it was identified that the pipeline would be subjected to significant differential frost heave. High longitu-dinal stresses will be induced in the pipeline when it crosses regions of discontinuous permafrost, i.e., zones with soils of different frost susceptibilities and also at transitions from frozen to unfrozen soils.
tions and bending stresses as differential frost heave devel-oped. The details about the experimental site and the exper-imental data gathered during four freeze-thaw cycles are available through numerous reports (Dallimore and Crawford 1985; Geotechnical Science Laboratories 1986, 1988, 1989).
In the early 1980s, Geotechnical Science Laboratories at Carleton University together with other organizations in Canada and France through a collaborative agreement planned to set up a controlled experimental facility to study pipeline -frozen soil interaction. These efforts resulted in an experi-mental setup at Caen, France, that closely resembled the anticipated field conditions and provided a wealth of exper-imental data. In the setup at Caen, a 0.27 m diameter pipeline was buried in a 18 m long test pit of which one half was filled with sand and the other half with silt. This created a vertical sand-silt interface in the middle of the test pit. The difference in frost susceptibilities of sand and silt was to ensure that differential frost heave would develop in the vicinity of the sand-silt interface, thereby straining the pipeline in the immediate vicinity of this vertical interface. The pipeline was instrumented to monitor both
deforma-Pnnted in Canada I Imprime au Canada
Ever since the chilled gas pipeline concept was proposed, the effect of frost heave on the performance of pipelines has been identified as an important issue that should be addressed. Two important questions that are of concern to pipeline designers are as follows: what level of longitudinal strains can be tolerated in a pipeline before serviceability is seriously hindered or the pipeline no longer meets code requirements? and how can structural integrity be assured? Two previous procedures have been proposed to estimate pipeline strains, but, as discussed later, they have their lim-itations and shortcomings. In a previous paper (Rajani and Morgenstern 1992), a model based on a beam on a Winkler creeping foundation was developed to analyze a pipeline subjected to differential frost heave. In this analytical and numerical model, the creeping foundation (frozen soil) is represented by discrete springs whose characteristics are defined in accordance with Norton's flow law. This model was used by Rajani and Morgenstern (1993) to simulate the experimental behaviour of model steel pipelines embedded in polycrystalline ice. Satisfactory agreement was obtained between observed and predicted responses.
The purpose of this paper is to illustrate the use of this Winkler model to predict the response of the chilled gas pipeline at Caen in terms of deformations and stresses and its variation with time. Subsequently, the predicted responses are compared to the observed responses.
Background to finite element solution for beams embedded in creeping medium
Unlike analytical methods, the finite element method has the added advantage that problems with arbitrary loading and kinematic boundary conditions can be solved with little difficulty. Upper and lower bounds of responses for beams embedded in a Winkler creeping medium were established (Rajani and Morgenstern 1992) by using the Rayleigh-Ritz and Martin's inequality procedures. These analytical solutions were validated by using a simple Winkler finite element model. On initial vertical movement of the pipeline at the sand-silt interface, there is an immediate elastic response (H•c), and this response is determined by the usual "beam on elastic foundation" type solutions. Subsequent creep response
( w c) depends on the interaction of the beam and the creep-ing characteristics of the foundation material. The total (accumulated) response can be estimated by the application of superposition of states, which can be expressed as [l] w(t)""W e (0)+J1 }i' (T)dT
0 c
where w is transverse displacement in the
z
direction, t is time, li'c is displacement rate. This approximation defines the superposition of (i) an elastic response, determined as if there were no creep; and (i i) a pure creep response, deter-mined as if there were no elastic response. The elastic response is obtained from a "beam on elastic foundation" type analysis, where the elastic foundation is represented by coefficients of subgrade reaction (k;) derived from con-cepts of elasticity. As described below, the creep response is determined by representing the creeping characteristics of the frozen soil with Norton's flow law. In the description of the Winkler model below, the pipeline is often referred to as the beam and the surrounding frozen soil as the creep-ing foundation or medium.It is understood that creep is the increases in response even when the initial load and its elastic response remain the same. Consequently, the creep response is dependent on the elastic response, and it becomes as important to estab-lish elastic constants as the creep constants for the prediction of total response. An analysis (Rajani and Morgenstern 1992) of a beam on a linear viscous foundation, the creep exponent in Norton's relation n
=
l, indicates that the initial static response sets up a stationary stress wave along the beam-foundation system, and the subsequent creep response sets up another stress wave that is of similar shape to the elastic response.Elastic response
In a "beam on elastic foundation" type analysis, the elas-tic foundation is represented by discrete elaselas-tic springs. The stiffness characteristic of the foundation is known as the foundation subgrade modulus (k;) and is given by
1 [2] w = - q
c
k:
where q is the reaction per unit length on the loaded beam of width b. Since the steel pipeline is a manufactured product
meeting specified quality assurance, significant variations in the material and section properties of the pipeline are not expected. However, we cannot say the same for soils properties and especially for frozen soils, since elastic and creep properties depend, amongst other factors, on strain levels, void ratio, and temperature. Hence, any shortcomings in the elastic response of the pipeline will be principally due to the uncertainties in the estimate of the foundation subgrade modulus.
The Winkler foundation subgrade modulus can be derived from plate load tests, but a common alternative is to derive it directly from elastic continuum properties. The elastic properties are the elastic modulus (£5) and Poisson's ratio (vJ
of the surrounding medium. These elastic properties can be estimated from either in-situ or laboratory tests on frozen soil samples. Vesic (1961) and Biot (1937) have proposed for-mulae based on comparison of analytical solutions that attempt to relate elastic properties to foundation subgrade modulus. It is important to note, however, that estimates of the foundation subgrade modulus from these formulae can dif-fer by as much as 30-40% (Scott 1981). Nonetheless, a relation between the elastic modulus of the continuum and the foundation subgrade modulus proposed by Vesic (1961) has been commonly used:
[3]
k'= 0.65Es 12/Esb4s 1-
v;
I
EIwhere b is the beam width (pipeline diameter), and EI is the beam (pipeline) flexural stiffness, where E is the beam elastic modulus, and I is the beam moment of inertia.
Typical solutions for a beam on a Winkler elastic foun-dation are readily available in textbooks, such as Poulos and Davis (1980). The elastic response (we) for a beam on an elastic foundation is described by the following differential equation: [4] ()4w E l -4e +k:we =0
ax
Since the elastic response for a particular problem depends on the loading and boundary conditions, the characteristic length,
1113,
is the most important variable that depicts the elastic interaction between the pipeline and soil stiffnesses. The parameter,13,
has dimensions L - I and it is defined ask:
[5]
134
= 4EIThe parameter
13
is a ratio of soil subgrade and beam stiff-nesses. The reciprocal of13
is the characteristic length of the soil-beam system. Thus, the characteristic length is a measure of the interaction between the beam and the elastic foundation. As we shall see later, the characteristic length,1113,
plays a crucial role in the idealized response of a pipeline subjected to frost heave.Creep response
The Norton creep relationship, rewritten in the generalized form as proposed by Ladanyi (1972), is
[6]
{itセ@
r
or E =BIT"where E is the axial strain rate;
IT
is the axial stress; E0 andIT
0RAJANI AND MORGENSTERN 805 n are creep constants. Typically, n is about 3 for ice at low
stresses (Morgenstern et al. 1980) and icy silts (McRoberts et al. 1978). In search for the dependence of n and B on temperature, Morgenstern et al. (1980) found from analyses of available creep data that ice behaves like a linearly viscous material at temperatures close to 0°C. The constant, B, is found to be temperature and material dependent.
With elastic response, [2] relates displacement and soil reaction through the foundation subgrade modulus. Nixon (1978) developed a relationship between the displacement rate (w) of a strip footing and the stress on the loaded area in a creeping medium. If the flow law, as expressed in [6],
is used to characterize the creep behaviour of the frozen soils, the relation between displacement rate (we) and stress (p)
given by Nixon (1978) is
[7]
where p is the intensity of pressure on the loaded area, and
lr is the influence factor, which is dependent on the creep exponent n (Rajani and Morgenstern 1992) and the geometry of the loaded beam. Since the beam width is b, the soil reac-tion per unit length, q, is given by the following expression:
UrBb/2)
[8] we= q"=B'q"
(b)"
where B' is referred to as the creep compliance coefficient for the foundation.
If creeping frozen soil is represented by the Winkler "creep" springs as expressed in [8], the creep response (we) of the elastic beam and the surrounding frozen medium can be described by the solution to the following differential equation (Nixon 1984; Rajani and Morgenstern 1992):
[9]
El ()4wc +Hセjャャョ@
= 0Clx4 B'
The corresponding boundary conditions are defined later. For the ideal case of a linear viscous foundation, i.e., n
=
1, Rajani and Morgenstern (1992) showed that the creep response of a beam on a creeping foundation can be expressed in terms of the creep characteristic length: [10]f3
4 - 1c - 4EIB't
The comparison of the elastic (eq. [5]) and creep (eq. [10]) characteristic lengths shows similarity where the elastic foundation subgrade modulus is replaced by the equivalent creep term (liB' t), which is an inverse function of time.
Solution technique
Full details for the analytical and numerical solutions to the problem of interaction of a beam on the creeping foun-dation defined above have already been described in Rajani and Morgenstern (1992). Therefore, only essential points are discussed here. Upper and lower bound estimates were obtained for the creep response of a semi-finite beam loaded at one end by solving the differential equations indicated above. Although these solutions provide insight into the behaviour and understanding of the interaction of a beam in a creeping medium, they do limit the analysis to ideal situations, i.e., homogeneous medium. The validity of these solutions was demonstrated by analyzing the same problem with finite elements (discrete beam-spring model) where
the pipeline is represented by the classical beam element and the foundation is represented by truss (Winkler) springs whose material properties follow the elastic constitutive relation and Norton's flow law.
The characteristics of the Winkler truss springs can be established (Rajani and Morgenstern 1992) by equating work done in the continuous and discrete systems and considering the fact that the material properties of both the spring and the continuous creeping foundation are defined in [8] and [6], respectively. Assuming an arbitrary spring spacing, s, and of length, L, the cross-sectional area of the spring, Aspring' and
the elastic modulus of the springs, £spring' are given by
[11]
A,,ri,,
=b{
セセセ@
r
[12] E spring = - - -
sLk;
A springThe characterization of the viscoelastic discrete Winkler springs in terms of previously defined variables for the beam in a creeping medium permits the finite element solution of the pipeline in the conventional manner.
The governing differential equations [ 4] and [9] for the viscoelastic problem can be expressed in Galerkin 's weak form, which is suitable for finite element implementation. One code that has incorporated within it a truss element with the Norton's flow law is the finite element code ADINA (Adina R&D, Inc. 1987). The Newton-Raphson iterative procedure is used to solve the nonlinear problem. The analy-sis needs to be pursued using a time integration procedure, since the creep response expressed by [9] is in terms of the displacement rate, セカ@ c· Additional details concerning time
integration for solving creep problems can be found in Bathe (1982). An implicit time integration, a method, was used in the analysis, since the scheme is unconditionally stable for
a > 112 for any time-step size, though it may not necessarily
converge to the correct solution.
Simulation of a pipeline subjected to differential frost heave
In general, the success or failure to predict the response of any soil-structure with confidence will depend both on the analytical or numerical model as well as on the uncertainties in the input data that intervene in the analysis. Therefore, it is imperative to discuss the available soil properties and differential frost heave that, in particular, determines the "forcing function," i.e., prescribed displacement at the sand-silt interface. First, we briefly review past efforts to predict the response of pipelines subjected to differential frost heave and point out their shortcomings. The observed responses of displacements and stresses are subsequently related to expected idealized responses, thereby obtaining an estimate for elastic properties for frozen soils. Finally, the analysis of the chilled gas pipeline at Caen is discussed and compared to observed responses.
Previous prediction efforts
Nixon et al. (1983) attempted to numerically determine the response of a hypothetical pipeline traversing zones of soils susceptible and nonsusceptible to frost heave. However, the pipeline was considered a passive component of the whole system, and hence its interaction with the sunounding
806
sand-silt interface water supply
concrete wall
100 mm insulation
....,..1---18m
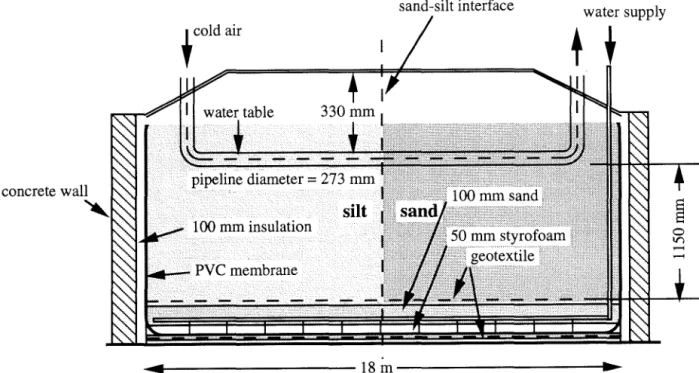
MMMMMMMMMMMMゥセ@FIG. 1. Longitudinal section of test pit for pipeline at Caen, France (not to scale). frozen soils was not studied. Consequently, as far as the
analysis is concerned, the problem could be resolved in terms of plane strain conditions. Free-field frost heave, defined here as the frost heave that would take place in the absence of any restraints, was applied over a predetermined section of the frost-susceptible soil. Nixon et a!. studied the attenuation of frost heave specifically at the vertical interface of the frost-susceptible and non-frost-susceptible soils. Frost heave attenuation was studied by varying elastic moduli, permafrost thickness, and lateral extent of the frost-susceptible soil expressed in terms of half-widths of the total pipeline system. Though the study was based on specific material properties and geometry of the discontinuous permafrost, it was found that the free-field frost heave was significantly attenuated at the vertical interface of the frost-susceptible and non-frost-susceptible soils. In the case of the frost heave data from the Caen study, frost heave attenuation at the sand-silt interface is in the order of 50-60%.
Ladanyi and Lemaire (1984) attempted to back-analyze the Caen pipeline experiments using a simplified model based on the elastic Winkler foundation that accounted for free-field frost heave in an idealized manner. The proposed procedure did not attempt to simulate observed behaviour over any particular time period, but rather it attempted to determine by trial and error the reduced foundation sub-grade modulus, ォセL@ at one specific time that would match the measured stresses in the pipeline. Though soil-pipeline interaction is accounted for in the analytical procedure sug-gested by Ladanyi and Lemaire ( 1984 ), it does not take into account the fact that frozen soils behave like a creeping medium, and consequently the analysis is quasi-static and the time variable is not involved.
From the preceding discussions, we conclude that at pres-ent no realistic attempt has been made to predict the response of a pipeline where the pipeline has been subjected to dif-ferential frost heave during a period of 250 days. In this paper, the viscoelastic Winkler spring model is applied to simulate the response of the pipeline at Caen, France, for two of the four freeze cycles.
Field observations
The experimental pipeline facility at Caen, France (Fig. 1), is the only field study (at least where experimental data are publicly available) where frost heave and corresponding longitudinal bending stresses induced in the pipeline have been monitored over a significant period. The steel pipeline is 0.273 m in diameter and buried at a depth of 0.33 m. The pipeline was instrumented to monitor vertical dis-placements of the crown of the pipeline and flexural strains at the top and bottom fibres of the pipeline. At several loca-tions instrumentation was placed in the soil surrounding the pipeline to measure temperature, pore pressures, and earth pressures. Regular measurements of the levelling rods attached to the top of the pipeline permitted the monitor-ing of vertical pipeline displacement.
Throughout the analysis, it is assumed that displacement at the top of the pipeline does not significantly differ from that at the centre (neutral axis) of the pipeline. Since the flexural strains remained well within the elastic range, the stresses were reported (Dallimore and Crawford 1985) instead of strains. For ease of reference, the vertical displacement and stress profiles along the pipeline are reproduced in Figs. 2 and 3 for the first and second freeze periods, respectively. A look at a typical observed vertical displacement profile of the portion of the pipeline embedded in the sand shows that it underwent minor differential movement beyond 4 m from the sand-silt interface. This probably reflects on the rel-ative stiffnesses of the pipeline and the surrounding frozen sand. In contrast, the portion of the pipeline embedded in silt shows significant rotation at about 7 m away from the sand-silt interface.
The observed stress history profiles (Figs. 2 and 3) reveal a near-zero stress state at the sand-silt interface. The stress distribution along the pipeline follows a double curvature pattern on either side of the sand-silt interface. The ampli-tudes of the stress profile for the pipeline embedded in sand and silt are not too different to suggest that near-surface effects are important. Meanwhile, the stress wave for the pipeline in sand is a half-sinusoid and in silt a distorted
RAJANI AND MORGENSTERN 807 (a ) 180 silt sand 160
§
140 ...;' c: 120a
Q) セ@ 100 0.. (/] ;a 80 til u"€
60 Q)--
40 20 0 -8 -6 -4 -2 0 2 4 6 8distance along pipeline, m
(b) 160 83/02/08 (140 days) silt sand 82112/07 (77 days) -160 -8 -6 -4 -2 0 2 4 6 8
distance along pipeline, m
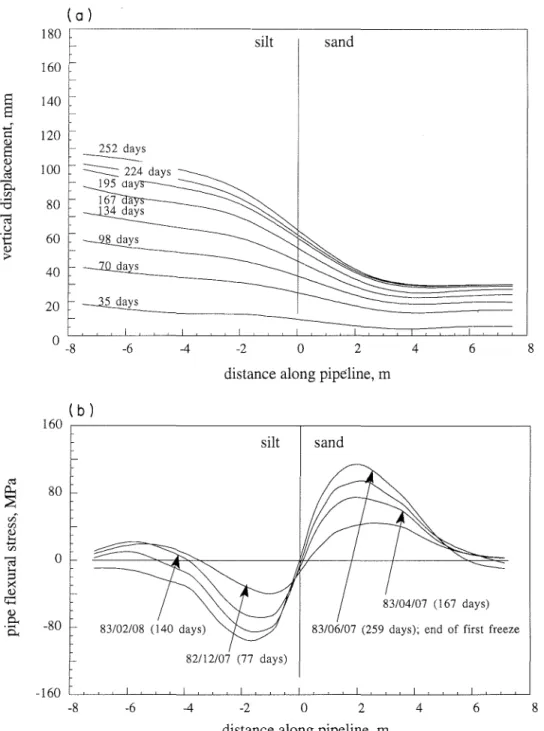
FIG. 2. Vertical displacement profiles (a) and bending stress profiles (b) during the first freeze period for pipeline at Caen, France (after Dallimore and Crawford 1985).
full-sinusoid. The stress wave for the portion of the pipeline in silt steadily approaches that of a distorted sinusoidal wave form but with significant stress in the pipeline at the far end as compared with stress at the homologous point in the pipeline embedded in sand. This is true especially for long time periods and in the second, third, and fourth freeze periods. We also note that the peak stresses occur at approx-imately 2-2.2 m in sand and 1-1.5 m in silt from the sand-silt interface. The position of the peak stress is not stationary but steadily shifts with time toward the far ends from the sand-silt interface at the centre. The steady propagation of stress waves toward the free end may be related to the con-tinually changing elastic and creep properties of the sur-rounding frozen soils because of the steady advancement of the freezing front.
These observations are equally valid for the third and
fourth reported freeze periods not discussed here. From the available data for the pipeline stresses, it appears that, due to a probable malfunction of the strain gauges on the pipeline embedded in silt, the stresses beyond 4.25 m from the sand-silt interface were not registered during the third and fourth freeze periods.
Geotechnical properties
Geotechnical properties for soils can be determined by several different methods. Geotechnical properties are deter-mined either from laboratory tests on samples of represen-tative soils or from in situ tests to avoid the problems asso-ciated with disturbance of soil samples. A third approach is to infer the geotechnical properties by matching expected and observed responses. In this discussion, only the first and third approaches are discussed.
808 (a) 180 silt sand 160 200 days
§
140 セ@ 120 :::::s
<l) 100 セ@"a
r/);:a
80 (:3 u 60'€
<l) :> 40 20 0 -8 -6 -4 -2 0 2 4 6 8distance along pipeline, m
( b ) 160 silt 84/04/26 (193 days) 83/11/15 (29 days)
I
セ@セ@
80 ul r/) (start) セ@ ... r/) (:3 0 1-< ;:I セ@ <l) 4::: <l) 0.. -80 ... 0... -160 セセセセセセセセセセセセセセセセセセセセセセセセセセセ@ -8 -6 -4 -2 0 2 4 6 8distance along pipeline, m
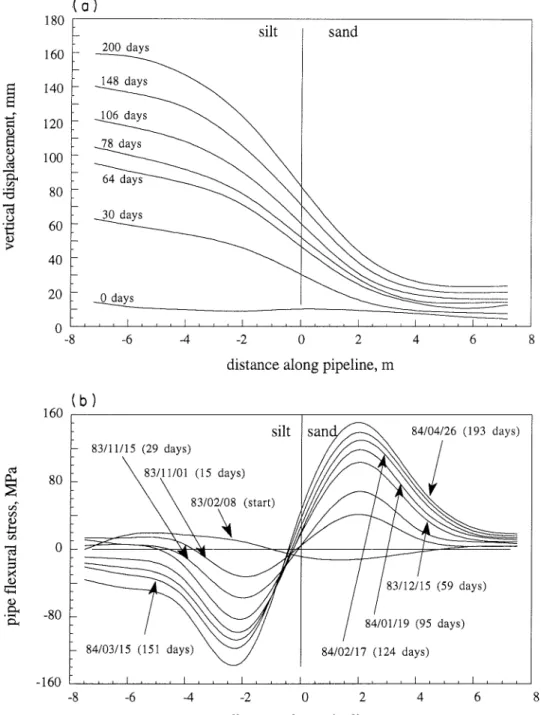
FIG. 3. Vertical displacement profiles (a) and bending stress profiles (b) during the second freeze period for pipeline at Caen, France (after Dallimore and Crawford 1985).
Numerous laboratory tests on frozen SNEC sand and Caen silt were conducted by Ladanyi and his team at Ecole Polytechnique de Montreal, Quebec (Geotechnical Science Laboratories 1986), to determine elastic and creep properties.
A total of 22 constant load and constant displacement rate tests were carried out on laboratory-prepared samples. These samples were tested in a cell with circulating fluid to main-tain a constant temperature. The samples were either sub-jected to constant load or constant displacement rate but with no lateral confinement. The elastic and creep properties for SNEC sand and Caen silt are summarized in Table 1.
Elastic constants
We discussed earlier how the elastic response dictates the creep response of a beam embedded in a viscoelastic medium.
It then becomes very crucial to establish average elastic
constants for frozen soil that predict the time-independent elastic response reliably.
The stress-strain rate data from these 22 tests were fitted by Ladanyi (Geotechnical Science Laboratories 1986) to a Norton-type expression for the flow law of creeping mate-rials proposed by Ladanyi (1972):
[13a]
セL@
[ ; :r
+Eo [ ; :r
or[13b]
e]e・{セイKbitBエ@
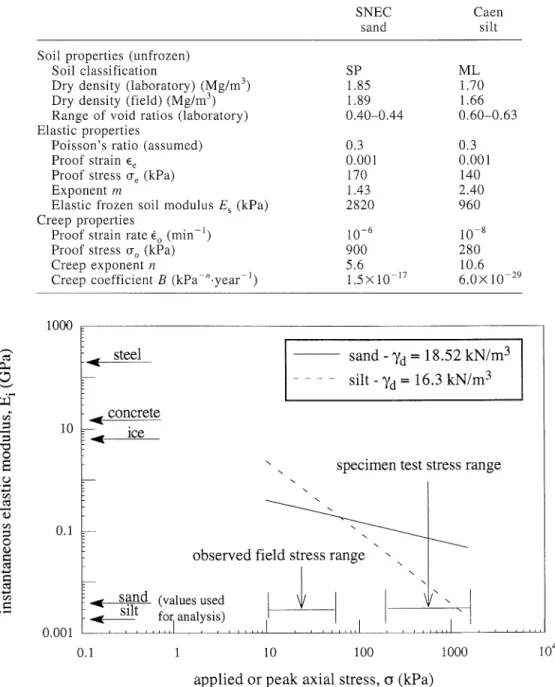
RAJANI AND MORGENSTERN 809 TABLE 1. Geotechnical properties for SNEC sand and Caen silt (Geotechnical
Science Laboratories 1986)
Soil properties (unfrozen) Soil classification
Dry density (laboratory) (Mg/m3)
Dry density (field) (Mg/m3 )
Range of void ratios (laboratory) Elastic properties
Poisson's ratio (assumed) Proof strain Ee
Proof stress tT e (kPa)
Exponent m
Elastic frozen soil modulus £5 (kPa)
Creep properties
Proof strain rate E0 (min
-1 )
Proof stress tT
0 (kPa)
Creep exponent n
Creep coefficient B (kPa-"·year-1 ) 1000 10 0.1 SNEC Caen sand silt SP ML 1.85 1.70 1.89 1.66 0.40-0.44 0.60-0.63 0.3 0.3 0.001 0.001 170 140 1.43 2.40 2820 960 10-6 10-8 900 280 5.6 10.6 1.5X 10⁻¹⁷ 6.0X 10⁻²⁹ sand - 'Yd =
18.52
kN/m3 silt - 'Yd =16.3
kN/m3specimen test stress range
observed field stress range
• sand (values used
セエ@
for analysis)0.1 10
セ@
100 1000
applied or peak axial stress,
a
(kPa)FIG. 4. Instantaneous elastic modulus for frozen sand and silt at Caen from constant load and constant displacement rate tests.
respectively; Ee and E0 are the proof elastic strain and proof
creep strain rates, respectively; and ere and cr0 are proof
stresses. The first term of [13a] and [13b] corresponds to the elastic or instantaneous response, and the second term to the creep response.
Higher dry densities for sand in both laboratory and field samples than for silt are in accordance with the expected higher sand stiffnesses. The fact that stresses induced in the pipeline embedded in sand are higher than those induced in the pipeline embedded in silt supports the fact that sand has a higher elastic modulus than silt. Independent dynamic elastic moduli for a range of frozen sands and silts (Kaplar 1969) confirm that sand can be 30-60% stiffer than silt. The elastic modulus, Es, can also be derived from the first
term in [13aj and [13bj by differentiating it with respect to stress. The resulting expression (not given here) for the
elastic modulus is stress dependent. The variation of elastic modulus with axial stress for sand (0.2-1.5 GPa) and for silt (0.2-0.35 GPa) from the aforementioned expression is shown in Fig. 4. These values were calculated from param-eters given in Table 1 which, in turn, were determined from the uniaxial tests referred to earlier. We note (Fig. 4) that elastic moduli derived for silt in the manner described above can exceed those for sand, which is unlikely for the stress range of interest. It is apparent from Fig. 4 that the range of elastic moduli can be considerable, and it is essential that this range be confirmed from other available evidence before a specific range of elastic moduli can be established for use in analysis. Even though the measured stress in the soil near the pipeline was in the order of 50 kPa, the laboratory inves-tigations were performed within the 200-1300 kPa stress range because of equipment limitations.
810
(a )
I>< 1.2co..
00p
=
0.25 0 1 u セ@p
=
0.33 "7'- Gセ@ Q) 0.8I;\
!-<",.,
\p
=
0.44 0 0.6\'\\\
セ@=
0.6...
u セ@ セ@=
0.8...
0.4 \'\\
=
, ' I \p
=
1
Q)s
0.2 Q)':
·\
セBG@
u \'"'-..
'
C':S '"
-
0.. 0 00...
0
-0.2 -2 0 2 4 6 8 10distance along pipeline, m
0.5 (
b )
I>< 0.4co..
.s
- - -p
=
0.25 - - - - - セ@=
0.33 00 - -セ@ 0.3 "7'-Q).:
セ@=
0.44 - / r 7 ) < - '0
''
p
=
0.6 ',I I \ - - -l /; ' """ ' ' セ@=
0.8 0.2 0...
u セ@ 0.1 00 00 Q)!:J
0 Cl:l-,[/
\ '\
'
"""
'
- - -p
=
1 , I'
-jセ@
\ \セBGMNN@
' ' '"
'--... -. · · . . ---=--
--0.1I
I
I
I -2 0 2 4 6 8 10distance along pipeline, m
FIG. 5. Vertical displacement profiles (a) and stress wave profiles (b) for a semi-infinite beam on elastic foundations as a function of the characteristic length 1
/!3.
As mentioned earlier, Ladanyi and Lemaire (1984) back-analyzed the pipeline response at the end of 167 days dur-ing the first freeze period. The solution is based only on Winkler "beam on elastic foundation" type analysis, and it is a trial and error procedure to estimate the elastic modulus of frozen soil that best matches predicted and observed response at any one point in time. In the method proposed by Ladanyi and Lemaire (1984 ), the time variable does not play a role and the quasi-static analysis needs to be repeated for each time-step. This method enabled the back-calculation of the foundation subgrade modulus for frozen sand and silt. They found that an elastic modulus of 2.8 MPa, which corresponds to their value of ォセ@ of 1.2 MPa and a Poisson's ratio of 0.3, best matched the observed response at the end of 167 days of the first freezing period. This value of the elastic modulus, £5, used by Ladanyi and Lemaire ( 1984)
is orders of magnitude lower than that estimated from lab-oratory tests. The pertinent question then to be posed is why is there such a difference in the elastic modulus? The elastic moduli given by expressions like [13a] and [13b] or those given by dynamic test methods primarily reflect the
compressional mode of displacement rather than the tensile mode that is relevant when the pipeline is subjected to uplift. This highlights the importance of obtaining mechanical properties of creeping media that adequately represent the possible stress paths and strain range of interest.
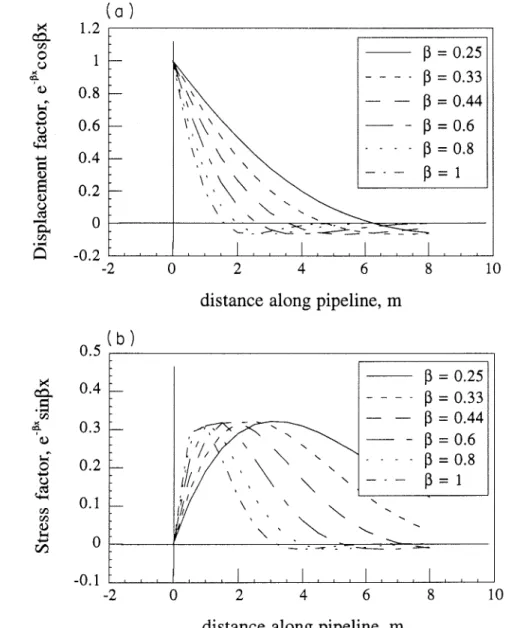
An alternative procedure for estimating the value of the elastic modulus of frozen soil is to compare the expected elas-tic response of the pipeline with the measured response with-out carrying with-out a rigorous time-dependent analysis. One method of doing this is to closely examine the idealized elas-tic linear responses of a pipeline as a function of the charac-teristic length, [3. For the present discussion, it would suffice to consider individually only the portion of pipeline embedded in each soil type, since we have noted that the pipeline deforms with a double curvature. It has previously been shown (Rajani and Morgenstern 1992) that the vettical pipeline displacement and stress profiles for one-half of the pipeline subjected to differential frost heave at a sand-silt intetface can be expressed in terms of the following idealized functions:
RAJANI AND MORGENSTERN 811 (a )
250 セMMMMMMMMMMMMMMMMMMMMMMMMMMMMMMMMMMMMMMMMMML@
heave @ sand-silt interface 200
150
free field heave in sand
(b) 250 200 differential heave @ sand-silt interface
@=@-@
300 400 time, daysfree field heave in silt
500
heave @ sand-silt interface
E
150E
セ@ differential heave @ > セ@@- -
sand-silt interface c<:J 100 セ@⦅Oセ@
セMᆴ@
..c +-' vo 0 <.!:: 50 0 0 100 200 300 400 500 time, daysFIG. 6. Frost heave in sand (a) and silt (b) during first freeze period for pipeline at Caen, France.
[15] CJ=e-13'sin[3x
where 11[3 is the characteristic length defined in [5]. The variation of vertical displacement and stress as a function of the parameter [3 is shown is Fig. 5. The parameter [3L, where L is the length of the beam, can be interpreted as an indicator of how the effect of loading dies out in the form of damped wave along the length of the beam. Hetenyi (1974) has provided ranges of values for [3L that classify the beams into three groups: (i) short beam when [3L < 'IT/4; (ii) beam of medium length when 'lT/4 < [3L < 'IT, and (iii) long beam when [3L > 'IT.
If the predicted displacement and stress profiles are to match observed profiles with the special characteristics noted earlier, it becomes evident by comparing vertical pipe-line displacement and stress profiles in Figs. 2 and 3 with those in Fig. 5, that [3 should have a value close to 0.44/m for the portions of the pipeline embedded in sand and 0.33/m for the portions of the pipeline embedded in silt. Accord-ing to Hetenyi 's (1974) classification, the pipeline behaves as a long beam in frozen sand, whereas it behaves as a beam of medium length in frozen silt. Since the characteristic length reflects the relative elastic stiffnesses of frozen soil
and pipeline, and neither the elastic nor geometric properties of the pipeline vary with soil types, a higher value of [3 can be unequivocally associated with higher soil stiffness and vice versa. Consequently, we can infer that frozen sand is stiffer than frozen silt. For a [3 value of 0.25/m for silt, the stress wave only resembles the observed stress wave form for longer time periods, and it could be suggested that the ini-tial silt stiffness is higher than that of sand, which is not likely. However, there is evidence available against the like-lihood that frozen silt is stiffer than frozen sand. Signifi-cant observed stress at the far end of the pipeline in silt suggests possible restraint, but, as discussed later, this can only account for stresses developed for longer time peri-ods. These discussions lead us to conclude that within the silt zone itself there seems to exist two lateral subzones of silt with different frost-heave characteristics, or that because of the low stiffness of silt, the end effects play a major role in the interaction.
The preceding discussions in relation to the observed dis-placement and stress responses of the pipeline over a period of 10 months illustrate that heterogeneity in the elastic and creep soil properties and uncertainties in the boundary conditions
(a)
250 r - - - , heave @ sand-silt interface 200 differential heave @ sand-silt interface 150 100 50
®=®-©
セ@ セM
-:-_ -:_ -:_ - - - -@
0 セセセセj⦅セセMセMlセセセセセセセセセセセセセ@ 0 100 200 300 400 500 time, days RUPHセ「⦅I@ ________________________________ - , free field heave in silt\
PセセMセMMMMMMMMMMM
セ@ セ@ セ@ セ@ heave @ sand-silt interface
200
150
/
100
50
----r---
©=®-@
differential heave @ sand-silt interface0 セセセセセセセセセセセセセセセセセセセセセ@
0 100 200 300 400 500
0
time, days
Fro. 7. Frost heave in sand (a) and silt (b) during second freeze period for pipeline at Caen, France.
can influence the local response of the pipeline. Therefore, a discrete model, like that of a beam on the Winkler spring-type model, should only be expected to predict the overall response, which would be of interest in feasibility and pre-liminary design stages of a pipeline project.
Consequently, the establishment of the best estimates of the parameter [3 ([3
=
0.44/m for SNEC sand and [3=
0.33/m for Caen silt) permits the calculation of the equivalent elas-tic properties for frozen sand and silt from [3] and [5]. The corresponding elastic modulus is 2820 kPa for SNEC sand and 960 kPa for Caen silt. We note that Ladanyi and Lemaire (1984) used an elastic modulus of 2820 kPa independent of the soil type. The estimation of an elastic modulus using this procedure will only be possible in situations where the measured response of a pipeline is available. Where neither data from a pipeline test facility nor geomechanical data are available, sensitivity response analyses have to be per-formed on the best estimates from available published geo-mechanical data on frozen soils.Creep constants
The rate of increase of flexural stresses in the pipeline is influenced by the value of the creep exponent, n. A large
value of n necessarily means that the creep rate will be faster, and hence the flexural stresses in the pipeline will be much higher than those expected for a smaller value of the creep exponent during the same amount of elapsed time. As n gets larger than 3, the response does not differ signif-icantly, as shown by approximate methods developed by Rajani and Morgenstern (1992).
The second term in [ 13b] is the same as the one stated in [6]. The constant B involves the proof strain rate, proof stress, and the creep exponent n. The creep exponents n = 5.6 for sand and n = 10.6 for silt are high when compared with other measured data. Since there are limited creep data on frozen soils, it is appropriate to compare these values to other published data.
Nixon and McRoberts (1976) suggested that the creep exponent, n, for polycrystalline ice could be related to the temperature by an empirically obtained power relation. In subsequent studies based on creep tests on undisturbed sam-ple of ice-rich silt, McRoberts et al. (1978) found that frozen silt at low stresses creeps at reduced rates in comparison with ice. The particular relation suggested by McRoberts et al. (1978) for ice-rich silt samples from Norman Wells, Northwest Territories, is
RAJANI AND MORGENSTERN 813 (a ) 180 .---. silt sand 160
§
140 120 ____ 252days....
RRセZCケウ@-.- ._
....
QYセN」AセセウZ@: · · · · :: :- ..
-- ..
ャYWNTセセウN@. -... : .. ''
100 80 .... QSセ⦅T。ャウ@ ___ _ ' '.
' " -.--YNXNセyNセ@ ... ·--. ·--. ·--. ·--. WdN\Tクセ@ _______ _ -- .. __NTセyNセM ... -- ... - ..·
.. ·: :::: ! ! •:
::
:
:
:
:
セ@ セ@
: : : : : : : : : : : : : : : : :: : : 60 40 20 0 セセセMlセセセセセセMlセセセセセセMlセセセBセセセセセセセ@ -8 -6 -4 -2 0 2 4 6 8distance along pipeline, m
(b) 160 . - - - . - - - , silt sand , . 140 days
167\
/···· ;;
;>, ... ,, ..
80 255 daysdistance along pipeline, m
FIG. 8. Predicted vertical displacement profiles (a) and stress wave profiles (b) during first freeze period (fixed - free condi-tions) for pipeline at Caen, France.
[16] E . = - - - , -1.6xi0-7a3
+ ----..,---
1.5xiQ-I4a6(1 - T) 18 (1 - T) 18
where strain rate E. is expressed in 1/year, temperature T is in °C, and stress a is in kPa. An ice-rich frozen soil is that soil which has significantly greater excess water content than the same soil in an unfrozen consolidated state. How-ever, a review by Weaver (1979) concludes that sufficient data do not exist to indicate that the creep exponent varies sig-nificantly from 3. The creep coefficient, B, has been found (Morgenstern et a!. 1980) to vary significantly with tem-perature for both ice and ice-rich silt. The laboratory tests on Caen soil samples were carried out at one specific temper-ature, even though the surrounding soil underwent a range of temperatures as chilled air passed through the pipeline.
Although SNEC frozen sand probably remained ice poor, the comparison of Caen frozen silt creep data to published data on similar soils is more meaningful. The pipeline analy-ses discussed in this paper were performed using the creep exponent (n) values as reported by the Geotechnical Science Laboratories (1986) and given in Table 1, despite the fact that the creep exponent values were found to be high in com-parison with most other published data.
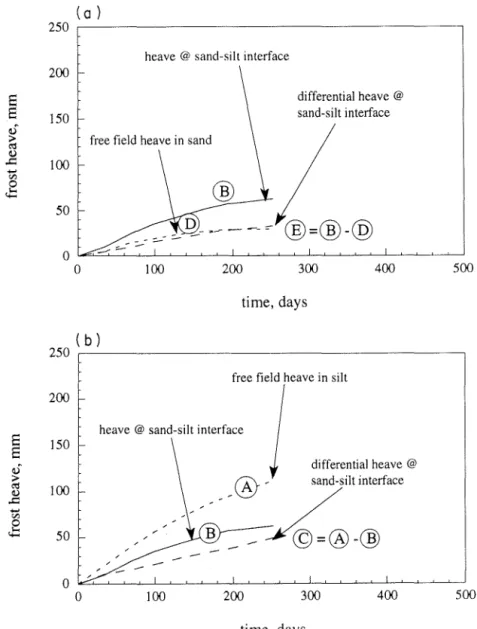
Frost heave
As expected, the Caen silt heaves considerably more than SNEC sand, and the free-field heave is attenuated at the sand-silt interface because of the restraining effects of the much stiffer sand and also because sand is not as frost sus-ceptible as silt. The amount of frost heave is considerably
814 (a ) 180 200 days 160 . ---silt sand __ Nhセaセケウ@
§
140 __ _JQ6 days . ·-- .. ....r 120=
__ N_セ⦅、。ケウ@セ@
i!.) 100 セ@ 64 days-
0< t/) 80 セ@.
' ' ' ' ' セ@__ .
セYM Tセセウ@ ... .. .. .. .. '' ' ' u 60 .. ' ' ' ''€
i!.).
, ' ' .. .. ' ' > 40 20 ...
' .. . .. '.
. ' '..
'-: .':·>><· .-_.-
MセZセセZZNᄋZZセZZᄋZZZZ@ - : : : : : : : : : : : : : : : : : : セ@= : セ@ 0 -8 -6 -4 -2 0 2 4 6 8distance along pipeline, m
(b) silt 160 80 0
r--:j
r-j
セMセ@
(
セ@ セ@ セ@セ@
: : : : : : : : : : : : : :: : : : : :
_:j
-80 f- ..セ@
:.:: : : : ••... - - - ,<'!"
:..; :- :- . 95
days . ·.-.:/·.::---:-;;
124 days · .. :..: :_:>·
-1W セセセセセセセセセセセセセセセセセセセMセセセセセセセセMセセセセ@ -8 セ@ -4 セ@ 0 2 4 6 8distance along pipeline, m
Fro. 9. Predicted vertical displacement profiles (a) and stress wave profiles (b) during second freeze period (fixed- free conditions) for pipeline at Caen, France.
larger during the second freeze period than that observed during the first freeze period (Figs. 6 and 7). The amount and mode of attenuation are closely related to the geometry and mechanical properties of the two adjacent media, as illustrated by Nixon et al. (1983). In the present study, we do not attempt to identify the mechanism of attenuation, although it has received limited previous attention.
Instead, we propose to use prescribed displacements cor-responding to the observed differential frost heave rate on the pipeline at the sand-silt interface. The free-field frost heave rate used for silt was that determined by Nixon (1985), whereas that for sand was estimated from the observed ver-tical displacement of the pipeline at the far end, since little soil-pipeline interaction is expected there. The differential
vertical displacements required to be prescribed at the sand-silt interface for numerical analysis were approximated by subtracting free-field heave in sand and in silt from the heave at the sand-silt interface. Essentially, this procedure extracts the rigid-body mode of movement, which does not contribute to the development of any stresses in the pipeline. We also assume that the frost-measured heave rate is not significantly influenced by the differential movement of the pipeline. The estimated prescribed differential frost heave rates calculated using this simple procedure as shown in Figs. 6 and 7. Prescribed differential frost heave at the sand-silt interface for the pipeline embedded in each type of soil will be different because free-field frost heave is not the same for sand and silt.
RAJANI AND MORGENSTERN 815 Comparison of vertical displacement and stress history
The simulation of the pipeline was carried out individually for each portion of the pipeline embedded in sand and in silt using the corresponding properties for each soil type. The pipeline was discretized into beam finite elements and the surrounding medium was represented by Winkler springs with creeping material characterization shown in Table 1.
At the Caen experimental facility, the advance of the frozen front took place by maintaining the temperature of the pipeline at -2°C during the first freeze period and
soc
during the second freeze period. As expected, the frost-bulb penetration was greater during the second freeze period than during the first freeze period. Frost front advance data indi-cate that the steady-state conditions were observed after about 100 days. During the transient phase when the frozen bulb around the pipe is developing, the soil characteristics are continually changing while many complex processes are simultaneously taking place within the soil. One such impor-tant process is the migration of moisture associated with frost heave. Shen and Ladanyi ( 1987) have analyzed this aspect of the problem in two dimensions and they found that the hoop stress induced as a result is in the order of 1.5 MPa, which is relatively insignificant in comparison with the flexural stresses. In the present analysis, we assume that the frost-bulb advance took place instantaneously and that the soil properties given in Table 1 adequately represent the situation for the first freeze period at the end of the tran-sient response. A more realistic approach would be to rep-resent material properties for each specific temperature. Furthermore, the laboratory testing of samples was carried out at -2°C and, consequently, the use of the same values for the second freeze period introduces additional uncer-tainty in the predicted response. Besides the different oper-ating temperature conditions of the pipeline at-soc
dur-ing the second freeze period, the freezdur-ing and thawdur-ing and subsequent refreezing of surrounding sand and silt sub-stantially changes the soil structure and, hence, the creep properties. Therefore, the simulation corresponding to the second freeze period involves considerable simplifications and our goal was to account for 90-95% of the stresses that can arise as a result of differential frost heave using a relatively simple method of analysis. So that no additional complexi-ties are introduced into the analysis for the second freeze period, we neglected the fact that the pipeline was deformed and had minor locked-in stresses after the thaw of the first freeze cycle.The simulation of the pipeline portion embedded in sand during the first freeze period was a straightforward procedure. The final vertical displacement profile was obtained by adding the free-field frost heave as shown in Fig. 8a. Sim-ilarly, the stress-wave histories are shown in Fig. 8b. The analysis for the second freeze period (Fig. 9) resulted in lower predicted stresses than those measured for the initial time intervals, but the stresses were overestimated for the higher time intervals. Since insufficient laboratory or field data exist on geomechanical properties, we believe that at present no extra effort is warranted for a better match of field history.
It was expected that the simulation of vertical displacement stress-wave histories for the portion of pipeline embedded in silt would be much more challenging because of the observed behavioural characteristics. A first attempt was made along the same lines as that for sand, except that the elastic modulus
was reduced by 70%, i.e., Es
=
960 kPa. Although significant end rotation was obtained, it was still significantly less than that observed, and the stress wave was essentially half sinu-soidal, i.e., with zero end stresses. In an attempt to attract more stress towards the free end, total rotational restraint was imposed at the far end. Although this boundary condi-tion attracted significant stress toward the far end, the rota-tional restraint is contrary to the observed end rotation. On the other hand, a significant increase in the peak stress was observed and the stress wave did not have the observed shape when the measured prescribed end rotation was imposed.The simulations were carried out with the intention of matching magnitudes of observed stresses with predicted stresses. The predicted vertical displacement profile of the pipeline matched the measured displacement profile for the portion of pipeline embedded in sand, but the predicted dis-placements were higher at the far end than those measured for the portion of pipeline embedded in silt.
Conclusions
The behavioural characteristics of a pipeline at Caen sub-jected to frost heave have been critically reviewed. Possible anomalies in the responses of the field tests have been iden-tified and discussed with possible consequences in the deter-mination of reliable predictions. Displacement and stress histories have been simulated using a model based on a Winkler model where the discrete springs are characterized by a material model following the Norton's flow law.
Unexpected behaviour for the portion of the pipeline embedded in silt is identified and several explanations are offered for this behaviour. A simple Winkler model based on finite elements is then used to simulate the response of the pipeline subjected to frost heave. Although a good match is obtained between predicted vertical displacement and stress-wave histories for the portion of pipeline in sand, the simulations fail to trace all the particularities of the response of the pipeline in silt. An attempt has been made to explain the differences. Nonetheless, the analysis of the pipeline at Caen illustrates that it is essential to include the creep behav-iour of frozen soils to predict the development of stresses and strains with time. The need for an analytical procedure to quantify the attenuation of the free-field frost heave has been identified to serve as a useful input for the analysis of a pipeline subjected to frost heave.
The Winkler model for a beam embedded in a creeping medium has been shown to be sufficiently robust to ade-quately analyze pipelines subjected to imposed frost heave movement. The finite element discretization procedure also permits the analysis of a pile embedded in a layered medium.
Acknowledgments
We gratefully acknowledge the financial support provided through grants by the Natural Sciences and Engineering Research Council of Canada and Esso Resources Canada Ltd. for carrying our studies on the problem of frozen soil -pipeline interaction. The first author also wishes to thank Foothills Pipe Lines Ltd. for a studentship awarded through the Association of Canadian Universities for Northern Studies (ACUNS).
Adina R&D, Inc. 1987. A finite element program for automatic dynamic incremental nonlinear analysis. Report ARD 87-1, ADINA R&D. Inc., Boston.
Bathe, K.J. 1982. Finite element procedures in engineering analy-sis. Prentice-Hall Inc., Englewood Cliffs, N.J.
Biot, M.A. 1937. Bending of an infinite beam on an elastic foun-dation. Transactions, ASCE Journal of Applied Mechanics,
59: Al-A7.
Dallimore, S.R., and Crawford, H. 1985. Experimental obser-vations of differential heaving and thaw settlement around a chilled pipeline. In Pipelines and Frost Heave, Proceedings of a Seminar Held at Centre de Geomorphologie, Caen, France April, 1984. Edited by S.R. Dallimore and P.J. Williams. Geo-technical Science Laboratories, Carleton University, Ottawa. pp.5-17.
Geotechnical Science Laboratories. 1986. Investigations of frost heave as a cause of pipeline deformation. Report IR-50, Geo-technical Science Laboratories, Carleton University, Ottawa. Geotechnical Science Laboratories. 1988. The third freeze cycle of the Canada-France ground freezing experiment. Report IR-54, Geotechnical Science Laboratories, Carleton University, Ottawa.
Geotechnical Science Laboratories. 1989. Canada-France pipeline-ground freezing experiment. Report IR-58, Geotechnical Science Laboratories, Carleton University, Ottawa.
Hetenyi, M. 1974. Beams on elastic foundation. University of Michigan Press, Ann Arbor.
Kaplar, C.W. 1969. Laboratory determination of dynamic moduli of frozen soils and ice. Technical Report 163, U.S. Army Cold Regions Research and Engineering Laboratory, Hanover, N.H. Ladanyi, B. 1972. An engineering theory of creep of frozen
soils. Canadian Geotechnical Journal, 9: 63-80.
Ladanyi, B., and Lemaire, G. 1984. Behaviour of a buried pipeline under differential frost heave conditions. In Proceedings of Cold Regions Engineering Specialty Conference, April 4-6, Edmonton. Edited by D.W. Smith. Canadian Society for Civil Engineers, Montreal, pp. 161-176.
McRoberts, E.C., Law, T.C., and Murray, T.K. 1978. Creep tests on undisturbed ice-rich silt. In Proceedings of the 3rd Interna-tional Conference on Pe1mafrost, July 10-13, Edmonton. NaInterna-tional Research Council of Canada. Vol. 1. pp. 539-545.
Morgenstem, N.R., Roggensack, W.D., and Weaver, J.S. 1980. The behaviour of friction piles in ice and ice-rich soils. Canadian Geotechnical Journal, 17: 405-415.
Nixon, J.F. 1978. First Canadian Geotechnical Colloquium: Foun-dation design approaches in permafrost areas. Canadian Geo-technical Journal, 15:96-112.
Nixon, J.F. 1984. Laterally loaded piles in permafrost. Canadian Geotechnical Journal, 21: 431-438.
Nixon, J.F. 1985. A method for predicting frost heave of buried chilled pipelines. In Pipelines and Frost Heave, Proceedings of a Seminar Held at Centre de Geomorphologie, Caen, France, April 1984. Edited by S.R. Dallimore and P.J. Williams. Geo-technical Science Laboratories, Carleton University, Ottawa. pp. 55-59.
Nixon, J.F., and McRobeJts, E.D. 1976. A design approach for pile foundations in permafrost. Canadian Geotechnical Journal,
13: 40-57.
Nixon, J.F., Morgenstern, N.R., and Ressor, S.N. 1983. Frost heave - pipeline interaction using continuum mechanics. Canadian Geotechnical Journal, 20: 251-261.
Poulos, H.G., and Davis, E.H. 1980. Pile foundation analysis and design. John Wiley & Sons, Inc., New York.
Rajani, B., and Morgenstern, N. 1992. Behaviour of a semi-infinite beam in a creeping medium. Canadian Geotechnical Journal, 29: 779-788.
Rajani, B., and Morgenstern, N. 1993. Uplift of model steel pipelines embedded in polycrystalline ice. Canadian Geo-technical Journal, 30: 441-454.
Scott, R.F. 1981. Foundation analysis. Prentice-Hall Inc., Englewood Cliffs, N.J.
Shen, M., and Ladanyi, B. 1987. Modelling of coupled heat, moisture and stress field in freezing soil. Cold Regions Science and Technology, 14: 237-246.
Vesic, A.S. 1961. Bending of beams resting on isotropic elastic solid. ASCE Journal of the Engineering Mechanics Division, 87(EM2): 35-51.
Weaver, J.S. 1979. Pile foundations in permafrost. Ph.D. thesis, The University of Alberta, Edmonton.
A spring b B B' e E Es £spring I Ir ォセ@ L m q s n p T w X
z
!3
!3c
E Ee E. Eo 'Yd vs (J' (TO' (T e List of symbolscross-sectional area for discretized foundation spring
beam width, pipeline
creep proportionality constant
creep foundation compliance for plane strain height of load application above ground level beam (pipeline) elastic modulus
soil elastic modulus
elastic modulus for discretized foundation spring beam moment of inertia
creep influence factor foundation subgrade modulus spring length
elastic exponent for instantaneous response reaction per unit length on the loaded beam of width b
Winkler spring spacing
creep exponents in Norton relation intensity of pressure on the loaded area temperature (in °C)
time
elastic displacement
creep displacement and displacement rates, respectively
transverse displacement in the
z
direction longitudinal coordinate axisaxis normal to x axis
1/(elastic characteristic length) 1/(creep characteristic length) strain
elastic proof strain strain rate
proof strain rate soil weight density soil Poisson's ratio