READ THESE TERMS AND CONDITIONS CAREFULLY BEFORE USING THIS WEBSITE.
https://nrc-publications.canada.ca/eng/copyright
Vous avez des questions? Nous pouvons vous aider. Pour communiquer directement avec un auteur, consultez la
première page de la revue dans laquelle son article a été publié afin de trouver ses coordonnées. Si vous n’arrivez pas à les repérer, communiquez avec nous à [email protected].
Questions? Contact the NRC Publications Archive team at
[email protected]. If you wish to email the authors directly, please see the first page of the publication for their contact information.
NRC Publications Archive
Archives des publications du CNRC
This publication could be one of several versions: author’s original, accepted manuscript or the publisher’s version. / La version de cette publication peut être l’une des suivantes : la version prépublication de l’auteur, la version acceptée du manuscrit ou la version de l’éditeur.
Access and use of this website and the material on it are subject to the Terms and Conditions set forth at Low-frequency impact sound transmission through floor systems
Warnock, A. C. C.
https://publications-cnrc.canada.ca/fra/droits
L’accès à ce site Web et l’utilisation de son contenu sont assujettis aux conditions présentées dans le site LISEZ CES CONDITIONS ATTENTIVEMENT AVANT D’UTILISER CE SITE WEB.
NRC Publications Record / Notice d'Archives des publications de CNRC:
https://nrc-publications.canada.ca/eng/view/object/?id=a9ee138c-e7fd-4b2f-bf0f-ccc564be0d1f https://publications-cnrc.canada.ca/fra/voir/objet/?id=a9ee138c-e7fd-4b2f-bf0f-ccc564be0d1f
A.C.C. Warnock
Institute for Research in Construction, National Research Council, Canada
ABSTRACT
About 190 floors with different types of joist, sub-floors, ceiling types, ceiling support systems and type and thickness of sound absorber were constructed in the IRC Acoustics Laboratory during a project lasting about 3 years. The joist types comprised solid wood, wood trusses, I-joists, and steel joists. Glass, rock and cellulose fiber were used in the cavities. Impact sound transmission was measured at frequencies down to 25 Hz using four impact devices and a walker. The paper summarizes the results obtained and discusses possibilities for a revised tapping machine test and rating system
RÉSUMÉ
Environ 190 planchers ont été construits dans le Laboratoire d’acoustique de l’IRC dans le cadre d’un projet d’une durée approximative de 3 ans : planchers comportant différents types de solives ou poutrelles, de supports de revêtement de sol, de sous-faces, de systèmes de soutien de la sous-face, ainsi que différents types et épaisseurs d’absorbant acoustique. On a utilisé des solives en bois massif, des fermes de bois, des solives en I et des poutrelles d’acier. Les vides de plancher ont été remplis à l’aide de fibre de verre, de roche ou de cellulose. La transmission des bruits de chocs a été mesurée à des fréquences de plus en plus basses – jusqu’à 25 Hz – au moyen de quatre dispositifs d’impact et d’une personne qui marchait. Ce document fait état des résultats obtenus et traite de la possibilité de modifier la machine à chocs et le système de classement.
INTRODUCTION
The IRC Acoustics Laboratory at NRC recently completed the measurement phase of a study of airborne and impact sound transmission through floor constructions typical of those
used in Canadian housing. A summary report1 provides the single number ratings sound
transmission class (STC) and impact insulation class (IIC). More detailed reports2,3 give 1/3
octave band data. For each floor constructed, measurements of impact sound transmission were made using two experimental ball impactors, the JIS tapping machine, the standard ISO tapping machine, and a walker. The aim was to investigate possible new methods of testing and rating impact sound transmission through floors – methods that would better deal with low frequency sound. This paper compares average results from these impactors and discusses
NRCC-44211
2
floating slabs of some kind. Only two floors had carpets. Thus the data predominantly relate to lightweight joist floors which are commonly used in North America.
IMPACT DEVICES AND MEASUREMENT PROCEDURES
Transmission of impact sound from the ISO tapping machine through floors was
measured in accordance with ASTM E4926 and the impact insulation class (IIC) calculated
according to ASTM E9897. Note that the 8 dB limitation in E989 means that the ISO Ln,w
rating8 is not always 110-IIC but is nearly so.
For other impactors, where low frequency sound is the major concern, only a single microphone was used. The microphone was placed 1 m below the mid-point of the ceiling and the room below was made less reverberant by placing sound absorbing material in it until the reverberation time was about 0.5 seconds. This technique is used consistently in this laboratory for measuring walker, ball and tire levels. It is hoped that in some way the difficulties associated with obtaining average room levels at very low frequencies will be avoided.
The Japanese measurement standard JIS 14189, specifies an automobile tire mounted on
an arm as the impact device. Many drop positions for the tire and several microphone positions are required, but in this work only five positions were used.
The balls used in these measurements were developed by H. Tachibana10 as part of his
research and kindly provided for use at NRC. Both balls are 180 mm in diameter and weigh
2.5 kg. The first ball (BALL1) is less resilient than the second (BALL2). Both are dropped
from a height of 900 mm at 15 random positions in the middle of the floor.
Two members of the section have been designated as standard walkers, one is the primary walker, the second a backup. Both are male, weigh about 90 kg and generate about the same sound pressure levels when they walk on a floor. The shoes worn are normal leather-soled shoes with rubber-tipped leather heels. The walker walks for about 3 minutes while the computer collects maximum sound levels for 100 footsteps using a 35 ms time constant.
COMPARISONS AMONG IMPACTORS
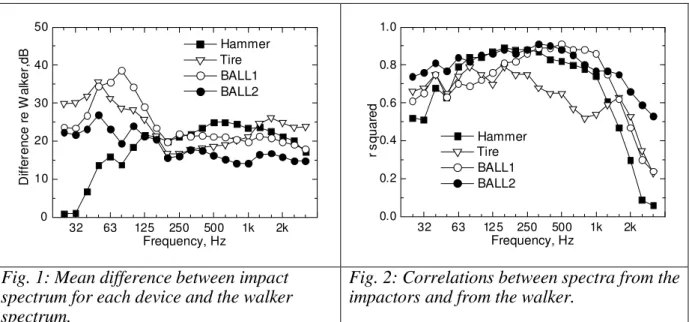
Ideally, a mechanical impactor would generate the same force spectrum as an average walker but at a higher level to raise acoustical signals well above background levels. To do this a mechanical impactor would need to have the same internal impedance as a walker, at least over the frequency range of interest in building acoustics. Also, the increased force should not be so great as to drive floor coverings into non-linear behaviour. To see how close the devices used in this study come to this ideal, Fig. 1 shows the average difference between the impact sound pressure levels for each device and the levels for the walker for all floor
types. An ideal device would show a horizontal line on this chart. BALL2 comes closest to the
ideal, BALL1 and the Tire machine generate too much low frequency sound, and the ISO
tapping machine too little. One point to note is that all of the devices generate more sound than the walker.
32 63 125 250 500 1k 2k 0 10 20 30 40 50 Hammer Tire BALL1 BALL2 D if fe ren ce r e W a lk er ,d B Frequency, Hz 32 63 12 5 250 500 1k 2k 0.0 0.2 0.4 0.6 0.8 1.0 Hammer Tire BALL1 BALL2 r s q uar e d Frequency, Hz Fig. 1: Mean difference between impact
spectrum for each device and the walker spectrum.
Fig. 2: Correlations between spectra from the impactors and from the walker.
If the shape of the difference spectrum is not ideal, it is sufficient that there be good correlation between the sound pressure levels from the mechanical impactor and those from the walker. If this is so, the levels for the mechanical impactor can be adjusted to give a spectrum more like a walker. The squares of the coefficients for correlation of the impact sound pressure levels from the mechanical impactors and the walker are shown in Fig. 2. Except at low frequencies, the tire machine levels do not correlate well with the walker levels.
BALL1 does not correlate quite as well as BALL2 and the ISO hammer at frequencies below
about 315 Hz. From 25 Hz to 1 kHz, BALL2 gives the highest correlation overall, but at and
above 63 Hz, the ISO machine is almost as good. This graph indicates that from about 50 to
500 Hz, BALL2 and the ISO tapping machine should be roughly equally effective as
mechanical simulators of walkers. (At least for the walker and shoes in this study.)
Influence of different floor types
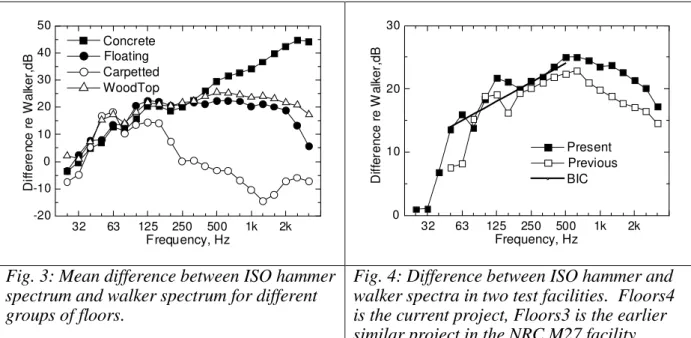
To examine the influence of the floor surface on the ISO Hammer-Walker differences, the data were separated according to the type of floor surface and are plotted in Fig. 3. Because of the hardness of exposed concrete, the difference curve for floors with such surfaces is much greater at frequencies above about 500 Hz than the curves for floors where the exposed surface is wood. The two carpeted floors give a quite different curve. Although only two test results were available to calculate this difference curve, the shape is similar to
curves seen in the earlier study5. The graph shows that for frequencies up to about 500 Hz, the
type of floor surface does not change the difference curve by much, except for carpeted floors. Thus, the ISO tapping machine can be used effectively as a testing device up to at least 500 Hz for all types of surface except carpet. Even with carpeted floors, the difference curve is fairly close to the others below 200 Hz.
NRCC-44211 4 32 63 125 250 500 1k 2k -20 -10 0 10 20 30 40 50 Concrete Floating Carpetted WoodTop D if fer e n ce r e W a lke r, d B Frequency, Hz 32 63 125 250 500 1k 2k 0 10 20 30 Present Previous BIC D if fe ren ce r e W a lk er ,d B Frequency, Hz Fig. 3: Mean difference between ISO hammer
spectrum and walker spectrum for different groups of floors.
Fig. 4: Difference between ISO hammer and walker spectra in two test facilities. Floors4 is the current project, Floors3 is the earlier similar project in the NRC M27 facility.
The earlier project5 carried out in the M27 floor test facility gave similar results but in
that case only the JIS tire machine, the ISO tapping machine and the walker were used. The average difference in level between the ISO machine and the walker for each project is shown in Fig. 4. The data used to calculate the average spectrum shown from the earlier project did not include carpeted floors. Also shown in this figure is the reference contour proposed by
Bodlund11 displaced to ease comparison with the two difference curves. It is interesting to see
how well it fits. The Bodlund contour may be used to weight the levels from the hammer tests. Thus values at 50 Hz are increased by 11 dB, those at 63 Hz by 10 and so on. This has the effect of making the spectrum of the difference between the walker and the weighted hammer results nearly horizontal, at least in the range 50 to 500 Hz. This weighting approach was used to calculate single number ratings as described later.
Some of the differences between the two projects might be due to differences in the two test facilities; receiving room volumes and floor sizes are quite different. Some differences might be attributed to the walker. While the same walkers wearing the same shoes were used, the greater floor size in the M59 facility made walking much easier there. The pattern on the floor was more often a “figure-of-eight” whereas on the smaller M27 floor the walking pattern was more often circular with the walker constantly turning. Whatever the reasons, the differences are greatest below 80 Hz and above about 630 Hz.
POTENTIAL FOR NEW TEST PROCEDURE
Two types of rating systems for sound insulation are in common use; those using rating curves and those using a weighted sum of the energies over a specified frequency range. Ultimately, ratings should be determined by subjective reactions and the acoustical characteristics of intruding impact sounds, but no such comprehensive study has been done. In the absence of information, possible ratings for the impact devices may be compared with ratings calculated for the walker. Three simple ratings can be calculated for the walker: A-weighted levels, loudness and an unA-weighted energy sum or flat level. These ratings can then be correlated with the same and other ratings for the impact devices. For the ISO tapping machine, in addition to the IIC defined in ASTM E989, three additional ratings were calculated.
ISO — This is the energy sum of the levels from the ISO hammer machine from 50 to 2500 Hz minus 15 dB. Over the years, different rating systems have been proposed for
the ISO tapping machine. The latest is embodied in Annex A of ISO 7178 where an
adaptation term CI is introduced. This term is defined as
CI = Ln,sum – 15 – Ln,w dB (1)
where Ln,sum is the energy sum of the impact sound pressure levels. Annex A suggests
that building code regulations might use the sum of CI and Ln,w as a single number
rating. If this is done, then the rating is simply Ln,sum - 15. The frequency range for
calculation of CI is specified as 100 to 2500 Hz for 1/3 octave bands. In a note, the use
of an extended frequency range, down to 50 Hz, is suggested and that is what was used here.
ISO500 — The same as the ISO rating but for the frequency range 50 to 500 Hz.
BIC — Bodlund Isolation Class. Measured data for the ISO hammer were fitted to the
contour proposed by Bodlund11 in the range 50 to 500 Hz using a similar procedure to
that in ISO 717 and a single number rating obtained. The Bodlund contour was also used to weight the hammer levels as described above before calculating overall A-weighted and loudness.
Although A-weighted ratings were calculated, they may not be very useful since low frequency levels are attenuated by the weighting process, however, since they are in common use, they are included here. Work is needed to establish whether people simply react to the loudness of intruding sound or whether the process is a more complicated one involving the detectability of signals in noise.
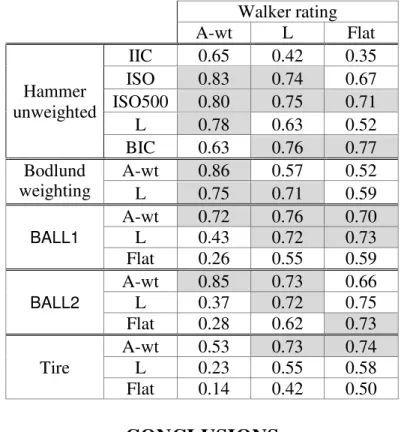
The squares of the correlation coefficient for regression among the ratings is given in Table 1. Part of the variance in this data set arises because the repeatability for the walking test is not that small. The standard deviation of the A-weighted levels for six walker measurements repeated over a number of days on the same floor was 1.3 dB. Inspection of scatterplots suggests that there are outliers in the data set. These have yet to be examined to determine the reason for them.
The data in the Table 1 show several things. IIC and thus Ln,w do not correlate very well
with any of the simple walker ratings. The ISO and BIC ratings correlate well with walker loudness. Any weighing process that tends to make the impact spectra have the same shape gives good correlation, thus loudness and the ISO ratings for the hammer data correlate well with walker A-weighted levels.
The ISO rating offers the advantage of simplicity and convenience, since it already appears in ISO 717. With an appropriate filter, field measurements would become quick and simple. These reasons are probably enough to make the ISO rating the choice for a new standard rating system.
The floors tested included some very poor constructions that gave high levels when struck with the ISO hammer or walked on. Most of the data and the scatter occurs for walker
levels less than about 55 dBA. This corresponds to an IIC of around 45 and an Ln,w of about
65. Most floors submitted for testing and used in buildings are likely to have IIC values greater than 45 so it seemed that it would be useful to focus on those floors where the walker A-weighted level was less than 55 dBA.
NRCC-44211
6
Table 1: Square of correlation coefficients, r, for regression among
ratings. Values of r2 greater than 0.7 are shaded for emphasis. L
denotes the loudness calculated from 25 to 2500 Hz. Flat denotes the total sound pressure level for the same frequency range.
Walker rating A-wt L Flat IIC 0.65 0.42 0.35 ISO 0.83 0.74 0.67 ISO500 0.80 0.75 0.71 L 0.78 0.63 0.52 Hammer unweighted BIC 0.63 0.76 0.77 A-wt 0.86 0.57 0.52 Bodlund weighting L 0.75 0.71 0.59 A-wt 0.72 0.76 0.70 L 0.43 0.72 0.73 BALL1 Flat 0.26 0.55 0.59 A-wt 0.85 0.73 0.66 L 0.37 0.72 0.75 BALL2 Flat 0.28 0.62 0.73 A-wt 0.53 0.73 0.74 L 0.23 0.55 0.58 Tire Flat 0.14 0.42 0.50
CONCLUSIONS
The major conclusion drawn from this work is largely the same as that found in the
earlier project5, namely, there seems to be no need to abandon the use of the ISO tapping
machine. The two experimental balls give good agreement with walker levels (with BALL2
being clearly superior). They do offer simplicity of operation, zero maintenance and
portability and ought to be significantly cheaper than a tapping machine. BALL2 would appear
to be a good choice as an impact device if it were not for the long history of the ISO tapping machine. One might also note that a resilient ball will not emulate a walker wearing hard-heeled shoes or other impacts on a hard floor surface.
It is possible that much existing tapping machine data can be re-processed to give a
different single number rating that will be more useful than either IIC or Ln,w. Thus the
convenient choice is to stay with the ISO tapping machine but to modify the test procedure so levels are measured to 50 Hz and to use a better single number rating.
Similar work needs to be done in other laboratories to compare with the findings described here.
ACKNOWLEDGEMENT
The author is grateful for the financial support of the partners in this project: Boise Cascade, Canada Mortgage and Housing Corporation, Canadian Home Builder Association, Canadian Portland Cement Association, Canadian Sheet Steel Building Institute, Canadian Wood Council, Cellulose Insulation Manufacturers Association of Canada, Forintek Canada Corporation,, Gypsum Association, Gypsum Manufacturers of Canada, Louisiana-Pacific Incorporated, Nascor Inc., Ontario Home Warranty Program, Ontario Ministry of Housing, Owens Corning Fiberglas Canada Inc., Roxul Inc., TrusJoist MacMillan, Willamette Industries.
REFERENCES.
[1] Warnock, A.C.C. and Birta, J.A. “Summary Report For Consortium On Fire Resistance And Sound Insulation Of Floors: Sound Transmission Class And Impact Insulation Class Results”, Internal Report IRC-IR-766, Institute for Research in Construction (IRC), National Research Council Canada (NRCC), Ottawa, K1A 0R6.
[2] Warnock, A.C.C. “Detailed Report for Consortium on Fire Resistance and Sound Insulation of Floors: Sound Transmission and Impact Insulation Data in 1/3 Octave Bands.” Internal Report IRC-IR-nnn, IRC, NRCC, Ottawa, K1A 0R6. (To be published in 2000)
[3] Warnock, A.C.C. “Detailed Report for Consortium on Fire Resistance and Sound Insulation of Floors: Impact Insulation Measurements using experimental impact devices.” Internal Report IRC-IR-nnn, IRC, NRCC, Ottawa, K1A 0R6. (To be published)
[4] R.E. Halliwell, J.D. Quirt, and A.C.C. Warnock, “Design and Commissioning of a New Floor Sound Transmission Facility”, Proc INCE 93, p995.
[5] Warnock, A.C.C., “Low frequency impact sound transmission through floor systems”., Inter-Noise 92, Toronto, p743, 1992
[6] ASTM E492 Standard Test Method for Laboratory Measurement of Impact Sound Transmission through Floor-ceiling Assemblies using the Tapping Machine.
[7] ASTM E989 Standard Classification for Determination of Impact Insulation Class.
[8] ISO 717 Acoustics — Rating of sound insulation in buildings and of building elements Part 2: Impact sound insulation.
[9] JIS 1418 Japanese National Standard describing impact testing of floors.
[10] Tachibana, Tanaka, Koyasu. “Heavy impact source for the measurement of impact sound insulation of floors”, Proc. INCE 92, p 643.
[11] Rating of Impact Sound Insulation between dwellings", Kaj Bodlund, Statens Provningsanstalt, Technical Report 1985:01, also J. Sound and Vibration, 102(3), p381, 1985. Bodlund, K., Alternative reference curves for evaluation of the impact sound insulation between dwellings, J. Sound and Vibration (1985), p381-402.