Publisher’s version / Version de l'éditeur:
Vous avez des questions? Nous pouvons vous aider. Pour communiquer directement avec un auteur, consultez la
première page de la revue dans laquelle son article a été publié afin de trouver ses coordonnées. Si vous n’arrivez pas à les repérer, communiquez avec nous à PublicationsArchive-ArchivesPublications@nrc-cnrc.gc.ca.
Questions? Contact the NRC Publications Archive team at
PublicationsArchive-ArchivesPublications@nrc-cnrc.gc.ca. If you wish to email the authors directly, please see the first page of the publication for their contact information.
https://publications-cnrc.canada.ca/fra/droits
L’accès à ce site Web et l’utilisation de son contenu sont assujettis aux conditions présentées dans le site LISEZ CES CONDITIONS ATTENTIVEMENT AVANT D’UTILISER CE SITE WEB.
2000 Annual Conference of the Canadian Society for Civil Engineering
Proceedings CSCE'00, S, pp. 434-441, 2000-06-05
READ THESE TERMS AND CONDITIONS CAREFULLY BEFORE USING THIS WEBSITE.
https://nrc-publications.canada.ca/eng/copyright
NRC Publications Archive Record / Notice des Archives des publications du CNRC :
https://nrc-publications.canada.ca/eng/view/object/?id=e2ff7329-7f53-4129-aeb2-7c2faec23fba
https://publications-cnrc.canada.ca/fra/voir/objet/?id=e2ff7329-7f53-4129-aeb2-7c2faec23fba
NRC Publications Archive
Archives des publications du CNRC
This publication could be one of several versions: author’s original, accepted manuscript or the publisher’s version. / La version de cette publication peut être l’une des suivantes : la version prépublication de l’auteur, la version acceptée du manuscrit ou la version de l’éditeur.
Access and use of this website and the material on it are subject to the Terms and Conditions set forth at
Response of the Confederation Bridge to ice action
Preprint of paper for the
CSCE 2000 Conference
held in London, Ontario on June 7 – 10, 2000RESPONSE OF THE CONFEDERATION BRIDGE TO ICE ACTION
I. KubatA, R. FrederkingAand T. HayakawaB
A Canadian Hydraulics Centre, National Research Council Canada, Ottawa
B Visiting Researcher from Civil Engineering Research Institute, Hokkaido Development Agency (JAPAN)
ABSTRACT: The Confederation Bridge is a 13 km long structure which spans the Northumberland Strait, connecting Prince Edward Island and New Brunswick. Because of the uniqueness of the structure, an extensive monitoring and research program is being carried out. A complimentary program is being conducted to measure the response of the bridge piers to the effects of drifting pack ice near the center of the Strait. Instrumentation to measure pier tilt was installed inside two piers adjacent to the navigation span. Pier tilt records for the period of February to April 1999 were obtained. Complimentary measurements of meteorological, ice and oceanographic parameters were also made. The method for analysing pier response to ice effects is described and illustrated for a case where the ice is exerting a load on a pier. A discussion of the method for using measured pier response to determine pack ice pressure is given.
1. INTRODUCTION
The forces which floating ice can exert on river and lake structures have been an area of active research over the past several decades. Starting in the 1960s, field measurement programs have been carried out on bridge piers in Alberta (Montgomery et al. 1980) and New York (Haynes et al. 1991), for example. Also programs have been conducted to measure ice forces on light piers in lakes (Frederking et al. 1991). The Arctic has been an area of active measurements of ice forces on the large offshore drilling platforms used for petroleum exploration (Wright et al. 1986). These measurements provided data on ice forces in the extreme ice conditions of the Arctic. In the case of smaller structures in more temperate marine ice environments, however, there has been much less information. The Confederation Bridge, which is in a temperate but very dynamic marine ice environment, provides a new site for investigation of ice forces. A Natural Sciences and Engineering Research Council (NSERC) collaborative R&D program is underway to assess the performance of the Bridge in response to environmental factors such as wind,
seismicity, traffic and temperature, in addition to ice (Cheung et al. 1997).
The presence of the Confederation Bridge across Northumberland Strait has had an effect on the ice conditions in the area. The multiple piers and the strong tides which move the ice back and forth, drive the ice against the piers, either breaking it or lodging it against the piers. The ice forces on the pier are a function of the ice thickness, size of floes and the forces driving the ice floes. Generally, the ice is broken up into smaller pieces as a result of failing against the bridge piers. Ice movements are also affected by the Bridge; the concentration upstream of the Bridge is greater than that downstream (Peterson et al. 1998). The Bridge has also had an effect on winter navigation through the Strait. Before the Bridge, ships could select areas with the least ice, often following a shore lead. Now, with the Bridge, navigation is restricted to the navigation span in the center of the Strait. The navigation span provides a channel 172 m wide through which all marine traffic must pass. The presence of ice and particularly pressure in the ice can have a serious affect on the
2
ability to navigate safely through this narrow channel. Knowledge on the magnitude, frequency and circumstances of pressured ice and ice forces on the piers is of interest for winter navigation and ice forces on the Bridge. This paper will describe instrumentation placed in two of the bridge piers to measure the response of the piers to ice action, present some representative results, describe the associated environmental conditions, and put forward a means for estimating pressure in the ice.
2. BACKGROUND
The Confederation Bridge is a 12.9 km long structure, which crosses the Northumberland Strait, connecting the provinces of New Brunswick and Prince Edward Island (P.E.I.). The main section of the Bridge (11 km) consists of 43 spans each 250 m long and 44 piers numbered P1 to P44 starting at the P.E.I. end. The average water depth is about 20 m and a typical pier shaft extends 29 m above the water. Alternate spans rigidly connect two piers to form a frame. A drop-in span connects each frame and allows for expansion and contraction of the Bridge. A profile of water and foundation depth for each pier along the bridge alignment is shown in Figure 1.
-40 -35 -30 -25 -20 -15 -10 -5 0 0 4 8 12 16 20 24 28 32 36 40 44 Pier Number D e p th ( m ) water depth foundation depth P24 P23
Figure 1. Profile of water and foundation depth for piers across Northumberland Strait
The cross section of the pier is shown in Figure 2. The piers have a 52-degree slope conical ice shield at water level, which minimizes ice forces on the pier. The sloped pier causes level ice or ridges to ride up the cone after impact and then fail in bending under their own weight. The ice force on the piers is smaller than if the ice failed in crushing against a vertical cylindrical pier of similar diameter. The maximum ice force used in design is 30 MN per pier (Tadros, 1997).
Girder Matchcast Pier Shaft Ice Shield Pier Base Varies: Pier 23 = 38.2m Pier 24 = 32.9m Varies: Pier 23 = 24.3m Pier 24 = 26.5m 4.0m 3.2m 1.25m Northwest Southeast
Figure 2. Cross section of the pier
The ice cover in Northumberland Strait is first year sea ice. It starts to form in December along the shore. In January, the ice cover begins to extend out from the shore. Gradually, the ice thickens and consolidates into ice floes that move in the Strait under the action of currents, tide, and wind. The ice cover is almost always in a state of motion, ensuring near continuous interaction of ice with the Bridge. Because of the dynamic conditions, pressure ridges are also common. Ice usually remains in the Strait until some time in April. Two piers adjacent to the navigation span, P23 and P24, were selected for measuring ice loading. Each of the two piers has a different height and foundation stiffness. The foundation of pier P23 is 24.3 m below the water line (GML) and the top of the pier (base of girder) is 38.2 m above GML. The foundation of pier P24 is 26.5 m below the waterline and its top is 32.9 m above the water. Pier P24 has about a 50% softer foundation compare to pier P23 (Ross Gilmour, personal communication). The analysis in this paper is focused on the effects of drifting pack ice, i.e. a response of the bridge piers to pack ice pressure.
This project involves an extensive collaboration with the Department of Fisheries and Oceans through the Bedford Institute of Oceanography (BIO), and Public Works and Government Services Canada (PWGSC). BIO is carrying out a program investigating ice conditions in Northumberland St. and the affect of the Bridge on them. As part of this study, they have carried out helicopter surveys of ice conditions and installed
instrumentation to measure ice thickness and drift velocity. An Ice Profiling Sonar (IPS) and Acoustic Doppler Current Profiler (ADCP) were located 200 m and 400 m, respectively, upstream from Pier 23. PWGSC provided liaison with the Ottawa Carleton Bridge Research Institute who is managing the NSERC collaborative R&D project, and supplied meteorological data.
3. INSTRUMENTATION
The objective of the instrumentation was to have a reliable, simple, unattended, battery-powered, low-draw system. The response of the piers to ice loading was quantified by measuring change in tilt at two levels in the pier. Applied Geomechanics 700-Series tiltmeters were selected for their high-sensitivity, low power consumption, durability, and reliability under rugged field conditions. They have an operational temperature range of –30°C to +70°C, a resolution of 0.1 µ rad, and have a full-scale range of ± 7500 µ rad. Because of the high sensitivity of these instruments, an adjusting plate was devised to make it easier to set up the tiltmeters and align them to a zero output condition. A tiltmeter and adjusting plate assembly is illustrated in (Figure 3). The tiltmeter output is a DC signal that is proportional to the tilt angle. The tiltmeters measure tilt about two orthogonal axes; ± X-axis tilt (longitudinal direction of Bridge) and ±Y-axis tilt (perpendicular to bridge axis). The power requirements for the tiltmeters are ±12 VDC.
Figure 3. Tiltmeter and adjusting plate assembly Campbell Scientific CR10 dataloggers and SM716 storage modules were used for measuring, digitizing and storing the output of the tiltmeters. The logging system has the advantage of also being powered by a 12 VDC supply and a low power demand. The CR10 is
a fully programmable datalogger in a rugged, sealed module with a reliable operational temperature range of –55°C to +70°C. The SM716 storage module has a 716 K byte RAM and can be linked to the CR10. Up to 8 storage modules can be connected to one CR10. The logging program was written with Campbell Scientific PC208W software on a PC and then downloaded to the CR10. The same software was used to retrieve data from the storage modules, convert to ASCII file format and store on a PC.
The logging program was configured to take readings every second and calculate and store a 20-second average every 20 seconds. This program was chosen to capture the response of the Bridge to ice loads while conserving storage space on the storage modules. Additionally, temperature of the tiltmeter and battery voltage were recorded. The instrumentation at each of pier P23 and pier P24 comprised two tiltmeters, a CR10 and two storage modules. Two deep cycle 200 Amp-hour marine batteries ensured there was sufficient power for the tiltmeters and the datalogger for the three-month measurement period. Two batteries provided the ±12VDC input power required by the tiltmeters.
4. INSTALLATION
The instrumentation was set up inside two piers adjacent to the navigation span, piers P23 and P24. Two tiltmeters were installed inside each pier on the upstream side (northwest); one at the bottom of the pier inside the ice shield, 3.2 m above the water level (7.2 m from the ice shield’s bottom edge) and one at the top of the pier inside the match cast, 1.25 m below the bottom edge of the girder, as shown in Figure 2. The sign convention for tiltmeter output is as follows: (i) for X-axis tilt + is a clockwise rotation when looking at the tiltmeter (Figure 4); (ii) for Y-axis tilt + is for the top of the tiltmeter to tilt away when looking at the tiltmeter. Remembering that the tiltmeter is on the upstream (northwest) side of the pier, ice impact from that direction would result in a decrease of the output. The X-axis tilts are in the longitudinal direction of the bridge (northeast - southwest), and are primarily in response to thermal expansion or contraction of the spans. Y-axis tilts are perpendicular to the longitudinal axis of the Bridge and are in response to ice and wind loading. The tiltmeters in pier P23 were installed on January 27, 1999. At this time, the logging program was designed to collect data of X-axis tilt, Y-axis tilt, temperature, and battery voltage. Two storage modules were connected to the datalogger. Readings of all variables were taken every second and a 20-second average was recorded every 20 seconds. The capacity for storing data using
4
this program was 7 days per one storage module. The tiltmeters for pier P24 were installed on February 20, 1999. At this time, the software for collecting and storing data in both piers was modified to store temperature and battery voltage data only every 3rdhour. The intervals
for
-X +X
-Y +Y
Figure 4. Sign convention for tiltmeter output
storing data of X-axis and Y-axis tilts remained the same (20-second average every 20 seconds). This modified program increased the storage capacity to 10.5 days per storage module, or 21 days for two modules.
The Bridge was accessed three times after February 20 to exchange storage modules and check on data collection, battery voltage and the functioning of the instrumentation. The visits were done in the middle of March, the beginning of April, and the beginning of May. Each time the two storage modules in each pier were replaced with empty storage modules. The storage modules were returned to BIO where their personnel down-loaded and sent the data files to NRC in Ottawa.
5. ANALYSIS OF RESULTS
The emphasis of this paper is focused on analyzing the events where pack ice acted against the bridge pier generating pressure in ice. This was done by looking for situations where the bridge piers experienced ice loading while the ice cover was not moving.
The original measurement data collected were voltage readings, which first were converted to engineering units of µ rad and °C using calibration factors supplied by the instrument manufacturer. At the time of installation of the tiltmeters it could not be established that there was
no load on the piers, so a later time when this condition was met was sought to establish a baseline for tilt. Examination of the record for wind, ice and current suggested that this condition was met at Julian Day 65.7 or 21:00 UTC (formerly known as Greenwich Meridian Time) on March 6, 1999. At this time all Y-axis and X-axis tilts at both elevations in the piers were taken to be zero and the entire time series record of tilt for the whole season was adjusted to this base line.
Both wind and ice loading can cause the pier to tilt. If only ice loading is acting on the pier, the Y-axis tilt measured at the lower level is a function of rotation of the pier on its foundation and bending of the lower pier shaft. In this case the tilt at the upper level should be the same as at the lower level. It was observed that wind had a significant effect on the measured tilt. This is not surprising, given the large depth and length of the girder. The centre of action of the wind would be some distance above the top of the pier as well. The pier shaft above the ice shield was relatively slender, compared to the cross-section of the pier below the ice shield. Thus when only wind loading was acting on the pier, Y-axis tilt at the upper level would be significantly larger than tilt at the level just above the water line. To illustrate this point, Y-axis tilt at two levels of pier P23 plus wind velocity normal to the Bridge is plotted in Figure 5.
-400 -350 -300 -250 -200 -150 -100 -50 0 114.4 114.6 114.8 115 115.2 115.4 115.6
Coordinated Universal Time (Julian Day)
T ilt ( m ic ro r a d ) -25 -20 -15 -10 -5 0 N o rm a l W in d S p e e d ( m /s ) Y bottom tilt Y top tilt
Normal wind velocity
Figure 5. Tiltmeter output of wind loading only at the upper and lower level of pier P23
Tilt at the upper level is about 4 times greater than at the lower level. Therefore wind effect had to be accounted for in order to identify the part of the pier response due to ice loading alone. The wind correction was based on selecting a period with no ice present so as to determine the pier response to wind effect alone. Reviewing wind data and pier tilt, a period starting at 12:00 UTC on Julian day 114 (April 24, 1999) was identified. Drag forces, due to wind are assumed to be proportional to the velocity squared. Thus the force due to the wind
(Fw) is proportional to square of the component of wind
velocity normal to the bridge, [Eq.1]
F
W
V
2.The wind force is not known, but the tilt response of the pier can be measured. The measured wind tilt change from the lower tiltmeter of pier P23 was smoothed and then plotted against the square of the normal component of velocity, Figure 6.
y = -0.1489x - 9.6753 R2 = 0.8773 y = -0.1918x R2 = 0.7777 -70 -60 -50 -40 -30 -20 -10 0 0 100 200 300 400
Normal velocity squared (m/s)²
S m o o th e d t il t c h a n g e ( µ r ad ) start end load unload
Figure 6. Smoothed wind tilt change plotted against normal component of velocity squared, pier P23
It can be seen that there is a general linear trend. The regression line in Figure 6 was forced to intercept the origin since tilt should be zero for zero wind velocity. The slope of this curve yields a coefficient C which relates pier tilt (Tw) to velocity squared (V²),
[Eq.2]
T
W
CV
2.For the lower tiltmeter on pier P23 the value of C was 0.19, where Tw is in units of µ rad and V is velocity normal to the Bridge in m/s. In a similar manner correction factors for wind tilt effects for the upper tiltmeter at pier P23 and upper and lower tiltmeters at pier P24 were determined (the values of C were 0.91, 1.05, and 0.30, respectively). These correction factors were used to determine corrected values for tilt, which reflected response only to ice effects. Since the wind velocity measurements were only recorded at 10-minute intervals, a linear interpolation of wind velocity was performed to provide 20-second interval values for wind corrections of the tilt.
5.1 Sample Results
In the interest of brevity, this paper will just present a sample of the data analysis that has been done for all ice loading events. Events that occurred on March 11th,
Julian Day 70.0 to 70.5 were selected. Figure 7 presents the tilts measured at the lower level of piers P23 and P24. Note that these tilt values have been corrected for wind effects. The tilt record for pier P23 shows two events which could be described as pack ice pressure events, that is the pier tilt (ice load) increases, remains relatively stable for some time and then decreases. The record for pier P24 shows what are described as ice
loading events; that is a shorter period increase of tilt
(load) followed by a rapid drop off. Events #1 and #2 on P23, of duration about 1 and 2 hours, respectively, are representative of pack ice pressure event. For pier P24, Events A through I (Figure 7) are ice loading events.
-40 -35 -30 -25 -20 -15 -10 -5 0 70 70.1 70.2 70.3 70.4 70.5 Julian Day
Tilt of Bottom Y (µ rad)
0 1 2 3 4 5 6 7 8
Normal Wind Velocity (m/s)
Wind Event #1 Event #2 Pier 23 Pier 24 A B C D E FD H I
6
The trajectory of ice movement around pier P23 is
shown in Figure 8 starting at JD 70.0. This plot is constructed from half-hourly average ice velocity measurements made with the ADCP. The x-axis in
-500 0 500 1000 1500 2000 2500 3000 3500 4000 4500 -4 50 0 -4 00 0 -3 50 0 -3 00 0 -2 50 0 -2 00 0 -1 50 0 -1 00 0 -5 00 0 500 Southeast (m) Southwest (m) P23 P24 North Start, JD 70.0 Stopped, JD 70.07 Stopped, JD 70.28 End, JD 70.5
Figure 8. Trajectory of ice movement around pier P23 Figure 8 is parallel to the alignment of the Bridge. The plot showed that the ice moved to the northwest until JD 70.07 when it stopped and changed direction to the southeast. At JD 70.16, the direction of ice movement changed to east and continued until JD 70.28 when it stopped. At JD 70.30 it started moving towards the west. These ice movements are the result of tidal current and wind acting on the ice.
The upper part of Figure 9 plots current, ice, and wind velocity vectors before, during, and after these two events. The x-axis in Figure 9 is parallel to the alignment of the Bridge. This Figure also indicates the two time periods when pier P23 responds to pack ice pressure as already mentioned. The ice drift is influenced by both wind and current forces. These forces are derived from the drag equation where shear stress () is proportional to the density () times velocity squared (V²) times the drag coefficient (Cd),
[Eq.3]
C
dV
2/
2
.
The current drag is higher as a result of higher water density (w = 1000 kg/m3) compared to density of air
(a= 1.29 kg/m3), and a higher water drag coefficient
(25 x10-3) than air drag coefficient (2 x10⁻³). In fact, the
wind velocity would have to be about 30 times higher than current velocity to have a comparable influence on ice drift.
The magnitude of the ice, wind, and current speed is shown in the lower part of Figure 9. The average wind speed during Event #1 is 6 m/s, the current speed decreases from 0.33 m/s to 0.17 m/s. Using equation [Eq.3] wind shear and current shear are calculated. Their values are 0.046 Pa and 0.781 Pa, respectively. Figure 9. Current, ice, and wind velocity vectors and magnitude of speed
Ice 6 0 c m / s W in d 15 m /s 70.0 70.1 70.2 70.3 70.4 7 0 . 5 C u r r e n t 6 0 c m / s 0 1 0 2 0 3 0 4 0 5 0 6 0 7 0 7 0 7 0 . 1 7 0 . 2 7 0 . 3 7 0 . 4 7 0 . 5 J u l i a n D a y 0 2 4 6 8 1 0 1 2 1 4 C u r r e n t I c e W i n d E v e n t # 1 E v e n t # 2
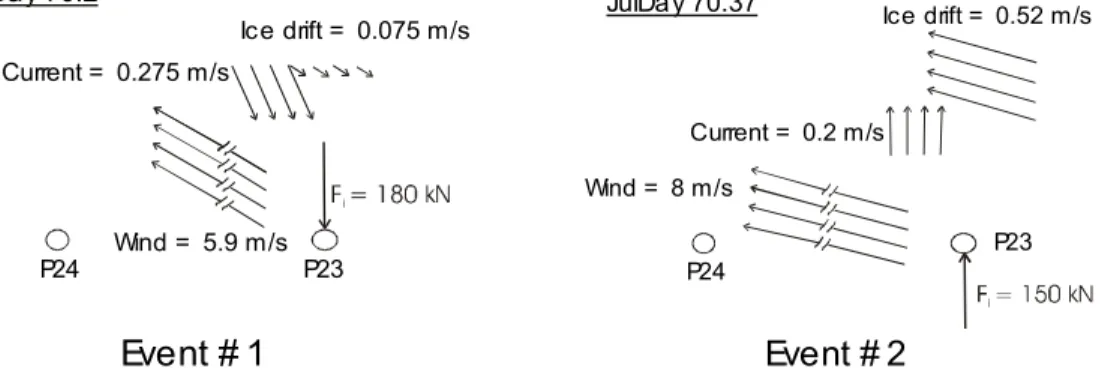
The shear components are then used to determine the shear resultant, which is 0.759 Pa and acts towards the southeast, normal to the axis of the Bridge. The force generated by shear components causes pack ice pressure on the pier from the upstream side. The average magnitude of this force is 6 µ rad. According to Cheung et al. (1997) a 0.1µ rad tilt change corresponds to a 3 kN ice load change at piers P31 and P32. The conversion factor might differ in this case due to different foundation stiffness of the piers at P23 and P24, however, it is a reasonable basis for estimating ice load. The forces acting on the ice and pier are shown in Figure 10. The ice force on the pier is 180kN, and when distributed over a span of 250 m gives pack ice pressure of 720 N/m immediately upstream of the pier. This pack ice pressure is due to the presence of the Bridge. The relation between pack ice pressure due to the Bridge (Pi), force on the Bridge (Fi), and resultant of
current and wind shear (res) is given by the following
equation,
[Eq.4]
P
iF
i(
res)
L
250
where L is the distance upstream over which the resultant shear is assumed to act. Note that the sign on the resultant shear depends on whether it acts in the same direction as Fi. From [Eq.4] it can be seen that the
pack ice pressure (Pi) varies linearly with L. For
Event #1, [Eq.4] indicates that the pack ice pressure due to the Bridge decreased from 720 N/m close to the Bridge to zero at a distance about 1 km upstream of the Bridge.
The average wind speed during Event #2 is 9 m/s, the current speed increases from 0.12 m/s to 0.27 m/s. Note that the current direction is reversed from that of Event #1. Equation [Eq.3] was again used to calculate wind shear and current shear, and their resultant was determined. The values are 0.104 Pa, 0.5 Pa, and 0.505 Pa, respectively. The wind shear and current shear act at right angles to each other, but the resultant is normal to the bridge axis, to the northwest. The ice was observed to move mostly parallel to the alignment of the Bridge, towards the southwest (see Figure 9). Note that the ADCP that was used to measure ice drift was located 400 m northwest of pier P23 and was therefore in the lee of the pier. The ice drift velocity in this case was high, 0.5 m/s, and in a similar direction to the wind. The resultant shear generated a force on the pier from the southeast side, which caused a maximum tilt during this event of 5 µ rad. The forces acting on the pier are shown in Figure 10. In this case the force on the pier is 150 kN, equivalent to a pack ice pressure of 600 N/m.
From measurement with the IPS, the average ice thickness during these events was about 0.6 m, and the maximum keel depth was about 5 m. The results for pack ice pressure presented here should not be taken as representative of average or maximum pack ice pressure adjacent to the Bridge, but rather as illustrative of the measurement and analysis method.
Actual images of the ice surrounding the pier are not available, but it is assumed that during both Events the ice was stopped on the upstream side of the pier and the measured tilt response is a function of the current, wind, and pack ice pressure. This is a handicap in interpreting the results. For the winter of 2000, a time lapse video system will be deployed to obtain an
indication of ice conditions. Also, two IPSs and ADCPs will be deployed,
Figure 10. Forces acting on the pier P23 during Event #1 and Event #2
P23 P24 Current = 0.275 m/s Ice drift = 0.075 m/s Wind = 5.9 m/s
Event # 1
JulDay 70.2 P23 P24 Current = 0.2 m/s Ice drift = 0.52 m/s Wind = 8 m/sEvent # 2
JulDay 70.378
upstream and downstream of the pier. This will give a better indication of ice drift, regardless of drift direction.
6. SUMMARY AND CONCLUSION
A simple and reliable system for measuring pier response and recording it has been developed. During this monitoring program the magnitude of the pier tilts was recorded over a 83-day period, and ancillary information on wind, current and ice drift obtained. A method was derived to correct for the effect of wind so that pier response to ice loading could be determined. These data, together with the magnitude of the wind and the current velocity enable the evaluation of the pack ice pressure in the ice adjacent to the Bridge. The pack ice pressures obtained were quite low, 600 – 700 N/m; however with thicker and colder ice, higher values could be expected. A simple analysis suggests that the area over which pack ice pressures are affected by the Bridge is small. The ice forces, which have been determined in this paper, are for purposes of explaining the analysis method. They are not representative or typical of ice forces that could act on the Bridge.
6.1 Acknowledgments
The assistance of Simon Prinsenberg and Murray Scotney of the Bedford Institute of Oceanography for the collection of oceanographic data and recovery of tilt data from the bridge is greatly appreciated. The collaboration of the Ottawa Carleton Bridge Research Institute and Public Works and Government Services Canada is also gratefully acknowledged. Funding support from the Program of Energy Research and Development of Natural Resources Canada facilitated this work.
7. REFERENCES
Cheung, M.S., Tadros, G.S., Brown, T., Dilger, W.H., Ghali, A. and Lau, D.T. (1997) Field monitoring and research on performance of the Confederation Bridge,
Canadian Journal of Civil Engineering, NRC, 24:
951-962.
Frederking, R., Sayed, M. and Penney, G. (1991) Measurements of Ice Forces on Light Piers in the St. Lawrence Seaway, The Proceedings of the First
(1991) International Offshore and Polar Engineering Conference, Edinburgh, The United Kingdom, II:
499-504.
Haynes, F.D., Sodhi, D.S., Zabilansky, L.J. and Clark, C.H. (1991) Ice Force Measurements on a Bridge Pier in the St. Regis River, New York, CRREL Special
Report, No. SR 91-14, Hanover, NH, USA.
Montgomery, C.J. and Lipsett, A.W. (1980) Dynamic response of bridge piers to ice forces, Canadian
Journal of Civil Engineering, NRC, 7: 432-441.
Peterson, I.K., Prinsenberg, S.J. and Maillet, A. (1998) 1997 Pack ice properties in Northumberland Strait,
The Proceedings of the Eighth (1998) International Offshore and Polar Engineering Conference, Montreal,
Quebec, Canada, II: 513-518.
Tadros, G. (1997) The Confederation Bridge: an overview, Canadian Journal of Civil Engineering, NRC, 24: 850-866.
Wright, B., Pilkington, G.R., Woolner, K.S. and Wtight, W.H. (1986) Winter ice Interactions with a Arctic Offshore Structure, IAHR Symposium on Ice, August