CERN-PH-EP-2012-131 10 December 2012
Measurement of electrons from semileptonic heavy-flavour hadron decays
in pp collisions at
√
s
= 7 TeV
ALICE Collaboration*
Abstract
The differential production cross section of electrons from semileptonic heavy-flavour hadron decays has been measured at mid-rapidity (|y| < 0.5) in proton-proton collisions at√s= 7 TeV with AL-ICE at the LHC. Electrons were measured in the transverse momentum range 0.5 < pt< 8 GeV/c. Predictions from a fixed order perturbative QCD calculation with next-to-leading-log resummation agree with the data within the theoretical and experimental uncertainties.
*See Appendix A for the list of collaboration members
1 Introduction
The measurement of heavy-flavour (charm and beauty) production serves as an important testing ground of quantum chromodynamics (QCD), the theory of the strong interaction. Because of the large quark masses, heavy-flavour production in proton-proton (pp) collisions proceeds mainly through initial hard parton-parton collisions. Therefore, the production cross sections of charm and beauty quarks should provide a precision test of perturbative QCD (pQCD) for all values of transverse momenta pt. In previous
experiments with p¯p collisions at the Tevatron (√s= 1.96 TeV), charm production cross sections were measured at high ptonly and were found to exceed, by about 50% [1], the cross sections expected from
pQCD calculations [2–4]. This, however, is still compatible with the substantial theoretical uncertainties. Beauty production at the Tevatron is well described by such calculations [5].
While the measurement of heavy-flavour production in pp collisions is important in its own interest, it also provides a crucial baseline for corresponding measurements in ultrarelativistic heavy-ion collisions. In such collisions a strongly interacting partonic medium is formed [6–9]. Heavy quarks interact with this medium after they have been produced in the initial stage of the collision. Consequently, heavy quarks suffer energy loss while they propagate through the medium, and they participate in the collec-tive dynamics. The resulting modifications of the heavy-flavour momentum distributions in heavy-ion collisions with respect to those in pp collisions present a sensitive probe for the medium properties [10]. Heavy-flavour production can be investigated, among other channels, via the measurement of the con-tribution of semileptonic heavy-flavour decays to the inclusive lepton spectra. Both charm and beauty hadrons have substantial branching ratios (∼ 10%) to single electrons or single muons [11], giving rise to a large ratio of signal leptons from heavy-flavour hadron decays to background from other lepton sources, in particular at high pt.
Single electrons from heavy-flavour decays were first observed in the range 1.6 < pt< 4.7 GeV/c in
pp collisions at the CERN ISR at √s= 52.7 GeV [12], before the actual discovery of charm. At the CERN Sp¯pS, the UA1 experiment measured beauty production via single muons (10 < pt< 40 GeV/c) at
√
s= 630 GeV [13] while the UA2 experiment used single electrons (0.5 < pt< 2 GeV/c) to measure the
charm production cross section [14]. At the Tevatron, both the CDF and D0 experiments measured beauty production via single electrons (7 < pt< 60 GeV/c) [15] and single muons (3.5 < pt< 60 GeV/c) [16],
respectively.
At RHIC, semileptonic heavy-flavour decays were extensively studied in pp and, for the first time, in heavy-ion collisions, mainly in the electron channel. With the PHENIX experiment the range 0.3 < pt<
9 GeV/c was covered [17], and with the STAR experiment electrons from heavy-flavour hadron decays were measured in the range 3 < pt< 10 GeV/c [18]. Within experimental and theoretical uncertainties
pQCD calculations are in agreement with the measured production cross sections of electrons from charm [18, 19] and beauty decays [20, 21] at mid-rapidity in pp collisions at√s= 0.2 TeV. In Au-Au collisions, the total yield of electrons from heavy-flavour decays was observed to scale with the number of binary nucleon-nucleon collisions [22]. However, a strong suppression of the electron yield was discovered for pt> 2 GeV/c [23, 24] with a simultaneous observation of a nonzero electron elliptic flow
strength v2for pt< 2 GeV/c [10], indicating the substantial interaction of heavy quarks with the medium
produced in Au-Au collisions at RHIC.
At the LHC, heavy-flavour production is studied in pp collisions at higher energies. Perturbative QCD calculations agree well with lepton production cross sections from heavy-flavour hadron decays mea-sured for pt > 4 GeV/c with the ATLAS experiment at
√
s= 7 TeV [25]. Furthermore, pQCD calcula-tions of beauty hadron decays are in good agreement with production cross seccalcula-tions of non-prompt J/ψ at mid-rapidity as measured with the CMS experiment at high pt(pt> 6.5 GeV/c) [26] and with ALICE
(A Large Ion Collider Experiment) at lower pt(pt> 1.3 GeV/c) [27]. D-meson production cross sections
7 TeV [28] and at 2.76 TeV [29]. In addition, pQCD calculations are in agreement with the spectra of muons from heavy-flavour hadron decays at moderate pt as measured with ALICE at 7 TeV [30] and
at 2.76 TeV [31]. It is of particular importance to investigate charm production at low pt [28] in order
to measure the total charm production cross section with good precision. Furthermore, low-pt charm
measurements at the LHC probe the parton distribution function of the proton in the region of parton fractional momenta x ∼ 10−4 and squared momentum transfers Q2∼ (4 GeV)2, where gluon saturation
effects might play a role [32].
This paper presents a measurement of single electrons, (e++e−)/2, from semileptonic decays of charm and beauty hadrons in the transverse momentum range 0.5 < pt< 8 GeV/c at mid-rapidity (|y| < 0.5)
in pp collisions at√s= 7 TeV with ALICE. For such a measurement an excellent electron identifica-tion (eID) and precise knowledge of the remaining hadron background in the electron candidate sample are mandatory. Two complementary eID approaches are employed. Both are based on the particle spe-cific energy loss dE/dx in the ALICE Time Projection Chamber, required to be compatible with the energy loss of electrons. To increase the purity of the electron candidate sample, in the first approach a combination of time-of-flight measurements and the response of the transition radiation detector is employed (TPC-TOF/TPC-TRD-TOF analysis). In the second approach, electromagnetic calorimetry is used (TPC-EMCal analysis).
This article is organised as follows: Section 2 gives an overview over the ALICE detector systems that are relevant for the analysis presented here. The details of the data analysis are described in Section 3. The differential production cross section of electrons from semileptonic heavy-flavour decays is presented in Section 4. In the same Section, pQCD calculations at fixed order with next-to-leading-log resummation (FONLL [2,3,33]) are compared with the data, which extend the ATLAS measurement of electrons from heavy-flavour hadron decays to lower pt. This article concludes with a summary in Section 5.
2 ALICE setup
ALICE [34] is the experiment at the LHC dedicated to the study of heavy-ion collisions. The standard ALICE coordinate system is used, in which the interaction point (IP) where the particles collide is at the origin of a right-handed Cartesian co-ordinate system. From the IP the z axis is along the beam pipe, the x axis points towards the center of the LHC, φ is the azimuthal angle around the z axis, and θ is the polar angle with respect to this axis. The setup includes a muon spectrometer at backward pseudorapidity (−4 < η < −2.5) and a central barrel comprising several detector subsystems located inside a large solenoidal magnet. The magnet provides a uniform magnetic field of 0.5 T along the beam direction. Most of the barrel detectors have a common pseudorapidity coverage of −0.9 < η < 0.9. The apparatus is described in detail elsewhere [34]. In the following, the detectors used in the analysis are discussed briefly. For guidance, Fig. 1 shows a schematic beam view at z = 0 of the ALICE central barrel detectors as present during the 2010 running period of the LHC.
The vacuum beam pipe is made of beryllium with a thickness of 800 µm, and an inner diameter of 58 mm. For protection the pipe is wrapped with polyimide with a thickness of about 80 µm. The corresponding material budget is 0.26% of a radiation length (X0) at η = 0.
The beam pipe is surrounded by the Inner Tracking System (ITS). The ITS provides high-resolution space points for charged particle tracks close to the interaction point, thus improving the momentum and angular resolution. The ITS includes six cylindrical layers employing three different silicon detector technologies. The two innermost layers (at radii of 3.9 cm and 7.6 cm), which are equipped with Silicon Pixel Detectors (SPD), provide a spatial resolution of 12 µm in the plane perpendicular to the beam direction (rφ ) and 100 µm along the beam axis (z). About 83% of the SPD channels were operational for charged particle detection during the data taking relevant for this analysis. The SPD also contributes to the collision trigger providing a fast estimation of the event multiplicity. The two intermediate layers
ITS TPC EMCal TRD TPC TOF
Fig. 1: (Colour online) Schematic beam view at z = 0 of the ALICE central barrel detectors during the 2010 running period of the LHC. The detectors used in the present analysis are the Inner Tracking System (ITS), the Time Projection Chamber (TPC), the Transition Radiation Detector (TRD), the Time-Of-Flight Detector (TOF), and the Electromagnetic Calorimeter (EMCal).
of the ITS are built with Silicon Drift Detectors (SDD) and the two outermost layers consist of double-sided Silicon Strip Detectors (SSD). Their radii extend from 15 to 43 cm. The ITS modules were aligned using survey information, cosmic-ray tracks, and pp data with the methods described in [35]. The ma-terial budget of the entire ITS corresponds on average to about 7.18% of X0 at η = 0 [34]. The exact
knowledge of the material budget in the innermost ITS layers is crucial here as the conversion of pho-tons into electron-positron pairs in material is the source of an important background component in the present analysis. In the ALICE experiment, the reconstruction of such conversion pairs has resulted in a measurement of the relevant material budget with a precision of 4.5% [36].
The most important detector for the track reconstruction and the momentum measurement is the Time Projection Chamber (TPC), which is also used for particle identification [37]. The ALICE TPC is a large
cylindrical drift detector whose active volume extends radially from 85 to 247 cm, and from -250 to +250 cm along the beam direction. The active volume of nearly 90 m3is filled with a Ne (85.5%), CO2
(9.5%), and N2(4.8%) gas mixture. A central high-voltage electrode maintained at -100 kV divides the
TPC into two sections. The end-caps are equipped with multiwire proportional chambers with cathode pad readout. For a particle traversing the TPC, up to 159 space points (clusters) are recorded. The cluster data are used to reconstruct the charged particle trajectory in the magnetic field as well as to calculate the particle’s specific energy loss dE/dx in the TPC gas. Simultaneous measurements of the dE/dx and momentum allow the identification of the particle species which has produced the track. The dE/dx resolution of the TPC, σTPC−dE/dx, was approximately 5.5% for minimum ionising particles crossing
the full detector [38]. The dE/dx resolution was determined using minimum ionising pions and cosmic ray muons at the Fermi plateau. Charged particle tracks are reconstructed in the ITS and TPC with a transverse momentum resolution ranging from about 1% at 1 GeV/c, to about 3% at 10 GeV/c [37]. The TPC is surrounded by the Transition Radiation Detector (TRD) at a radial distance of 2.9 m from the beam axis. The TRD is segmented in the azimuth direction in 18 individual super-modules, seven of which were installed in the 2010 running period of ALICE as indicated in Fig. 1. Each super-module is segmented further in five units (stacks) along the beam direction. Each stack comprises six layers in the radial direction. Each detector element consists of a fibre sandwich radiator of 48 mm thickness [39], a drift section of 30 mm thickness, and a multiwire proportional chamber section (7 mm thickness) with pad readout. The gas is a mixture of Xe (85%) and CO2(15%) [40–43]. The scope of the TRD is to
provide a good separation of electrons from pions, particularly for momenta above 1 GeV/c. This is accomplished by measuring transition radiation photons, which are produced only by electrons [44]. The TRD is also designed to provide a fast trigger with particle identification information to discriminate electrons from hadrons [45]. This trigger was not used in the 2010 data taking.
At larger radii, at a distance of 3.7 m from the beam axis, the Time-Of-Flight (TOF) detector provides further essential information for the particle identification. The TOF detector is segmented in 18 sectors and covers the full azimuth. Each sector contains 91 Multigap Resistive Plate Chambers (MRPCs). In total, 152,928 sensitive pads of dimension 2.5×3.5 cm2are read out. The TOF resolution of the particle arrival time is, at present, better than 100 ps [46]. The start time of the collision is measured by the ALICE T0 detector, an array of Cherenkov counters located at +350 cm and -70 cm along the beam-line, or it is estimated using the particle arrival times at the TOF detector in events without a T0 signal. In the case that neither of the two methods provides an output an average start time is used. Depending on the start time method used, the corresponding resolution is taken into account in the overall TOF PID resolution. The particle identification is based on the difference between the measured time-of-flight and its expected value, computed for each mass hypothesis from the track momentum and length of the trajectory. The overall resolution of this difference σTOF−PIDis about 160 ps [28].
The Electromagnetic Calorimeter (EMCal) is a Pb-scintillator sampling calorimeter, located at a ra-dial distance of about 4.5 m from the beam line. The full detector covers the pseudorapidity range −0.7 < η < 0.7 with an azimuthal acceptance of ∆φ = 107o. In the 2010 running period of ALICE
the azimuthal coverage of the EMCal was limited to ∆φ = 40o, since only part of the detector was in-stalled. The calorimeter is of the ’Shashlik’ type built from alternating lead and scintillator segments of 1.44 mm and 1.76 mm thickness, respectively, together with longitudinal wavelength-shifting fibres for light collection. The cell size of the EMCal is approximately 0.014 × 0.014 rad in ∆φ × ∆η, and the depth corresponds to 20.1 X0. From electron test beam data, the energy resolution of the EMCal was
determined to be 1.7L
11.1/pE(GeV)L
5.1/E(GeV)% [47].
A minimum pt of about 0.3 GeV/c is needed for the particles to reach the TRD, TOF, and EMCal
detectors in the magnetic field of 0.5 T.
scintillators each, which are arranged in four rings around the beam pipe on either side of the interaction region, covering the pseudorapidity ranges 2.8 < η < 5.1 and −3.7 < η < −1.7, respectively. The time resolution of this detector is better than 1 ns. Information from the VZERO response is recorded in a time window of ± 25 ns around the nominal beam crossing time. The VZERO is used to select beam-beam interactions in the central region of ALICE and to discriminate against interactions of the beam with gas molecules in the beam pipe.
The ALICE minimum bias trigger required at least one hit in either of the two SPD layers or in the VZERO detector. In addition, collision events had to be in coincidence with signals from the beam position monitors, indicating the passage of proton bunches from both beams.
3 Analysis
3.1 General strategy
For the measurement of the differential invariant cross section of electrons from semileptonic decays of heavy-flavour hadrons the following strategy was adopted. First, charged particle tracks which fulfil a set of electron identification cuts were selected. From the electron candidate tracks the remaining contamination from misidentified hadrons was subtracted. After corrections for geometrical acceptance and efficiency the inclusive electron yield per minimum bias triggered collision was determined for two different electron identification strategies. Since for all relevant sources the spectra of decay positrons and electrons are identical (e+/e−= 1), the average spectrum of positrons and electrons, (e++ e−)/2, was used for the further analysis. The electron background from sources other than semileptonic heavy-flavour hadron decays was calculated using a cocktail approach and subtracted from the inclusive electron spectra. The resulting spectra of electrons from heavy-flavour hadron decays were normalised using the cross section of minimum bias triggered pp collisions. A weighted average of the two measurements obtained with different electron identification strategies led to the final result.
3.2 Data set and event selection
The data used in the present analysis were recorded during the 2010 running period. The luminosity was limited to 0.6 − 1.2 × 1029cm−2s−1in order to keep the probability of collision pile-up per triggered event below 2.5%. This was cross-checked by looking at events with more than one vertex reconstructed with the SPD.
The primary collision vertex can be determined using the reconstructed tracks in the event or the cor-related hits in the two pixel layers. Only events with a reconstructed primary vertex using one of the two methods were selected for further analysis. In order to minimise edge effects at the limit of the central barrel acceptance, the vertex was required to be within ±10 cm from the centre of the ALICE experiment along the beam direction. Integrated luminosities of 2.6 nb−1and 2.1 nb−1were used for the TPC-TOF/TPC-TRD-TOF and TPC-EMCal analysis, respectively.
In the offline analysis, pile-up events were identified using the SPD. Events with a second interaction vertex reconstructed with at least three tracklets (short tracks from SPD clusters) and well separated from the first vertex by more than 8 mm, are rejected from further analysis. Taking into account the efficiency of the pile-up event identification, less than 2.5% of the triggered events have been found to be related to more than one interaction. The effect of the remaining undetected pile-up was negligible for the analysis. Moreover, background from beam-gas interactions was eliminated using the VZERO timing information as well as the correlation in the SPD between the number of reconstructed charged particle track segments and the number of hits.
Table 1: Track selection cuts: except for the cut on the number of ITS hits and the request for hits in the SPD, the selections were common to all analysis strategies. See text for details.
Track property Requirement
Number of TPC clusters ≥ 120
Number of TPC clusters used in the dE/dx calculation ≥ 80
Number of ITS hits in TPC-TOF/TPC-TRD-TOF ≥ 4
Number of ITS hits in TPC-EMCal ≥ 3
SPD layer in which a hit is requested in TPC-TOF/TPC-TRD-TOF first SPD layer in which a hit is requested in TPC-EMCal any
χ2/ndf of the momentum fit in the TPC < 2
Distance of Closest Approach in xy (cm) < 1
Distance of Closest Approach in z (cm) < 2
3.3 Track reconstruction and selection
Charged particle tracks reconstructed in the TPC and ITS were propagated towards the outer detectors using a Kalman filter approach [48]. Geometrical matching was applied to associate tracks with hits in the outer detectors.
In the currently limited active area in azimuth of the TRD, the tracks were associated with track segments, called tracklets, reconstructed in individual chambers. This tracklet reconstruction assumed straight trajectories of charged particles passing a chamber. As the ALICE TRD comprises six layers, a track can include up to six tracklets. In the TPC-TRD-TOF analysis a minimum of four associated TRD tracklets was required for each electron candidate track. For each tracklet the charge deposited in the corresponding chamber was measured. This information was used for electron identification.
The EMCal coverage was limited in the 2010 run. In azimuth, the installed EMCal sectors neither overlap with the installed TRD supermodules nor with the area of the innermost SPD layer which was operational in 2010 as indicated in Fig. 1. Electromagnetic showers reconstructed in the EMCal were associated with charged particle tracks if the distance between the track projection on the EMCal surface and the reconstructed shower was small in η and φ . The quadratic sum of the difference between track projection and reconstructed position had to be less than 0.05 in (η,φ ) space for a track-shower pair to be accepted, where φ is measured in radians.
The pseudorapidity ranges used in the TPC-TOF/TPC-TRD-TOF and TPC-EMCal analyses were re-stricted to |η| < 0.5 and |η| < 0.6, respectively, because towards larger absolute values of η the system-atic uncertainties related to particle identification increase considerably.
Electron candidate tracks were required to fulfil several track selection cuts. Table 1 summarises these selection criteria. A cut on the χ2 per degree of freedom (ndf) of the momentum fit in the TPC was applied to reject fake tracks which comprise a significant number of clusters originating from more than one charged particle trajectory. A track reconstructed within the TPC is characterised by the number of clusters used for the track reconstruction and fit (up to a maximum of 159 clusters). Not all of these clusters are used for the energy loss calculation: those close to the borders of the TPC sectors are not considered. Separate cuts are applied on these two quantities. To guarantee good particle identification based on the specific dE/dx in the TPC, tracks were required to include a minimum number of 80 clusters used for the energy loss calculation. A cut on the number of clusters for tracking is used to enhance the electron/pion separation. As the energy deposit of electrons on the Fermi plateau is approximately 1.6 times larger than for minimum ionizing particles, the associated clusters are insensitive to detector threshold effects and electron tracks have, on average, a higher number of clusters. The stringent request for at least 120 clusters from the maximum of 159 enhances electrons relative to hadrons.
p (GeV/c)
-1
10
×
3 1 2 3 4 5 6 7 8
TPC dE/dx (arb. units)
40 60 80 100 120 140 160 1 10 2 10 3 10 4 10 5 10 π e K p d = 7 TeV s pp, p (GeV/c) -1 10 × 3 1 2 3 4 5 6 7 8 ) TPC-dE/dx σ ( el TPC dE/dx - <TPC dE/dx>| -10 -8 -6 -4 -2 0 2 4 6 8 10 1 10 2 10 3 10 4 10 π e K p d = 7 TeV s pp,
Fig. 2: (Colour online) Specific energy loss dE/dx in arbitrary units measured in the TPC as a function of the reconstructed charged particle momentum (left panel), and expressed as a deviation from the expected energy loss of electrons, normalised by the energy loss resolution (right panel). Contributions from both positively and negatively charged particles are included.
Kink candidates, i.e. tracks which are not consistent with the track model of continuous particle tra-jectories but show deviations due to decays in flight or the emission of Bremsstrahlung, were discarded from further analysis since the dE/dx resolution of the TPC is worse for such kink tracks than for regular tracks. In order to minimise the contribution from photon conversions in the ITS, a hit in the innermost SPD layer was required for all selected tracks in the TPC-TOF/TPC-TRD-TOF analysis. In total, at least four ITS hits were required to be associated with a track. Since the active area in azimuth of the EMCal overlapped with an inactive area of the first SPD layer, this approach had to be modified for the TPC-EMCal analysis. For the latter case, a matching hit was required in any of the two SPD layers and the required total number of ITS hits was reduced to three. Charged pion tracks from the weak de-cay K0S→ π+
π− occurring beyond the first SPD layer were used to demonstrate that the probability of random matches between tracks and uncorrelated hits in the ITS is negligible. A cut on the distance of closest approach (DCA) to the primary vertex in the transverse plane (xy) as well as in the beam direction (z) was applied to reject background tracks and non-primary tracks.
3.4 Electron identification
Electrons were identified using the information provided by various detector subsystems of the ALICE central barrel. The detector which played the most important role in particle identification for both analyses discussed here is the TPC. Particle identification in the TPC is based on the measurement of the specific energy loss dE/dx in the detector gas. The dE/dx distribution, expressed in arbitrary units, as a function of the particle momentum for tracks measured in 7 TeV pp collisions, is shown in the left panel of Fig. 2. The solid lines depict the energy loss for electrons, pions, kaons, protons, and deuterons expected from the Bethe-Bloch formula [49]. For the electron selection, the energy loss was expressed as a deviation from the parameterised electron Bethe-Bloch line, divided by the energy loss resolution σTPC−dE/dx, as shown in the right panel of Fig. 2.
Figure 2 demonstrates that the electron identification provided by the TPC is not sufficient at low mo-mentum (below 1.5 GeV/c) because the kaon and proton dE/dx lines cross the electron line. In addition, the merging of the dE/dx lines of electrons, muons, pions, and other hadrons limits the particle identifi-cation at high momentum. Therefore, a high purity electron candidate sample can only be selected with the help of other detectors. Two different strategies were used in this analysis, one employing in addition the information from the TOF and TRD detectors, and the other one based on the EMCal response.
3.4.1 TPC-TOF/TPC-TRD-TOF analysis
The information provided by the TOF detector is complementary to that from the TPC in the low mo-mentum region and it is used to resolve the ambiguities in the crossing regions of the TPC electron, kaon, and proton lines. The time-of-flight information allows the rejection of kaons up to a momentum of approximately 1.5 GeV/c and protons up to about 3 GeV/c. The selection was done by comparing the measured time-of-flight with the value expected assuming the particle being an electron. Only tracks compatible with the electron hypothesis within 3 σTOF−PID were considered as electron candidates for
further analysis. The difference between the measured time-of-flight and the expected time-of-flight, as a function of the momentum, is shown in the upper left panel of Fig. 3. Lines indicate the selection band. This criterion combined with the selection of tracks between 0 and 3 σTPC−dE/dxresulted in a pure
sample of electron candidates up to a momentum of approximately 4 GeV/c. In this momentum range, the hadron contamination remained below 1%, while above 4 GeV/c the pion contamination became significant again. At such high momenta the TOF information could not be used to reduce further the hadron contamination in the electron candidate sample. Therefore, the TPC-TOF analysis was restricted to the pt range below 4 GeV/c. To extend the accessible range to higher momenta, information from the
TRD was used. As for the TPC, particle identification in the TRD makes use of the specific energy loss in the detector gas. In addition, the measurement of transition radiation photons produced by electrons traversing the dedicated radiators in front of the TRD drift chambers enhances distinctively the capability of the TRD to separate electrons from hadrons. The charge deposit per tracklet was compared with ref-erence charge distributions obtained from dedicated test beam data [50], where electron and pion beams were provided at a number of different, discrete momenta. The probability of identifying a particle of given momentum as an electron was derived from a linear interpolation between the nearest measured data points in momentum. The electron probabilities were calculated for each TRD tracklet (up to six per track). They were combined for a given track and a likelihood value was calculated on which the eID is based.
The TRD electron likelihood distribution as a function of momentum for tracks passing the TOF selection and having six TRD tracklets is shown in the upper right panel of Fig. 3. The electron candidate selection was performed applying a momentum dependent cut defined such that it provided a constant electron efficiency of 80%. The pt dependence of this cut was determined using a clean sample of electrons
from photon conversions. Furthermore, this cut depends on the exact number of charge measurements (tracklets) available per track (four to six in the present analysis). The lower right panel of Fig. 3 depicts the cut described for six tracklets. Cuts for tracks with four or five tracklets were applied in the same way. The TRD selection was applied only for tracks with a momentum above 4 GeV/c because at lower momenta the TPC-TOF selection was sufficient. For tracks passing the TRD selection, the lower left panel of Fig. 3 shows the particle dE/dx in the TPC, expressed as the distance to the expected energy deposit of electrons, normalised by the energy loss resolution. Having used the TRD information, an excellent separation of electrons from pions is already visible in the whole momentum range up to 8 GeV/c. The selection of tracks between 0 and 3 σTPC−dE/dxresults in an almost pure sample of electrons
with a remaining hadron contamination of less than 2% over the full ptrange (see below).
3.4.2 TPC-EMCal analysis
An alternative approach to separate electrons from hadrons, over a wide momentum range, is based on electromagnetic calorimetry. Tracks were geometrically matched with clusters reconstructed in the EMCal. For each track, the momentum information was provided by the track reconstruction algorithms in the TPC and ITS. The corresponding energy deposit E was measured in the EMCal. The energy information was provided by a cluster of cells: the energy deposition was summed over adjacent cells, with an energy measurement above a threshold of ≈48 MeV around a seed cell.
p (GeV/c) -1 10 × 3 1 2 3 4 5 6 7 8 ) σ ( el - t T O F t -4 -2 0 2 4 6 8 10 1 10 2 10 3 10 4 10 π e K p p (GeV/c) -1 10 × 3 1 2 3 4 5 6 7 8 TRD electron likelihood 0 0.1 0.2 0.3 0.4 0.5 0.6 0.7 0.8 0.9 1 1 10 2 10 3 10 4 10 h e
After TOF PID Number of tracklets = 6 p (GeV/c) -1 10 × 3 1 2 3 4 5 6 7 8 ) σ ( el TPC dE/dx - <TPC dE/dx>| -10 -8 -6 -4 -2 0 2 4 -1 10 1 10 π e
After TOF and TRD PID Number of Tracklets = 6 80% electron efficiency = 7 TeV s pp, p (GeV/c) -1 10 × 3 1 2 3 4 5 6 7 8 TRD electron likelihood 0.86 0.88 0.9 0.92 0.94 0.96 0.98 1 1 10 2 10
After TOF PID Number of tracklets = 6 80% electron efficiency
Fig. 3: (Colour online) Electron selection with the TOF, TRD, and TPC detectors. The difference be-tween measured and expected time-of-flight is shown in the upper left panel. Lines indicate the selection band. For tracks selected by TOF, the TRD electron likelihood distribution for tracks with 6 TRD track-lets is shown in the upper right panel. The lower right panel displays the TRD electron likelihood distri-bution for tracks with an electron efficiency of 80% in the TRD (note the compressed scale on the vertical axis). For tracks passing the TRD selection, the TPC dE/dx, expressed in units of the dE/dx resolution (σTPC−dE/dx) is shown in the lower left panel. Lines indicate the electron selection band. The
parameter-isation of the expected energy loss of electrons in this data period, and the specific selection criteria of this analysis are such that the mean (width) of the electron dE/dx distribution is not exactly zero (one). Therefore, the selection band is slightly shifted from the nominal values of 0 and 3 σTPC−dE/dx.
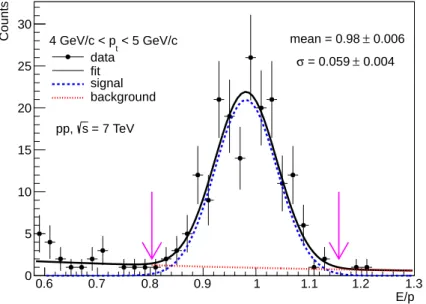
tracks, the ratio E/p of the energy deposited in the EMCal and the measured momentum was calculated to identify electrons. The distribution of E/p is shown in Fig. 4 for tracks with transverse momenta in the range 4 < pt< 5 GeV/c. Electrons deposit their total energy in the EMCal and, due to their small
mass, the ratio E/p should be equal to unity. Therefore, the peak around one in Fig. 4 confirms the good pre-selection of electron candidate tracks using the TPC. The exact shape of the E/p distribution depends on the EMCal response, Bremsstrahlung in the material crossed by electrons along their trajectory, and the remaining background from charged hadrons. The E/p distribution was fitted with the sum of a Gaussian and an exponential function. Electron candidates were required to have E/p between −3 and +3 σE/p of the E/p distribution, where σE/p is the width of the fitted Gaussian function. Due to the
loose ITS cuts, the TPC-EMCal analysis suffers from a large background from photon conversions and, consequently, a small signal to background ratio for electrons from heavy-flavour hadron decays at low pt. Therefore, the pt range was limited to pt> 3 GeV/c, where a significant heavy-flavour signal could
E/p 0.6 0.7 0.8 0.9 1 1.1 1.2 1.3 Counts 0 5 10 15 20 25 30 < 5 GeV/c t 4 GeV/c < p data fit signal background 0.006 ± mean = 0.98 0.004 ± = 0.059 σ = 7 TeV s pp,
Fig. 4: (Colour online) Ratio E/p of the energy deposit in the EMCal and the measured momentum for charged particle tracks in the range 4 < pt< 5 GeV/c. The distribution was fitted with the sum of
a Gaussian for the electron signal and an exponential for the remaining hadron background. Arrows indicate the selection window for electron candidates.
Table 2: Overview over the hadron contamination subtracted in the inclusive electron spectrum for the three analysis strategies.
Analysis TPC-TOF TPC-TRD-TOF TPC-EMCal
ptrange (GeV/c) 0.5 – 4 4 – 8 3 – 7
Hadron contamination (%) ≤ 1 ≤ 2 7±4 (sys)
3.5 Hadron contamination
The residual hadron contamination, after the electron identification cuts, was estimated by fitting the measured detector signal distributions with functions modelling the background and signal contributions. The hadron contamination is summarised in Table 2 for the three analysis strategies.
3.5.1 TPC-TOF/TPC-TRD-TOF analysis
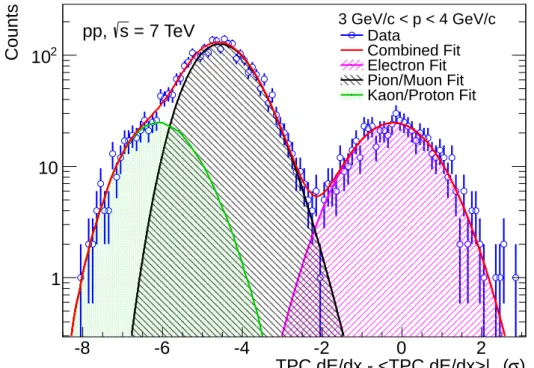
For the TPC-TOF/TPC-TRD-TOF analysis, the TPC dE/dx distribution after TOF- and TRD-PID cuts was fitted in momentum slices. The residual contamination to the electron sample is given by the con-tribution of misidentified charged particles after the cut on the TPC dE/dx. The cut on the TPC dE/dx applied for electrons was chosen to have 50% efficiency for all momenta. The electron line was pa-rameterised using a Gaussian function, which describes well the shape of the TPC dE/dx distribution, expressed as deviation from the parameterised electron Bethe-Bloch line normalised by the energy loss resolution, for a given particle species close to the maximum of this distribution. The dominant contri-bution to the contamination of the electron candidate sample at momenta above 1 GeV/c comes from the tail of the pion dE/dx distribution. This tail is not adequately described by a Gaussian for the purpose of an estimation of the contamination. A better description of the tail of the pion dE/dx distribution is obtained by multiplying a Landau distribution with an exponential term. The validity of this approach was confirmed using a clean pion sample from K0Sdecays which was selected using the V0-finder and
) σ ( el TPC dE/dx - <TPC dE/dx>| -8 -6 -4 -2 0 2 Counts 1 10 2 10 3 GeV/c < p < 4 GeV/c Data Combined Fit Electron Fit Pion/Muon Fit Kaon/Proton Fit = 7 TeV s pp,
Fig. 5: (Colour online): The specific energy loss distribution measured with the TPC in the momentum range 3 < p < 4 GeV/c (histogram) is compared to the sum of functions describing the contributions from different particle species. Data and fit agree within statistical uncertainties.
tagged using topological cuts [51]. At low momenta, protons and kaons are suppressed by the eID cut applied using the TOF detector, while at higher momenta the kaon and proton dE/dx lines approach each other. Therefore, a single slightly skewed Gaussian distribution was used to fit the combined contribution of both particle types. The contribution of muons was fitted jointly with that of the pions.
The combined fit of the TPC dE/dx distribution in the momentum range 3 < p < 4 GeV/c is shown in Fig. 5. To demonstrate that the fit does not introduce any additional systematic uncertainty, the difference between data and fit was compared with the expected statistical fluctuations. The fit is in good agreement with the data within statistical uncertainties.
The relative contamination was calculated as the ratio of the fitted background contribution to the overall distribution after the TPC dE/dx cut. The contamination remained insignificant (below 2%) up to a momentum of 8 GeV/c, and it was subtracted from the electron candidate sample in the TPC-TOF/TPC-TRD-TOF analysis.
3.5.2 TPC-EMCal analysis
For the TPC-EMCal analysis, the hadron contamination in the electron candidate sample was estimated based on fits to the E/p distribution in momentum slices with a function describing the signal (Gaussian for E/p ∼ 1) and background (exponent) as shown in Fig. 4. Furthermore, the contamination has been constrained with the ratio of the integrals of the E/p distribution in two intervals: µE/pto µE/p+ n · σE/p
and µE/p− n · σE/pto µE/pfor n = 3, where µ, σ are the parameters of the Gaussian and µE/pis the mean
of the distribution. This ratio is sensitive to the amount of background in the measured E/p and its evolu-tion has been studied by varying n between 1 and 3. Based on these estimates the hadron contaminaevolu-tion in the electron candidate sample was determined to be (7±4)% in the range 3 < pt< 7 GeV/c, and it was
3.6 Corrections and normalization
Corrections were applied to the electron candidate spectra for the geometrical acceptance of the detectors (εgeo), the reconstruction efficiency (εreco), and the electron identification efficiency (εeID).
(GeV/c) t p 1 2 3 4 5 6 7 8 eID ∈× reco ∈× geo ∈ 0 0.05 0.1 0.15 0.2 0.25 0.3 0.35 0.4
TPC-TOF analysis, |y|<0.5 TPC-EMCal analysis, |y|<0.6
TPC-TRD-TOF analysis, 6 tracklets only, |y|<0.5
Geometrical acceptances are 38% for TRD and 11% for EMCal
= 7 TeV s
pp,
Fig. 6: (Colour online) Acceptance, tracking, and particle identification efficiency for electrons at mid-rapidity in pp collisions at 7 TeV for the TPC-TOF/TPC-TRD-TOF and the TPC-EMCal analysis. For transverse momenta below 4 GeV/c the TRD was not used for eID. The total reconstruction efficiency for electrons with the TPC-TRD-TOF eID approach is shown for the requirement of 6 tracklets in the TRD as an example.
Due to the finite azimuthal angle covered by the TRD and the EMCal detectors in the 2010 run, the max-imum geometrical acceptance was 38% for the TPC-TRD-TOF analysis and 11% for the TPC-EMCal analysis. The geometrical acceptance and reconstruction efficiency were computed from a full numerical Monte Carlo simulation of the experiment. Monte Carlo events were produced by the PYTHIA 6.4.21 event generator [52] using the Perugia-0 parameter tuning [53] with the same primary vertex distribution as in the data. The generated particles were propagated through the apparatus using GEANT3 [54]. The same reconstruction algorithms and cuts were used as for the analysis of data. For the calculation of εgeoand εrecoin the TPC-TOF/TPC-TRD-TOF analysis, which requires a hit in the first SPD layer, only those electrons were considered in the simulation which were produced within 3 cm distance from the interaction vertex in the transverse direction and which were reconstructed in the pseudorapidity range |η| < 0.5. For the TPC-EMCal analysis, which requires a hit in any of the two SPD layers, electrons produced within 7 cm transverse distance from the vertex and with |η| < 0.6 were considered for the calculation of εgeoand εreco.
The evaluation of the electron transverse momentum is affected by the finite momentum resolution and by the electron energy loss due to Bremsstrahlung in the material in front of and in the tracking detectors, where the dominant contribution is from the ITS (X /X0= 7.18% at η = 0 [34]). These effects distort
the shape of the pt distribution, which falls steeply with increasing momentum, and have to be taken
into account. The necessary correction grows with increasing steepness of the pt distribution and with
increasing widths of the pt bins. To determine this correction, an unfolding procedure based on Bayes’
(GeV/c) t p 1 2 3 4 5 6 |<0.5 η , | TRD reco ∈× TRD geo∈ 0 0.1 0.2 0.3 0.4 0.5 0.6 0.7 Data MC (GeV/c) t p 1 2 3 4 5 6 |<0.5 η : Data/MC, | TRD reco ∈× TRD geo ∈ 0.5 0.6 0.7 0.8 0.9 1 1.1 1.2 1.3 1.4 1.5 (GeV/c) t p 1 2 3 4 5 6 |<0.5 η , | T O F eID ∈× T O F reco ∈× T O F geo∈ 0.5 0.6 0.7 0.8 0.9 1 1.1 1.2 Data MC (GeV/c) t p 1 2 3 4 5 6 |<0.5 η : Data/MC, | T O F eID ∈× T O F reco ∈× T O F geo∈ 0.5 0.6 0.7 0.8 0.9 1 1.1 1.2 1.3 1.4 1.5 = 7 TeV s pp,
Fig. 7: (Colour online) Acceptance, tracking, and particle identification efficiencies are compared in data and in simulation for electrons from photon conversions in material. Upper panel: TRD acceptance times tracking efficiency (at least five reconstructed tracklets were required for this example). For transverse momenta below 4 GeV/c the TRD was not used for eID. Lower panel: TOF matching efficiency times particle identification efficiency.
of electrons were used to obtain a smearing matrix. A detailed description of the procedure can be found elsewhere [55]. The maximum unfolding correction of the measured electron yield was ≈ 20% at pt= 2 GeV/c, becoming smaller towards higher pt.
The product of the overall acceptance and efficiency (εgeo× εreco× εeID) as function of p
tfor the
TPC-TOF/TPC-TRD-TOF analysis as well as the overall efficiency for the TPC-EMCal analysis are shown in Figure 6.
To cross check the value of the acceptance times efficiency calculated via the simulation and to determine TRD PID efficiencies, a data-driven method was employed. A pure sample of electrons from photon con-versions in the detector material was selected. Reconstructed conversion electron vertices were selected using the V0-finder [51]. The same cuts as in the analysis were applied to the pure electron sample except for the requirements in the ITS which were relaxed such that the electron candidates needed to have only two hits in the ITS, from which at least one is required to be in any of the two pixel layers. The cross-check was done in the momentum range where the sample of electrons from photon conversions is statistically significant (up to 6 GeV/c). The good agreement of the TRD acceptance and tracking efficiency (εTRDgeo × εreco
TRD) for electrons from conversions in data and in the simulation, which have at
least five TRD tracklets, is demonstrated in Fig. 7. The TOF tracking and PID efficiency after the TRD requirement (εTOFgeo × εreco
TOF× εTOFeID) is also well reproduced in the simulations (see Fig. 7).
For the TPC-EMCal analysis, the electron identification efficiency from the TPC dE/dx cut was estimated using the data driven method. Particles were selected with a dE/dx in the range between −1.5 and 3 σTPC−dE/dx. The corresponding efficiency was about 93% with respect to the full distribution. The
efficiency of the electron identification with EMCal, i.e. track matching and eID employing the E/p cut, was estimated using the simulation.
The pt-differential invariant yield Ne
±
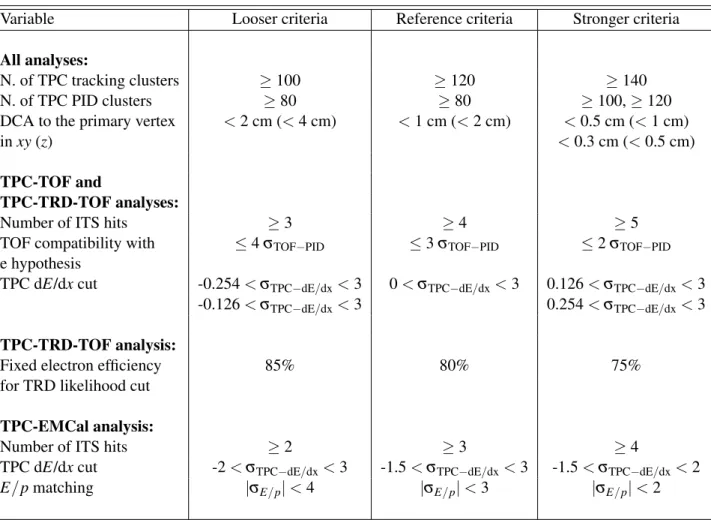
cor-Table 3: Variation of the electron selection criteria to estimate the systematic uncertainties due to track reconstruction and particle identification.
Variable Looser criteria Reference criteria Stronger criteria
All analyses:
N. of TPC tracking clusters ≥ 100 ≥ 120 ≥ 140
N. of TPC PID clusters ≥ 80 ≥ 80 ≥ 100, ≥ 120
DCA to the primary vertex < 2 cm (< 4 cm) < 1 cm (< 2 cm) < 0.5 cm (< 1 cm)
in xy (z) < 0.3 cm (< 0.5 cm)
TPC-TOF and
TPC-TRD-TOF analyses:
Number of ITS hits ≥ 3 ≥ 4 ≥ 5
TOF compatibility with ≤ 4 σTOF−PID ≤ 3 σTOF−PID ≤ 2 σTOF−PID
e hypothesis
TPC dE/dx cut -0.254 < σTPC−dE/dx< 3 0 < σTPC−dE/dx< 3 0.126 < σTPC−dE/dx< 3
-0.126 < σTPC−dE/dx< 3 0.254 < σTPC−dE/dx< 3
TPC-TRD-TOF analysis:
Fixed electron efficiency 85% 80% 75%
for TRD likelihood cut TPC-EMCal analysis:
Number of ITS hits ≥ 2 ≥ 3 ≥ 4
TPC dE/dx cut -2 < σTPC−dE/dx< 3 -1.5 < σTPC−dE/dx< 3 -1.5 < σTPC−dE/dx< 2
E/p matching |σE/p| < 4 |σE/p| < 3 |σE/p| < 2
rected electron ptspectrum and the number NMBof minimum bias pp collisions as:
1 2π pt d2Ne± dptdy =1 2 1 2π pcentret 1 ∆y∆ pt Nrawe±(pt)
(εgeo× εreco× εeID)
1 NMB
, (1)
where pcentret are the centres of the pt bins with widths ∆pt chosen here, and ∆y is the width of the
rapidity interval covered. In the following, invariant yields or cross sections within a given pt bin are
always quoted at the bin centre without a bin-shift correction for the fact that the electron yield decreases with increasing pt. When ratios of yields or cross sections are calculated the same pt bins are used for
both the numerator and the denominator and average yields or cross sections are used for every individual pt bin to avoid bin-shift effects.
3.7 Systematic uncertainties 3.7.1 TPC-TOF-TRD analysis
The following sources of systematic uncertainties were considered: the corrections of the ITS, TPC, TOF, and TRD tracking efficiencies, the TOF, TPC, and TRD particle identification efficiencies, the pt
unfolding procedure, and the absolute normalisation.
To estimate the contributions from tracking and particle identification, the analysis was repeated with modified selection criteria as summarised in Table 3.
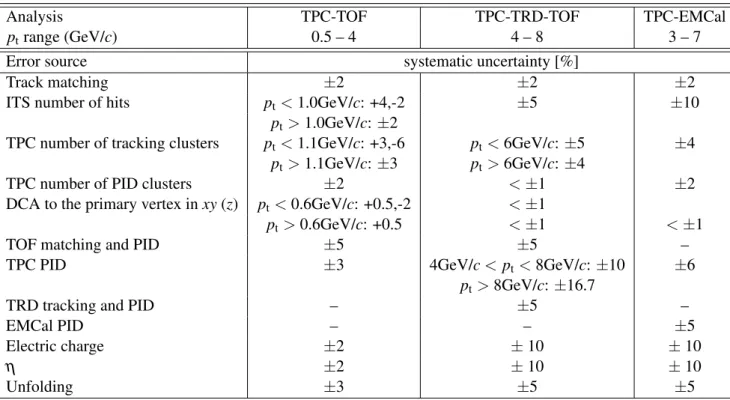
Table 4: Overview over the contributions to the systematic uncertainties on the inclusive electron spec-trum for the three analysis strategies.
Analysis TPC-TOF TPC-TRD-TOF TPC-EMCal
pt range (GeV/c) 0.5 – 4 4 – 8 3 – 7
Error source systematic uncertainty [%]
Track matching ±2 ±2 ±2
ITS number of hits pt< 1.0GeV/c: +4,-2 ±5 ±10
pt> 1.0GeV/c: ±2
TPC number of tracking clusters pt< 1.1GeV/c: +3,-6 pt< 6GeV/c: ±5 ±4
pt> 1.1GeV/c: ±3 pt> 6GeV/c: ±4
TPC number of PID clusters ±2 < ±1 ±2
DCA to the primary vertex in xy (z) pt< 0.6GeV/c: +0.5,-2 < ±1
pt > 0.6GeV/c: +0.5 < ±1 < ±1
TOF matching and PID ±5 ±5 –
TPC PID ±3 4GeV/c < pt < 8GeV/c: ±10 ±6
pt > 8GeV/c: ±16.7
TRD tracking and PID – ±5 –
EMCal PID – – ±5
Electric charge ±2 ± 10 ± 10
η ±2 ± 10 ± 10
Unfolding ±3 ±5 ±5
For each variation of the selection criteria, the inclusive electron spectra were fully corrected. The resulting spectra were compared by inspecting their ratio. As function of pt, these ratios define the
relative systematic uncertainties as listed in Table 4. A general systematic uncertainty of 2%, due to the ITS-TPC track matching efficiency, was taken from dedicated tracking investigations. It is important to note that for each cut related to the particle identification the hadron contamination may change and has to be re-evaluated.
In addition, the corrected spectra of positrons and electrons, as well as the corrected spectra obtained in the positive (η+) and negative η (η−) range, were compared. Deviations from the expected ratios e+/e−= 1 and η+/η−= 1 were taken into account in the systematics.
The systematic uncertainty related to the MC pt-distribution used for the corrections, named
”unfold-ing” in Table 4, was extracted from the comparison of the data corrected with two different Monte Carlo samples. In addition to the PYTHIA 6.4.21 based sample, used already for the evaluation of the geomet-rical acceptance and the reconstruction efficiency (see Sec. 3.6), a second PYTHIA based sample with artificially enhanced heavy-flavour hadron yields was employed.
Up to electron transverse momenta of 4 GeV/c the electron identification was based on the TPC-TOF selection only. For higher momenta the TRD selection was included. Therefore, the TRD contribution to the systematic uncertainties was only considered for the part of the spectrum above 4 GeV/c.
The systematic uncertainties are summarised in Table 4. The systematic uncertainty of the DCA cuts increases at low pt, where the DCA resolution decreases and electrons from photon conversion in the
material do not point to the primary vertex. The total systematic uncertainty is calculated as the quadratic sum of all contributions and it is of the order of 8.5% for the TPC-TOF and between 20% and 26% for the TPC-TRD-TOF parts of the spectrum, respectively.
3.7.2 TPC-EMCal analysis
Systematic uncertainties from the electron identification on the inclusive electron spectrum obtained with the TPC-EMCal approach arise from the dE/dx measured in the TPC and the E/p matching. The uncer-tainties were estimated by measuring the spectra with changing cuts on dE/dx and E/p. The variation of the cuts are summarised in Table 3. The resulting uncertainty of the electron identification is 5% from the E/p matching, which includes the subtraction of contamination, and 6% from the dE/dx selection. The systematic uncertainties due to the track selection were estimated by applying the same variation of cuts as for the TPC-TOF/TPC-TRD-TOF analysis, except for the ITS cut. The individual contributions are summarised in Table 4. The total systematic uncertainty is approximately 20% on the inclusive electron spectrum.
3.8 Inclusive invariant pt-differential electron yield
The electron yield per minimum bias pp collision was measured as function of pt. The hadron
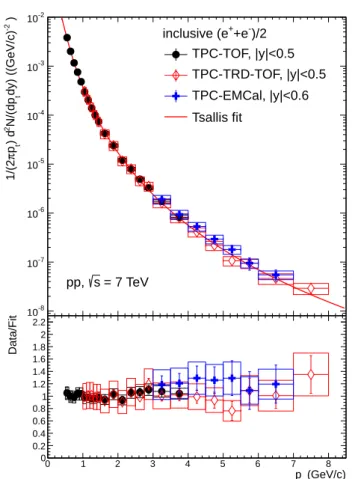
contami-nation was subtracted statistically from the spectrum and corrections for acceptance, reconstruction, and electron identification efficiency were applied. The corrected inclusive electron spectra measured with the TPC-TOF and TPC-TRD-TOF analyses are shown in the upper panel of Fig. 8. The spectra were pa-rameterised simultaneously using a Tsallis function as depicted in Fig. 8. The results from both analyses agree well in the pt region between 1 and 4 GeV/c as demonstrated in the lower panel of Fig. 8, which
shows the ratios of the data to the common fit on a linear scale. However, the systematic uncertainties in the TPC-TOF analysis are substantially smaller than in the TPC-TRD-TOF analysis. Therefore, for the combined TPC-TOF/TPC-TRD-TOF inclusive yield the TPC-TOF result is used for pt< 4 GeV/c.
The extension towards higher ptis given by the TPC-TRD-TOF measurement. The corresponding result
employing the TPC-EMCal eID is also depicted in Fig. 8. Since the relevant material budget was not the same for the two approaches the contribution from photon conversions is different and, hence, the inclusive electron yield is larger for the TPC-EMCal analysis than for the TPC-TOF/TPC-TRD-TOF analysis.
3.9 Electron background cocktail
The inclusive electron spectrum can be subdivided into five components:
1. signal heavy-flavour electrons, i.e. electrons from semileptonic decays of hadrons carrying a charm or beauty quark or antiquark,
2. background electrons from Dalitz decays of light neutral mesons and from the conversion of decay photons in the material in the detector acceptance,
3. background electrons from weak K → eπν (Ke3) decays and dielectron decays of light vector
mesons,
4. background electrons from dielectron decays of heavy quarkonia (J/ψ, ϒ),
5. background electrons originating from partonic hard scattering processes. This includes electrons from the Drell-Yan process and electrons related to the production of prompt photons, i.e. both virtual prompt photons (electron-positron pairs) as well as real prompt photons which can convert in the material of the detector.
Of the background contributions listed above, the first one (Dalitz electrons and photon conversions in material) is the largest in electron yield. Towards high electron pt, contributions from hard scattering
processes (prompt photons, decays of heavy-quarkonia, and Drell-Yan processes) are important and will, eventually, become dominant.
(GeV/c) t p 0 1 2 3 4 5 6 7 8 ) -2 dy) ((GeV/c)t N/(dp 2 ) dt p π 1/(2 -8 10 -7 10 -6 10 -5 10 -4 10 -3 10 -2 10 )/2 -+e + inclusive (e TPC-TOF, |y|<0.5 TPC-TRD-TOF, |y|<0.5 TPC-EMCal, |y|<0.6 Tsallis fit = 7 TeV s pp, (GeV/c) t p 0 1 2 3 4 5 6 7 8 Data/Fit 0 0.2 0.4 0.6 0.8 1 1.2 1.4 1.6 1.8 2 2.2
Fig. 8: (Colour online) Inclusive electron yield per minimum bias collision as function of pt measured
at mid-rapidity showing the TPC-TOF, TPC-TRD-TOF, and TPC-EMCal results, respectively, in pp col-lisions at√s= 7 TeV. The TPC-TOF and TPC-TRD-TOF spectra have been parameterised simultane-ously using a Tsallis function (upper panel). The ratio of the measured spectra to the Tsallis fit is shown in the lower panel. Statistical uncertainties are indicated by error bars, while systematic uncertainties are shown as boxes.
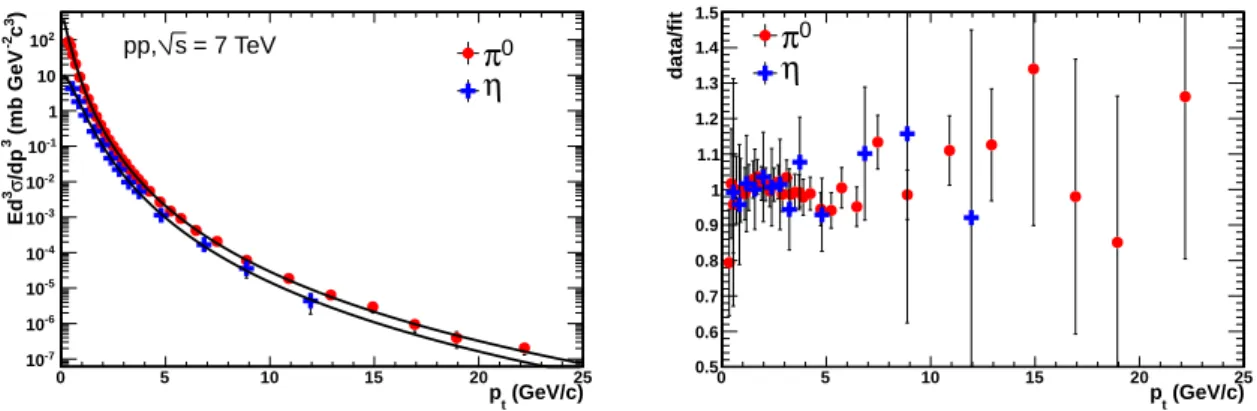
(GeV/c) t p 0 5 10 15 20 25 ) 3 c -2 (mb GeV 3 /dp σ 3 Ed -7 10 -6 10 -5 10 -4 10 -3 10 -2 10 -1 10 1 10 2 10 pp, s = 7 TeV 0 π η (GeV/c) t p 0 5 10 15 20 25 data/fit 0.5 0.6 0.7 0.8 0.9 1 1.1 1.2 1.3 1.4 1.5 0 π η
Fig. 9: (Colour online) Invariant differential production cross sections for neutral pions and η mesons in pp collision at√s= 7 TeV as function of pt [56] together with fits using Eq. 2 (left panel). Ratios of
the measured π0and η spectra to the fits (right panel). In both panels the error bars depict the combined statistical and systematic uncertainties of the neutral meson data.
The signal of electrons from heavy-flavour decays is small compared to the background at low ptbut rises
with increasing pt as will be shown in Section 4 (Fig. 10). One technique to extract the heavy-flavour
signal from the inclusive electron spectrum is the so-called “cocktail subtraction” method described in detail here. In this approach, a cocktail of electrons from different background sources was calculated using a Monte Carlo hadron-decay generator which, by construction, produces identical spectra for de-cay positrons and electrons. The resulting background spectra were then subtracted from the inclusive electron spectrum. This approach relies on the availability of the momentum distributions of the relevant background sources.
The most important background source is the neutral pion. The contribution from π0 decays to the background is twofold. First, the Dalitz decay of neutral pions (π0→ e+e−
γ , with a branching ratio BR of 1.174 ± 0.035% [11]) is a primary source of electrons from the collision vertex. Second, photons from the decay π0→ γγ (BR = 98.823 ± 0.034% [11]) can convert in material into e+e−pairs in the ALICE
acceptance. This process gives rise to a secondary source of electrons not originating from the collision vertex. It is important to point out that, although the total material budget in the ALICE central barrel acceptance is relatively large (11.4 ± 0.5% of a radiation length X0 integrated over a radial distance up
to 180 cm from the beam line in the range |η| < 0.9) [36], the material budget relevant for the present analysis is much less (see below). In fact, electron candidate tracks considered here are required to be associated with either a hit in the first pixel layer of the ALICE ITS in case of the TPC-TOF/TPC-TRD-TOF analysis or a hit in any of the two pixel layers in the TPC-EMCal analysis. Therefore, only conversions in the beam pipe and in a fraction of the ITS material are relevant here. Consequently, the background contribution from photon conversions is similar to the contribution from Dalitz decays (see below for a detailed calculation).
The rapidity distribution of mesons is assumed to be flat around mid-rapidity. The momentum distri-butions of π0 and η mesons are obtained via fitting the spectra as measured by the ALICE collabora-tion [56]. In this measurement, π0 and η decays in the γγ channel are reconstructed using two com-plementary techniques. As it is done conventionally, in the first approach the two decay photons are measured via electromagnetic calorimetry. This technique becomes notoriously difficult at low photon energy and, consequently, low meson pt. In this region, it becomes advantageous to reconstruct photons
in a second approach via the conversion into e+e− pairs in the detector acceptance. The large accep-tance, high resolution ALICE TPC is ideally suited to perform such a measurement, which extends the π0 spectrum down to 300 MeV/c. Combining the measurements via calorimetry and the reconstruction of photon conversions, the π0 and η transverse momentum spectra from pp collisions at√s= 7 TeV
Table 5: Fit parameters of the Tsallis parameterisation (see Eq. 2) of the differential cross section of π0 and η meson production.
Meson dN/dy T (MeV) n
π0 2.40 ± 0.15 139 ± 4 6.88 ± 0.07 η 0.21 ± 0.03 229 ± 21 7.0 ± 0.5
Table 6: Ratios of meson yields to neutral pion yields at pt= 5 GeV/c in pp collisions at
√ s= 7 TeV. ρ /π0= 1.0 ± 0.3 [11] ω /π0= 0.85 ± 0.255 [11, 58] η0/π0= 0.25 ± 0.075 [11] φ /π0= 0.40 ± 0.12 [11, 59]
were measured by ALICE over a wide ptrange [56].
The invariant differential cross section of π0 and η meson production in pp collisions at√s= 7 GeV was parameterised with a Tsallis function [57] given by:
Ed 3 σ dp3 = σpp 2π dN dy (n − 1)(n − 2) nT(nT + m(n − 2))(1 + (mt− m)/(nT )) −n , (2)
where the parameters dN/dy, T , and n were obtained by fitting the experimental data as shown in Fig. 9, σppis the inelastic pp cross section, m is the relevant meson’s mass and mtis the corresponding transverse
mass mt=
p
m2+ p2
t. The values of the fit parameters are listed in Table 5.
Given that pion decays and the corresponding conversion of decay photons are the most important cock-tail ingredient up to intermediate pt, the systematic uncertainty of the background cocktail is dominated
by the uncertainty of the pion input. To evaluate this uncertainty the measured differential pion cross section was moved up (down) in all pt bins by the individual uncertainties in the bins, the
parameteri-zation according to Eq. 2 was repeated, and full cocktails were generated with these upper (lower) pion spectra as input. Thus, the uncertainty of the pion input was propagated to the electron cocktail. The same approach was followed for the η meson.
Other light mesons (ρ, ω, η0, and φ ) contribute to the background electron cocktail through their Dalitz and/or dielectron decay channels as well as through the conversion of photons from their decays. How-ever, none of the contributions from these mesons is of any practical importance compared to the pion and the η meson. For the cocktail calculation, the shape of the invariant pt distributions and the
rela-tive normalisations to the π0are required as input parameters for the heavier mesons. The shape of the pt spectra was derived from the pion spectrum assuming mt scaling, i.e. the spectral shapes of heavier
mesons and pions were consistent as a function of mt. Since the mtscaling approach ensures that, at high
pt, the spectral shapes of all meson distributions are the same, the normalisation of the heavier meson
spectra relative to the pion spectrum was determined by the ratios of heavier meson yields to neutral pion yields at high pt(5 GeV/c in the present analysis). The values used are summarised in Table 6. The
quoted systematic uncertainties correspond to conservative estimates of 30% on all meson-to-pion ratios, which were propagated to the corresponding contributions to the background electron spectrum.
A precise knowledge of the material budget is important for the calculation of the electron spectrum from photon conversions. An analysis of the reconstruction of photon conversions in ALICE demonstrated that the material budget implemented in the Monte Carlo simulation is in agreement within an uncertainty
of 4.5% with the actual material budget of the experiment [36]. Since, for the present analysis, electron candidate tracks were required to be associated with a hit in the SPD, only the beam pipe, air, and a fraction of the ITS material contributed to the effective converter thickness. The beam pipe is made out of beryllium with a polyimide wrapping and its thickness in terms of radiation lengths is X /X0= 0.26%.
The corresponding thickness of a pixel layer is X /X0= 1.14% for the full layer, including the sensor, the
readout chip, and the infrastructure [34]. The construction of the first pixel layer is such that the active sensor layer is closer to the beam line than the readout and most of the infrastructure, i.e. conversions in the latter do not give rise to a recorded hit in this detector. In the second pixel layer, the order is reversed, i.e. the readout and most of the infrastructure are closer to the beam line than the sensor itself. Therefore, for the TPC-EMCal analysis, the thickness of most of both pixel layers had to be considered in the calcu-lation of the electron background from photon conversions. Including an overall systematic uncertainty of 4.5% on the material budget [36], the resulting converter thickness was X /X0= (2.15 ± 0.11)%,
in-cluding the beam pipe and air, for photons impinging perpendicularly on the beam pipe and the ITS, i.e. for photons at η = 0. For the TPC-TOF/TPC-TRD-TOF analysis only a fraction of the first pixel layer was relevant in addition to the beam pipe and air. For the latter case, from the known material budget and from full Monte Carlo simulations of photon conversions in the pixel detector the effective thickness of the first pixel layer was determined to be (45 ± 5)% of its total thickness. Including the beam pipe and air, the effective converter thickness was X /X0= (0.77 ± 0.07)% at η = 0. The geometric η dependence
of the material budget was taken into account in the calculation of the photon conversion contribution in the electron background cocktail.
The ratio of conversion electrons to Dalitz electrons for π0decays was calculated as
Conversion Dalitz = BRγ γ× 2 × (1 − e−79× X X0) × 2 BRDalitz× 2 , (3)
where BRγ γ and BRDalitz are the branching ratios into the two-photon and Dalitz channels, respectively.
For the TPC-TOF/TPC-TRD-TOF analysis, with X /X0= (0.77 ± 0.07)%, this ratio Conversion/Dalitz
is equal to 1.01 ± 0.09. Due to the larger material budget relevant for the TPC-EMCal analysis, which is X/X0= (2.15 ± 0.11)%, the relative contribution from photon conversions to Dalitz decays was larger:
Conversion/Dalitz = 2.79 ± 0.14. For the decays of other light mesons the ratio is slightly smaller than for neutral pions due to the fact that BRDalitz/BRγ γ increases with increasing parent meson mass.
In addition, it was taken into account that the photon conversion probability is not constant but depends slightly on the photon energy, introducing a pt dependence of the ratio Conversion/Dalitz, which was
determined in a full Monte Carlo simulation. The corresponding correction was applied in the calculation of the conversion contribution to the background electron cocktail. However, this correction is significant only for low momentum electrons (0.5 < pt< 1 GeV/c), where the ratio Conversion/Dalitz is reduced
by 10% or less relative to its asymptotic value given in Eq. 3.
The contribution from weak Ke3 decays of charged and neutral kaons can only be determined via
sim-ulations, which take into account the geometry of the experimental apparatus, the reconstruction algo-rithms, and the electron identification cuts. It turned out that the contribution from Ke3 decays to the
inclusive electron spectrum was essentially negligible. This was due to the fact that electron candidates considered in the present analysis were required to be associated with a hit in the first pixel layer of the ALICE ITS. Since this detector layer is close to the primary collision vertex (3.9 cm radial distance from the beam line) and because of the rather long life time of the relevant kaons (cτ(K±) = 3.712 m, cτ(K0L) = 15.34 m [11]), only a tiny fraction of Ke3decays contributed to the background electron
sam-ple. For electrons with pt= 0.5 GeV/c the relative contribution from Ke3decays to the inclusive electron
background was not more than 0.5%. For pt= 1 GeV/c this contribution decreased to ≈0.2% and
Table 7: Overview over the contributions to the systematic uncertainties of the background cocktail. The contributions from mesons heavier than the η meson and the contribution from Ke3 decays to the
systematic uncertainty are less than 1% and, therefore, are not listed explicitly. For details on the error determination, see text.
pt(GeV/c) 0.5 2 8
Error source systematic uncertainty (%)
π0spectrum ±8 ±4 ±8
γ conversions ±4 ±4 ±3
η spectrum ±1 ±1 ±4
prompt photons < ±1 < ±1 ±4
total ±9 ±6 ±10
systematic uncertainty of 100% is assigned to the Ke3contribution.
Electrons from the electromagnetic decays of heavy quarkonia have been added to the background elec-tron cocktail based on measurements at the LHC. J/ψ production has been measured at mid-rapidity in pp collisions at 7 TeV by the ALICE [60, 61] and CMS experiments [26]. A parameterisation of these data, obtained by a simultaneous fit according to Eq. 2 was used as input for the cocktail generator. ϒ pro-duction at mid-rapidity has been measured by the CMS experiment [62]. As for the J/ψ, the propro-duction cross section was parametrised and the decay contribution was included in the electron cocktail. While the contribution from J/ψ decays becomes relevant at high pt, the ϒ contribution is negligible for the
electron cocktail in the current ptrange. While the systematic uncertainties of the measured production
cross sections of heavy quarkonia were directly propagated to the corresponding decay electron spectra, their contribution to the systematic uncertainty of the latter is less than 1%.
Contributions to the background electron cocktail from prompt photons are twofold. Real photons pro-duced in initial hard scattering processes, e.g. via quark-gluon Compton scattering, can convert in the detector material just as photons from meson decays. In addition, every source of real photons also emit virtual photons, i.e. electron-positron pairs. The spectrum of real prompt photons from an NLO pQCD calculation [63–65] using CTEQ6M5 parton distribution functions [66] with GRV parton to photon frag-mentation functions [67,68] was parameterised, and the corresponding conversion electron spectrum was added to the background electron cocktail. The ratio of virtual prompt photons to real prompt photons increases with increasing pt because the phase space for dielectron emission increases [69]. This has
been taken into account in the calculation of the corresponding contribution to the background electron cocktail. Prompt photon production has not been measured in ALICE yet. Measurements at lower colli-sion energy are in agreement with NLO pQCD calculations within uncertainties of significantly less than 50% at high pt [70]. Conservatively, a systematic uncertainty of 50% was assigned to the contribution
from prompt photons to the total background electron cocktail.
Contributions from the Drell-Yan process are expected to be small in the ptrange covered by the present
analysis and, therefore, they were not included in the background electron cocktail.
To calculate the systematic uncertainty of the cocktails, the systematic uncertainties of all uncorrelated cocktail ingredients were estimated as discussed above, propagated to the corresponding electron spectra, and added in quadrature. The cocktail systematic uncertainties are smallest in the pt range between 1
and 2 GeV/c. The individual contributions and their dependence on ptare summarised in Table 7, where
error sources with less than 1% systematic uncertainty are not listed.
The total background cocktail electron cross sections were divided by the minimum bias pp cross section 62.2 ± 2.2(sys.) mb [71] (see below) such that they can be directly compared to the measured inclusive electron yields per minimum bias triggered collision. These comparisons are shown in Fig. 10 for the
TPC-TOF/TPC-TRD-TOF analysis (left panel) and the TPC-EMCal analysis (right panel).
4 Results and discussion
(GeV/c) t p 0 1 2 3 4 5 6 7 8 ) -2 dy) ((GeV/c)t N/(dp 2 ) dt p π 1/(2 -10 10 -9 10 -8 10 -7 10 -6 10 -5 10 -4 10 -3 10 -2 10 -1 10 -1 Ldt = 2.6 nb
∫
= 7 TeV, s pp, 0 π conv. of γmeson η η' ρ ω φ J/Ψ ϒ γ* , γ direct e3 K TPC-TOF/TPC-TRD-TOF )/2, |y| < 0.5 -+e + (e background cocktail (GeV/c) t p 0 1 2 3 4 5 6 7 8inclusive electrons / background cocktail 0 1 2 3 4 5 6 7 8 9
cocktail systematic uncertainty inclusive electron systematic uncertainty total systematic uncertainty
(GeV/c) t p 0 1 2 3 4 5 6 7 8 ) -2 dy) ((GeV/c)t N/(dp 2 ) dt p π 1/(2 -10 10 -9 10 -8 10 -7 10 -6 10 -5 10 -4 10 -3 10 -2 10 -1 10 -1 Ldt = 2.1 nb
∫
= 7 TeV, s pp, 0 π conv. of γmeson η η' ρ ω φ J/Ψ ϒ γ* , γ direct e3 K TPC-EMCal )/2, |y| < 0.6 -+e + (e background cocktail (GeV/c) t p 0 1 2 3 4 5 6 7 8inclusive electrons / background cocktail 0 1 2 3 4 5 6 7 8 9
cocktail systematic uncertainty inclusive electron systematic uncertainty total systematic uncertainty
Fig. 10: (Colour online) Inclusive electron yield per minimum bias pp collision as function of pt at
√
s= 7 TeV in comparison with background electron cocktails for the TPC-TOF/TPC-TRD-TOF anal-ysis (left panel) and the TPC-EMCal analanal-ysis (right panel). Lower panels show the ratio of the inclusive electron yield to the background electron cocktail for both analyses.
4.1 Heavy-flavour hadron decay electron cross section
The differential inclusive electron yield in pp collisions at √s= 7 TeV, already shown in Fig. 8, is compared to the background electron yield as calculated within the cocktail approach in the left and right panels of Fig. 10 for the TPC-TOF/TPC-TRD-TOF and the TPC-EMCal analysis, respectively. Statistical uncertainties in the inclusive electron measurement are shown as error bars, while systematic uncertainties are indicated by boxes. The background contribution from photon conversions is smaller in the TPC-TOF/TPC-TRD-TOF analysis because in this case a hit in the first pixel layer is required for electron candidate tracks. Consequently, the ratio of the measured inclusive electron yield to the calculated electron background is larger for the TOF/TRD-TOF analysis than for the TPC-EMCal analysis as shown in the lower left and right panels of Fig. 10, respectively.
The differential production cross section of electrons from heavy-flavour decays is calculated by first sub-tracting the background cocktail from the inclusive electron spectrum and then multiplying the difference with the minimum bias pp cross section σMB. The corresponding systematic uncertainties propagated
from the inclusive electron measurement and the electron background cocktail are summarised in Ta-ble 8. The value for σMBis 62.2 ± 2.2(sys.) mb. This number was obtained by relating σMBto the cross