Thanakorn Pheeraphan
B.S., Virginia Military Institute
May 1991
S.M.C.E., Massachusetts Institute of Technology
August 1993
Submitted to the Department of Civil and Environmental Engineering
in partial fulfillment of the requirements for the degree of
Doctor of Philosophy
at the
MASSACHUSETTS INSTITUTE OF TECHNOLOGY
,-,
2
1.
i3
February 1997
i
@1997, Thanakorn Pheeraphan. All rights reserved.
The author hereby grants to MIT permission to reproduce and to distribute publicly paper
and electronic copies of this thesis document in whole or in part.
Author ...
.
. .- .-
...
Department of Civil and Environmental Engineering
December 31. 1996
Certified by ...
Assistant Professor,Department of Civil
Christopher K. Y. Leung
and Environmental Engineering
Thesis Supervisor
Accepted by ...
Joseph IM.
Sussman
Chairman. Departmental Committee on Graduate Studies
by
Thanakorn Pheeraphan
Submitted to the Department of Civil and Environmental Engineering on December 31, 1996, in partial fulfillment of the
requirements for the degree of Doctor of Philosophy
Abstract
A high rate of strength development in concrete can benefit several operations in the construction industry such as precast concrete fabrication and concrete pavement repair. Current approaches to accelerate rate of strength development are not very satisfactory. Steam curing techniques, which provide slow rate of heating and non-uniform hydration products, can take over one day to reach sufficient strength. With chemical accelerators or rapid hardening cements, concrete may face long term durability problems which are currently not well understood. Microwave curing technique which can provide high rate of strength development and uniform heating is an alternative.
In this study, determination of optimal process, which provides high strength at both early and later stages, is obtained with help of feedback temperature control. Strength of up to 5,100 psi is obtained for microwave cured concrete within 4.5 hours while its 7-day strength is the same as that of normally cured concrete. Then the effects of microwave on the performances of concrete with different additives (e.g., concrete with superplasticizer admixture and air-entrained concrete) are investigated.
Another major objective of this research is to develop and verify the numerical model which can simulate microwave curing of concrete. The numerical model, called microwave heating model, basically combines electromagnetic power dissipation and heat transfer models together in order to compute the temperature distribution inside the material during the curing process. The power dissipation model uses finite-difference time-domain technique to solve electric and magnetic fields in Maxwell's equation in order to determine the steady state dissipated power. To compute the dissipated power during microwave curing, the evol-ution of permittivity of heated concrete is to be established. The traditional maturity concept, which is used to estimate strength development based on thermal history and curing time, is therefore used and the permittivity-maturity relation can then be established within the specified range of curing temperature. Once the steady state dissipated power is obtained, the heat transfer model is used to compute the temperature inside the material. The microwave heating model is then verified by comparison with the experimental results. The developed model provides a tool for the design of microwave applicators for practical processes.
Thesis Supervisor: Christopher K. Y. Leung
I would like to express my sincere appreciation to Prof. Christopher K.Y. Leung for his kindness, intelli-gence advice, warmly support and encouragement throughout my study here. He is the kind of advisor who is always there when I need him. To work with him, it has always been special and enjoyable.
I am truly honored and grateful to have Prof. Oral Buyukozturk, Prof. Jin A. Kong of the Department of Electrical Engineering and Computer Science, and Dr. Robert Shin of M.I.T. Lincoln Laboratory, in my thesis committee. Thank you for your valuable suggestion, comments, and time. Special thanks to Prof. Jin A. Kong for giving me a knowledge in the area of Electromagnetics and for providing access to the network analyzer system and excellent computer resources.
To Dr. Neal Burk and Mr. Ray Henderson of the W.R. Grace & Co. in Cambridge, thank you for providing access to the freezing and thawing facilities. Special thanks to Mr. Ray Henderson for helpful discussions and technical assistance related to freezing and thawing measurement.
Without helps in preparing my test equipment by Arthur and Stephen Rudolph, who have been nice to me for many years, my labwork and experiments would not be possible. Thank you.
Many thanks go to friends in Electrical engineering department: to Sean Shih, Dr. Joel Johnson and Dr. M. Ali Tassoudji for helpful discussions and assistance related to the measurement of permittivity, to Dr. Kevin Li and Jerry Akerson for useful discussion on the Finite-Difference Time-Domain technique and to Kit Lai for administrative work.
My appreciation also goes to all of my friends who always cheer me up, write me, support me, and help me fight through obstacles. Among those whose names deserved to be mentioned are Taweesak Bunleusin, Yiping
Geng, Somsak Kittipiyakul, Chanathip Namprempre, Roong Poshyananda, and Nutteerat Wutthicharoen. My academic study is all well taken care of by the Royal Thai Air Force and all of funds for experimental works are provided by Prof. Christopher K.Y. Leung.
1 Introduction
1.1 Motivation . . . . 1.2 Objectives . . . . 1.3 Approach . . . . 1.4 Outline of the Thesis
2 Determination of Optimal Process
2.1 Introduction ... ... 2.2 Background ...
2.2.1 Strength development of normal-cured concrete 2.2.2 Strength development of microwave-cured concrete 2.3 Experimental Program . . . ..
2.3.1 Material preparation ...
2.3.2 Feedback temperature control . . . . 2.3.3 Specimen preparation and curing process . . . . . 2.4 Results and Discussion ...
2.4.1 Mortar specimens ... 2.4.2 Concrete specimens ...
2.4.3 Concrete specimens with superplasticizer . . . . . . . . . . . . . . . . . . . . . . . . . . . . . . . . . . . . . . . . . . . . . . . . . . . oo... . . . . . 48
2.4.4 Concrete specimens with air-entraining admixture 2.5 Additional Test ... ...
2.5.1 Splitting tensile strength ...
2.5.2 Photographs of pores and microcracks . . . . 2.6 Conclusion .... ... ... .. .. .. .. . .. .
3 Freeze-Thaw Durability
3.1 Introduction . . . . 3.2 Background ... ...
3.2.1 Frost damage of hardened concrete . . . . 3.2.2 Factors controlling frost resistance of hardened concrete 3.2.3 Calculation of durability factor of concrete . . . . 3.3 Experimental Program ...
3.4 Results . . . . 3.4.1 Compressive strength result . . . . 3.4.2 Freeze-thaw test result ...
3.4.3 Air-void characteristics result . . . .
3.5 D iscussion . . . .
3.5.1 Effect of microwave energy on freeze-thaw durability . . 3.5.2 Use of data from loss of mass as the indicator of freeze-thaw
3.5.3 Effect of the length difference of the specimens on freeze-thaw durability . 3.6 C onclusion . . . .
4 Complex Permittivity Measurement of Concrete
4.1 Introduction . . . . 4.2 Permittivity of Concrete ...
4.3 Theory for the Measurement Method ...
.. . 65 .. . 66 . . . 66 . . . 69 . . . 72 .. . 73 .. . 77 . . . 77 ... 80 ... 86 .. . 89 ... 89 . . . 96 . . . 97 .. . 97 99 . . . . . 99 ... 100 ... 101 . . . . . 58 . . . . . . 60 . . . . . . . . 60 . . . . . 62 . . . . 62 durability .
4.4 M easurem ent ... .. .. ... ... .... ... .. .. .. . ... . .. . .. .. ... .. .. 104
4.4.1 M easurement set-up ... 104
4.4.2 Measurement procedure ... 105
4.5 Results ... 107
4.5.1 W ater . . . 107
4.5.2 Fresh concrete cured normally ... 107
4.5.3 Fresh concrete cured under different temperature histories . . . 108
4.6 Permittivity-Maturity Relation of Heated Concrete ... ... 110
4.6.1 Low temperature range ... 115
4.6.2 High temperature range ... 115
4.7 Suggestion ... 115
4.7.1 Measurement with only one optimum length ... ... 115
4.8 Conclusion ... ... . 119
4.9 Appendix I. - Two-Layered Medium in Rectangular Waveguide. ... . . . . 120
4.10 Appendix II. -An Example of Permittivity Calculation ... ... 123
5 Power Dissipation Model 125 5.1 Introduction . . . 125
5.2 M axwell's Equations ... ... ... .. 125
5.3 FDTD Algorithm ... 127
5.3.1 Center difference ... ... . 128
5.3.2 Choices of space and time increment ... ... 130
5.4 Treatment of Free Space and Dielectric Material ... ... 131
5.4.1 Implementation ... ... 134
5.5 Treatment of Boundary Conditions ... 135
5.5.1 At metallic wall ... ... 135
5.5.3 At unbounded space ... 5.5.4 At excitation port ... 5.6 Treatment of Excitation Source ...
5.6.1 TE1o mode in air-filled rectangular waveguide propagating 5.6.2 TElo mode in air-filled rectangular waveguide propagating 5.7 Calculation of Dissipated Power ...
5.7.1 Review of Poynting's theorem ...
5.7.2 Finite difference equations for power dissipation equation 5.7.3 Steady-state dissipated power calculation . . . .
5.8 Verification of the Power Dissipation Model . . . . 5.8.1 Field value comparison ...
5.8.2 Dissipated power distribution comparison . . . . 5.9 Conclusion . . . .
5.10 Appendix I. - Two-Layered Medium in Rectangular Waveguide 5.10.1 Problem description ...
5.10.2 Solution . . . .
6 Heat Transfer Model
6.1 Introduction . . . . 6.2 Transient Heat Diffusion ...
6.2.1 Rate of generated heat due to microwave power absorption 6.2.2 Rate of convective heat loss . . . . 6.2.3 Implementation ...
6.2.4 Choices of space and time increment . . . . 6.3 Effect of Cylindrical Shape of Material in Numerical Model . . . 6.4 Verification of the Heat Transfer Model . . . . 6.5 Conclusion .. .. ... .... .. . . ... ... .. .... .. . direction direction 167 167 167 168 169 169 172 172 173 175 ... 137 ... 140 ... 143 ... 144 ... 145 ... 146 ... 146 ... 148 ... 149 ... 149 ... 150 ... 155 ... 155 . . . . . .163 ... 163 ... 163
6.6 Appendix I. - Stability Analysis ... 176
7 Microwave Heating Model
7.1 Introduction ...
7.2 Overview of Microwave Heating 7.3 Calibration for Input Power ..
7.3.1 Result ... 7.3.2 Verification ...
7.4 Simulation of Microwave Curing
7.4.1 Heating with 412 watts . 7.4.2 Heating with 200 watts. 7.4.3 Heating with 75 watts . 7.4.4 Discussion ...
7.5 Conclusion ...
8 Conclusion and Future
8.1 Research Summary . 8.2 Conclusion ... 181 . . . 181 Model of Concrete . .. of Concr... . . . . . . . . . . . . . . . . . . . . . . . . ... Work . . . . . . . . . . . .. 198 8.3 Recommendations for Future Work ... ... 199
Bibliography 182 183 184 187 187 187 190 191 191 194 197 197 . . . . . . . . . . . . . . . .. . . . . . . . . . . . . . ... - - - - - - - -. . . . . . .. . . . . . . . . . . . . . . . . 201
2-1 Heat liberation curve of a Portland cement paste at early time [Mehta, 1986] ... 28 2-2 A graph of measured temperature versus time during the early hardening period of 0.40 w/c
normal-cured concrete vs a graph of its strength development . ... 29 2-3 The curves of measured temperature versus time during the early hardening period of 0.40
w/c concrete under microwave curing and normal curing ... .. 31 2-4 A polyethylene mould with temperature probe ... ... 35 2-5 Analog PID output diagram [adapted from Labtech Notebook reference manual, 1992] . . .. 36
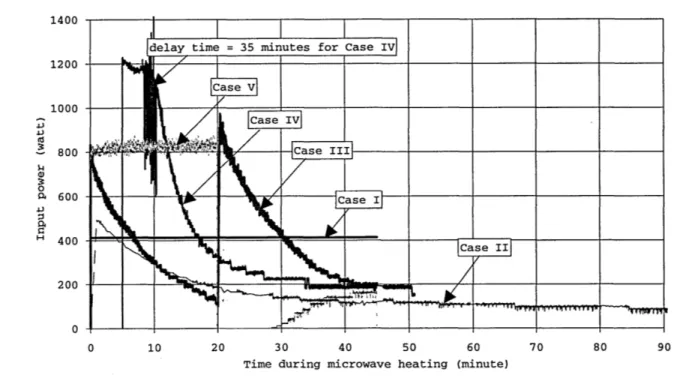
2-6 Power history plots for microwave-cured mortar specimens of Cases I, 11, IIL, IV, and V (Time in x-axis = time during microwave processing) ... ... 39
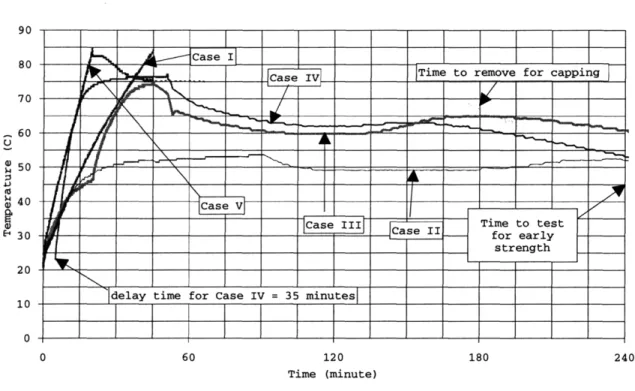
2-7 Temperature history plots for microwave-cured mortar specimens of Cases I, II, III, IV, and V (Time in x-axis = time during and after microwave processing) . ... 40
2-8 Results of the effect of heating rate on the compressive strength development (at 4.5 hours and 7 days) of 0.50 w/c mortar specimens under microwave curing for Cases I, II, III, IV, and V . 42 2-9 Power history plots for Cases TCC1, TCC2, TCC3, and TCC5 of 0.40 w/c microwave-cured
concrete specimens (Time in x-axis = time during microwave processing) . ... 43
2-10 Temperature history plots for Cases TCC1, TCC2, TCC3, and TCC5 of 0.40 w/c microwave-cured concrete specimens (Time in x-axis = time during and after microwave processing) . . . 43
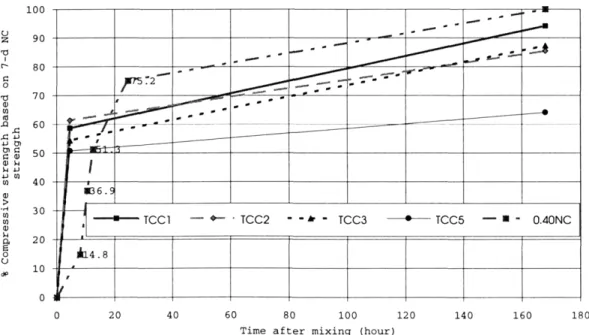
2-11 Results of the effect of heating rate on the compressive strength development of Cases TCC1,
2-12 Compressive strength development of Cases TCC1, TCC2, TCC3, TCC5 and 0.40 w/c
normal-cured concrete ... ... .... ... .... 45
2-13 Power history plots for Cases TCC1, TCC6 and TCC7 of 0.40 w/c microwave-cured concrete specimens (Time in x-axis = time during microwave processing) . ... 47
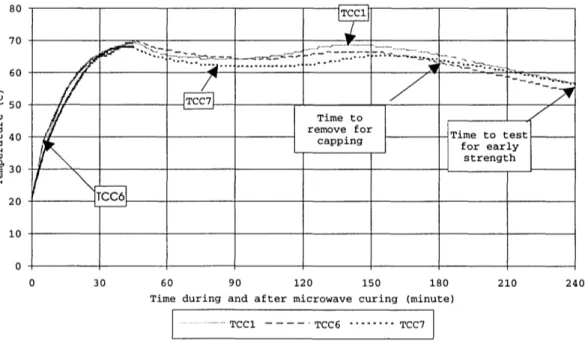
2-14 Temperature history plots for Cases TCC1, TCC6 and TCC7 of 0.40 w/c microwave-cured concrete specimens (Time in x-axis = time during and after microwave- processing) ... 47
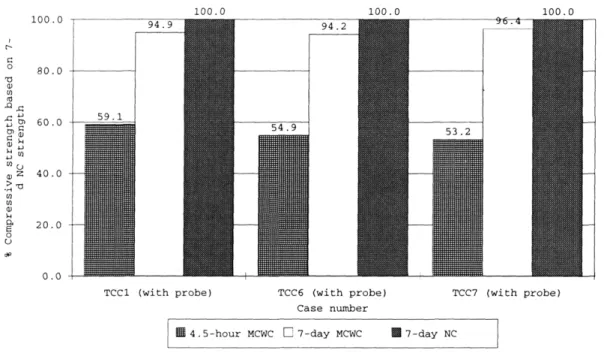
2-15 Results of the effect of discrete power levels on the compressive strength development of Cases
TCC1, TCC6, and TCC7 ... 48
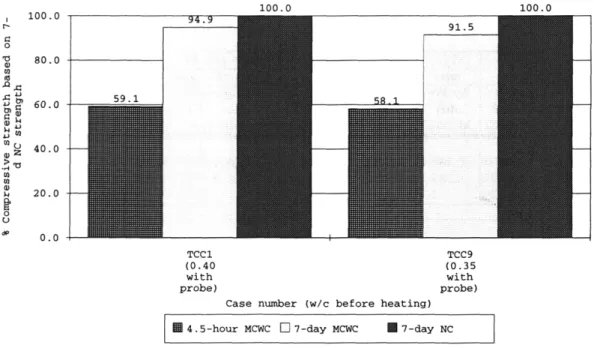
2-16 Results of the effect of temperature probe on the compressive strength development ... 49 2-17 Results of the effect of superplasticizer on the compressive strength development of Case TCC9
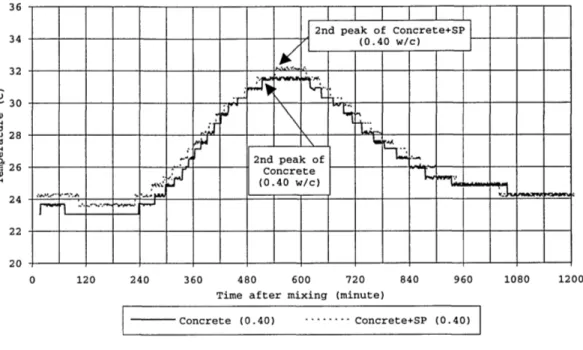
compared with Case TCC1 ... 52 2-18 Temperature history plots for Cases TCC1 and TCC9 (Time in x-axis = time during and after
microwave processing) ... 52
2-19 Comparison of the temperature history plots for normal curing case in the presence and absence of superplasticizer (Time in x-axis = time after water is mixed with the cement and aggregates) 53
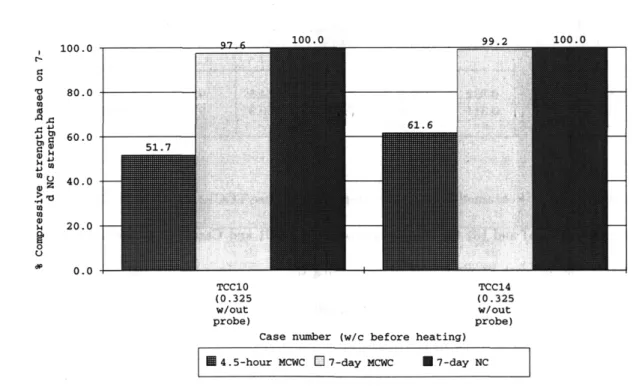
2-20 Results of the effect of discrete power levels on the compressive strength development of Cases TCC9, TCC12, and TCC13 ... . 55 2-21 Results of the effect of heating rate on the compressive strength development of Cases TCC10
and TCC14 ... . .... ... ... 55
2-22 Results of the effect of w/c ratio on the compressive strength development . ... 57 2-23 Results of the effect of heating rate on the compressive strength development of Cases AEM2
and AEM4 for air-entrained concrete ... 60 2-24 Results of the effect of the amount of air content on the compressive strength development of
air-entrained concrete ... . .. 61 2-25 Pictures showing pores and microcracks in concrete specimens of Case TCC14 (0.325 w/c) . 63
3-1 The relationship between size of pores in concrete and melting temperature of water- -The melting temperature is the equilibrium temperature between pore water and bulk ice. It depends on the pore dimensions and the physicochemical properties of the inner pore surface. In general, the freezing temperature is lower than the melting temperature. Therefore, the freezing temperature of the gel pores (mentioned in the text) is actually lower than the melting temperature shown here. [Harnik et al., 1980] ... 67 3-2 The specific volume of water and ice as a function of temperature [Harnik et al., 1980] . . .. 68
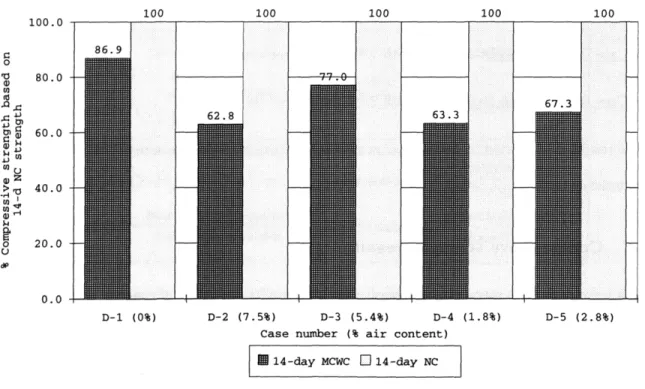
3-3 Picture of the set-up for fundamental frequency measurement: HP 3582A Spectrum Analyzer, 4102 current source by DYTAAN, and a small hammer ... ... 74 3-4 Schematic diagram of Type B air meter according to ASTM C 231-91b . ... 75 3-5 Procedure B, the modified point-count method, of ASTM C 457-90 . ... 76 3-6 Results of the effect of microwave energy on the compressive strength development of Cases
D-1, D-2, D-3, D-4 and D-5 ... ... .. 78 3-7 Relative thermal expansion of water and air relative to that of solids [Soroka, 1979] (from
Alexanderson, J., "Strength Loses in Heat Cured Concrete," Proc. Swedish Cement Concrete Research Institute, 43, 1972.)
3-8 Relative dynamic modulus of
microwave-cured concrete and
3-9 Relative dynamic modulus of
microwave-cured concrete and
3-10 Relative dynamic modulus of
microwave-cured concrete and
3-11 Relative dynamic modulus of
microwave-cured concrete and
3-12 Relative dynamic modulus of
microwave-cured concrete and
elasticity versus freeze-thaw cycles NCC = normal-cured concrete) . .
elasticity versus freeze-thaw cycles NCC = normal-cured concrete) . elasticity versus freeze-thaw cycles NCC = normal-cured concrete) . .
elasticity versus freeze-thaw cycles NCC = normal-cured concrete) . .
elasticity versus freeze-thaw cycles NCC = normal-cured concrete) . . for Case D-1 (MCWC = for Case for Case for Case for Case D-2 (MCWC = D-3 (MCWC = D-4 (MCWC = D-5 (MCWC = S . . . . . 79
3-13 Loss of mass versus freeze-thaw cycles for Case D-1 (MCWC NCC = normal-cured concrete) ...
3-14 Loss of mass versus freeze-thaw cycles for Case D-2 (MCWC NCC = normal-cured concrete) ...
3-15 Loss of mass versus freeze-thaw cycles for Case D-3 (MCWC NCC = normal-cured concrete) . ...
3-16 Loss of mass versus freeze-thaw cycles for Case D-4 (MCWC NCC = normal-cured concrete) ...
3-17 Loss of mass versus freeze-thaw cycles for Case D-5 (MCWC NCC = normal-cured concrete) . . . .
= microwave-cured concrete and Smicrowave-cured... = microwave-cured . . . .. . . . = microwave-cured = microwave-cured = microwave-cured concrete and concrete and concrete and concrete and
3-18 Photographs of test specimens of Case D-1 at the end of freeze-thaw resistance test ... 3-19 Photographs of test specimens of Case D-3 at the end of freeze-thaw resistance test ... 3-20 Photographs of surfaces of low w/c specimens of Case D-5 at a magnification of 50x ...
3-21 Drawing of air-void system of low w/c air-entrained concrete under normal curing versus microwave curing ... . . . .... ...
3-22 Photographs of surfaces of high w/c specimens of Case D-2 at a magnification of 50x ... 3-23 Drawing of air-void system of high w/c air-entrained concrete under normal curing versus
microwave curing ... ...
4-1 Relation between thickness of 250C water with (76.7 + 12.0i) backed with a metal plate and its relative magnitude of reflection coefficient . ... ...
4-2 HP 8510 vector network analyzer ...
4-3 An example of waveguide-to-coaxial adapter . . . . 4-4 A setup to measure reflection coefficient when a metallic plate is at the end of waveguide . . .
4-5 Plots of dielectric constant vs time after mixing of 0.45 and 0.50 w/c concrete cured normally 4-6 Plots of loss factor vs time after mixing of 0.45 and 0.50 w/c concrete cured normally ...
87 88 93 94 95 96 102 104 105 106 109 109
4-7 Plots of temperature vs time in the first 45 minutes in curing chamber of 0.50 w/c concrete cured under low range temperature history ... ... 111 4-8 Plots of temperature vs time after 30 minutes mixing with water of 0.50 w/c concrete cured
under low range temperature history ... 111 4-9 Plots of dielectric constant vs time after mixing of 0.50 w/c concrete cured under low range
temperature history ... 112
4-10 Plots of loss factor vs time after mixing of 0.50 w/c concrete cured under low range temperature history . . . ... . . . 112 4-11 Plots of temperature vs time after mixing of 0.50 w/c concrete cured under high-range
tem-perature history ... 113
4-12 Plots of dielectric constant vs time after mixing of 0.50 w/c concrete cured under high-range temperature history ... .. ... 114 4-13 Plots of loss factor vs time after mixing of 0.50 w/c concrete cured under high-range
temper-ature history ... ... ... . 114
4-14 Permittivity (real part)-maturity relation of 0.50 w/c concrete cured under low-range temper-ature history ... ... ... .... ... 116 4-15 Permittivity (imaginary part)-maturity relation of 0.50 w/c concrete cured under low-range
temperature history ... 116
4-16 Permittivity (real part)-maturity relation of 0.50 w/c concrete cured under high-range
tem-perature history. ... 117
4-17 Permittivity (imaginary part)-maturity relation of 0.50 w/c concrete cured under high-range
temperature history ... 117
4-18 A setup to measure reflection coefficient when matched load is at the end of waveguide . . . . 118
4-19 Reflection and Transmission of TE wave in a layered medium inside the rectangular waveguide 121
5-1 Field components of a unit cell in rectangular coordinate ... ... .. 128 5-2 Finite difference plot ... ... 129
5-3 Location of field components used to compute magnetic field in FDTD ...
5-4 Location of field components used to compute electric field in FDTD . . . .
5-5 Field assignment for implementation ...
5-6 Interface between unit cells to compute Ez ...
5-7 Details at excitation port when TE1o wave is propagating in +i direction . . . . 5-8 Details at excitation port when TElo wave is propagating in -i direction . . . .
5-9 A component of E field in a unit cell ...
5-10 Example plots of total dissipated power versus time step for several materials ...
5-11 Rectangular waveguide problem with excited TE1o wave . . . . 5-12 Comparison of Ey values from analytical solution and numerical modeling in air-filled
rectan-gular waveguide (unit of E is volt/meter) ...
5-13 Comparison of Hx values from analytical solution and numerical modeling in air-filled rectan-gular waveguide (unit of H is ampere/meter) . . . .
5-14 Comparison of Hz values from analytical solution and numerical modeling in air-filled rectan-gular waveguide (unit of H is ampere/meter) . . . .
131 133 134 137 141 143 148 150 151 152 153 154 5-15 Comparison of Ey values from analytical solution and numerical modeling in two-layered
medium-filled rectangular waveguide (unit of E is volt/meter) . ... 156 5-16 Comparison of Hx values from analytical solution and numerical modeling in two-layered
medium-filled rectangular waveguide (unit of H is ampere/meter) . ... 157 5-17 Comparison of Hz values from analytical solution and numerical modeling in two-layered
medium-filled rectangular waveguide (unit of H is ampere/meter) . ... 158 5-18 Rectangular cavity problem (loaded with dielectric material) with excited TElo in the
rectan-gular waveguide ... . .. ... 159 5-19 Steady-state dissipated power distribution for each layer of a block of (2 + 0.5i) material in a
6-1
6-2
6-3
6-4
Notation used in implementation of heat flow ... ... 171 Temperature distribution within a thin slab made of water-like material excluding heat loss to surroundings (temperature on z-axis in Kelvin) ... ... 174 Problem description for cooling process of rectangular steel bar . ... 175 Problem description for cooling process of cylindrical steel bar with one end insulated ... 176
7-1 Overview of microwave heating model of concrete ... . . . .
7-2 Laiboratory microwave cavity with loaded dielectric materials used in numerical model to calibrate input power ...
7-3 Plots of total dissipated power versus time step for 9.10C water, 21.40C water and 200C concrete due to microwave heating(1 time step = 3.4014x10- 12 second and input field strength
= 1 am pere/m) ...
7-4 Plot of microwave power versus input field strength . . . . 7-5 Dissipated power profiles of several layers of 9.10C water after 1 minute of heating with input
field strength of 6.5 ampere/m equivalent to 412 watts (with convection and power on z-axis in w att) . . . . 5-20 Steady-state dissipated power distribution for each layer of a block of (2 + 0.5i) material in a
rectangular cavity (material is 4.587 cm from top of cavity and unit of power on z-axis is in watt) . . . .... . . . 5-21 FDTD results for dissipated power of a block of (2 + 0.5i) material in a rectangular cavity by
Liu et. al. (material is 1.72 cm from top of cavity) . . . . 5-22 FDTD results for dissipated power of a block of (2 + 0.5i) material in a rectangular cavity by
Liu et. al. (material is 4.587 cm from top of cavity) ... ... 5-23 Layered medium in rectangular waveguide . . . .
182 184 185 186 188 161 162 162 164
7-6 Temperature profiles of several layers of 9.10C water after 1 minute of heating with input field
strength of 6.5 ampere/m equivalent to 412 watts (with convection and temperature on z-axis
in Kelvin) ... 189
7-7 Comparison of experimental and numerical results of temperature values at center of concrete under 412 watts microwave heating ... 190 7-8 Comparison of experimental and numerical results of temperature values at center of concrete
under 200 watts microwave heating ... 191 7-9 Dissipated power profiles of several layers of 220C concrete after 3 minutes of heating with
input field strength of 4.3 ampere/m equivalent to 200 watts (with convection and power on z-axis in watt) ... ... .... 192 7-10 Temperature profiles of several layers of 220C concrete after 3 minutes of heating with input
field strength of 4.3 ampere/m equivalent to 200 watts (with convection and temperature on z-axis in Kelvin) .... ... ... 193 7-11 Comparison of experimental and numerical results of temperature values at center of concrete
2.1 The development of compressive strength of 0.40 w/c concrete under normal curing ... 30 2.2 Results of the effect of heating rate on the compressive strength development (at 4.5 hours and
7 days) of 0.50 w/c mortar specimens under microwave curing for Cases I, II, II, IV, and V 41 2.3 Results of the effect of heating rate on the compressive strength development of Cases TCC1,
TCC2, TCC3, and TCC5 ... ... .. 44 2.4 Results of the effect of discrete power levels on the compressive strength development of Cases
TCC1, TCC6, and TCC7 ... ... . 50
2.5 Results of the effect of temperature probe on the'compressive strength development of concrete
under microwave curing ... . 50
2.6 Results of the effect of superplasticizer on the compressive strength development of Cases TCC9 compared with Case TCC1 ... 51 2.7 Results of the effect of discrete power levels on the compressive strength development of Cases
TCC9, TCC12, and TCC13 ... 54
2.8 Results of the effect of heating rate on the compressive strength development of Cases TCC10
and TCC14 ... 54
2.9 Results of the effect of w/c ratio on the compressive strength development of concrete under
microwave curing ... 56
2.10 Results of the effect of heating rate on the compressive strength development of Cases AEM2 and AEM4 for air-entrained concrete under microwave curing ... . . . .... . . . . 59
2.11 Results of the effect of the amount of air content on the compressive strength development of air-entrained concrete under microwave curing ... ... 62 2.12 Comparison of compressive strength development and splitting tensile strength development
of concrete under microwave curing ... 64
3.1 Results of the effect of microwave energy (375 Watts for 45 minutes) on the compressive strength development of Cases D-1, D-2, D-3, D-4, and D-5 . ... 78 3.2 Freeze-thaw test results: durability factor for Cases D-1, D-2, D-3, D-4, and D-5 (MCWC =
microwave-cured concrete and NCC = normal-cured concrete) . ... 81
3.3 Air-void characteristics of hardened concrete ... ... 89
4.1 Result of measured permittivity of room temperature water at 2.45 GHz . ... 107
7.1 Properties of several materials used in the numerical model . ... 185 7.2 Specific heats of pastes and concretes [adapted from Mindess et al., 1981] . ... 195
Introduction
1.1
Motivation
A high rate of strength development in concrete can benefit several operations in the construction industry such as precast concrete fabrication and concrete pavement repair. Current approaches to accelerate rate of strength development are not very satisfactory. Steam curing techniques, which provide slow rate of heating and non-uniform hydration products, can take over one day to reach sufficient strength. With chemical accelerators or rapid hardening cements, concrete may face long term durability problems which are currently not well understood. According to our preliminary results in [35], microwave curing of concrete can provide high rate of strength development while its later strength is reasonably high. It is therefore promising to develop microwave curing technique for practical applications.
In reality, it is impossible to carry out experiments for specimens with all possible sizes and geometries. To better understand the microwave curing process and to develop ways to extrapolate laboratory results (on cylinders of a particular size) to practical specimens, numerical models need to be developed. In this thesis, a numerical model to simulate microwave curing of concrete is developed and verified. With the model, guidelines to process various specimens in microwave applicators of different designs could be established. Successful development of this technique can potentially result in breakthroughs in the precast concrete
fabrication and pavement repair operations.
1.2
Objectives
The main objectives of this research are
1. to determine the optimal process providing high compressive strength at-early age (4.5 hour) without significantly impairing the later age strength (7 day)
2. to study the effects of microwave on the performance of concrete with different additives (e.g., concrete with superplasticizer admixture and air-entrained concrete)
3. to develop a numerical tool to simulate microwave curing of concrete 4. to verify the numerical model with experiments
At the end of this work, it is expected that a numerical tool will be available for the development of microwave curing technique for practical applications.
1.3
Approach
As the first step, an optimal process, which provides good combination of early age (4.5 hour) and later age (7 day) compressive strength, is determined. By using feedback temperature control, we try to identify optimal processes with high energy efficiencies.
Then the freeze-thaw durability of microwave-cured air-entrained concrete is studied. This is important to infra-structural applications where air entrainment has to be introduced to resist severe freeze-thaw attack. To compute the dissipated power during microwave heating in the numerical model, it is important to know the actual evolution of permittivity of heated concrete. Because concrete evolves with time and the actual evolution of permittivity of heated concrete at microwave frequency is difficult to obtain, the traditional maturity concept, which is widely used in predicting the strength of concrete based on its thermal history and its current state, is applied.
The next step is to develop the microwave heating model to simulate microwave heating of concrete in particular. The complete model consists of (i) power dissipation model using well established finite-difference time-domain technique to compute steady state dissipated power, (ii) heat transfer model using explicit finite-difference scheme to compute temperature, and (iii) permittivity-maturity relation to update permittivity. Then the model results will be verified with experiments.
1.4
Outline of the Thesis
This thesis contains eight chapters.
Chapter 1 is the introduction chapter. It includes the motivation of this research, the objectives, and approach, as well as the organization of this thesis.
In Chapter 2, the determination of optimized microwave curing process is illustrated with the use of feedback temperature control. The background of strength development of normal-cured and microwave-cured concrete are reviewed. The experimental program and its results are then discussed in details. The optimal process of mortar is obtained first and that of concrete is found in similar manner. Then concrete with various additives are tested to identify their optimal processes.
Chapter 3 presents the freeze-thaw durability of microwave cured air-entrained concrete. The backgrounds of frost damage of hardened concrete, factors controlling frost resistance of hardened concrete, and calculation of durability factor of concrete are given for basic understanding of freeze-thaw durability of concrete. The experimental program is described and the results from compressive strength test, freeze-thaw test, air-void characteristics determination are presented. The effects of various parameters on the freeze-thaw durability of microwave-cured concrete are discussed.
In Chapter 4, the measurement of complex permittivity of concrete are explained. The setup and proced-ure are given. The results illustrated the validity of the measproced-urement. The concept of maturity is described and used to establish the permittivity-maturity relation to represent the evolution of permittivity of heated concrete at microwave frequency. In the appendix, derivation for related equation and an example of
permit-tivity calculation are presented.
In Chapter 5, the power dissipation model using finite-difference time-domain(FDTD) to compute the steady state dissipated power during the microwave curing is covered. The FDTD algorithm is explained and the complete illustrations of treatments of element at every possible condition (i.e., in free space, dielectric material, boundary conditions, excitation source and etc.) in the numerical model are presented. Calculation of dissipated power and the condition to check for steady state are discussed. Then the model is verified by comparison of field values and dissipated power distribution with the analytical solution or available numerical results in the literature. In the appendix, the analytical solution used in comparison of field values is included. In addition, this chapter illustrates the implemented finite-difference equations for computer simulation.
Chapter 6 describes the heat transfer model which is used to compute temperature after the steady state dissipated power is determined. The transient heat diffusion equation and its related components are discussed. Again, the implemented finite-difference equations for computer simulation are included. Then, the verification of the model is shown. In the appendix, the stability analysis is included.
In Chapter 7, the overview of the complete model for microwave curing of concrete is shown clearly. The calibration of input power is described to relate the numerical model to experimental results. Then the model is verified with concrete by performing simulations of microwave curing of concrete at various microwave power levels and comparing model and experimental results.
Chapter 8 summarizes the major findings and highlights the main conclusion. Recommendations for future work are also included.
Determination of Optimal Process
2.1
Introduction
High early strength development is the primary objective of this work because the distinct advantage of microwave curing is the gain in strength at the early stage which is important in several operations in concrete construction industry such as precast concrete fabrication and concrete pavement repairing. At present, the common ways to accelerate concrete hardening are (i) curing at elevated temperatures with or without steam and pressure and (ii) use of chemical accelerators or special cement compositions. Due to its slow rate of heating and non-uniform heating, steam curing is inferior to microwave curing which can provide higher rate of strength development and more uniform heating. With chemical accelerators or special cements, concrete may face long term durability problems which are presently not well understood. From our results on microwave-cured concrete, high compressive strength at early and later stage can be obtained [35]. Therefore, microwave curing is a promising technique to be developed for practical applications. In order to develop this accelerated curing technique for the practical applications, it is of importance to determine the optimal process to show its potential benefits.
This chapter includes (i) background of strength development of concrete under normal curing and mi-crowave curing, (ii) experimental program, (iii) compressive strength results of mortar, concrete, concrete
6 -A 5 4 3B -J 2 . 2 II I-0 4 8 12 16 20 24 Time, Hours
Figure 2-1: Heat liberation curve of a Portland cement paste at early time [Mehta, 1986]
with superplasticizer, and concrete with air-entrained admixture, (iv) splitting tensile strength result and photographs revealing pores and cracks of concrete, and (v) conclusion.
2.2
Background
2.2.1 Strength development of normal-cured concrete
In general, when a cement is hydrated, the heat of hydration data can be used to characterize its setting and hardening behavior. A typical plot of the heat liberation curve of a Portland cement paste is shown in Figure 2-1. The first peak (peak A) occurring a few minutes after mixing is largely due to the heat of solutions of aluminates from tricalcium aluminate and sulfates from gypsum [27]. Also, it corresponds to the formation of gelatinous colloidal coatings of hydration products around the cement grains [10]. Then, the heat liberation decreases rapidly as the solubility of aluminates is depressed due to the presence of sulfates in the solution [27].
At 4-8 hours after mixing, a rising of the second acceleration peak (peak B) represents the period of the final set (or beginning of hardening) which is accompanied by a high rate of strength development. This is mainly due to the growth of calcium silicate hydrate (C-S-H or a hydration product of calcium silicates) which in general provides most of the strength to concrete.
32 -t 00
30
-
- - -- I 5 00Temperature curve
) 26 .00
22 00
To show the rate of strength development during the second peak period, the graph of measured
temper-the region where temper-the rate of strength development relatively high. Therefore, the specimen which is testedis
for strength a short while after reaching the second peak will have higher early strength than the one that is tested before or right at the peak. And, the early strength will be even higher if the specimen is allowed to go through the region of high strength development long enough before removal for capping and test. Note that once the temperature is reduced, the rate of strength development will become lower. Table 2.1 shows the result of its compressive strength over time. Apparently, the second acceleration period is very significant
for strength development of concrete. -- i = =_
.~..r~s-, U _.
22---108 200---2 1400 Time ftermixig (mnute
Table 2.1: The development of compressive strength of 0.40 w/c concrete under normal curing Age Compressive strength 7-day compressive strength
(hour) (psi) M(%) 0 0 0 8.0 1032.7 14.8 10.5 2571.2 36.9 12.5 3572.1 51.3 24.5 5234.4 75.2 168.0 6963.9 100
2.2.2 Strength development of microwave-cured concrete
Microwave, an electromagnetic wave with a wavelength of 1 mm - 1 m and a frequency range of 0.3 to
300 GHz, can be used as an energy source to heat dielectric materials composed of positive and negative poles. Water is an example of dielectric materials. When microwave transmits through a dielectric material, an internal electric field is generated inside the material, leading to a vibration or movement of the polar molecules to reduce the intensity of the electric field [45]. These movements are resisted by friction and inertial forces. Consequently, heat is generated and the temperature is elevated inside the material.
It is believed that the development of compressive strength due to microwave heating depends on two distinct effects:
1) Effect of accelerated cement hydration 2) Effect of increased porosity and microcracks
While microwave energy is being applied to the concrete specimen, the rate of cement hydration is accel-erated because the increased curing temperature can shorten the induction period [16], which is the period during which the cement paste still remains in plastic state and there is very little hydration occurring, and can bring the second peak to occur at a much earlier time period. As a result, the rate of strength devel-opment at early age of microwave-cured concrete will be much faster than that of normal-cured concrete. Figure 2-3 shows an example of the curves of measured temperature during the early hardening period of 0.40
80 -peal I peak II 70 -,60 -u IMicrowave curing 50 2nd peak of normal-cured specimen Normal curing 30 20 0 120 240 360 480 600 720 840 960 1080 1200 1320 1440
Time after mixing (minute)
Figure 2-3: The curves of measured temperature versus time during the early hardening period of 0.40 w/c concrete under microwave curing and normal curing
w/c concrete under microwave curing and normal curing. ,For microwave curing, the initial peak (peak I) is mostly due to the application of microwave energy while the second peak (peak II) is owing to the cement hydration identical to the second peak of concrete under normal curing.
However, at later stage, the strength of specimens under microwave treatment can be lower than that of specimens under normal curing. This can be explained by the effect of increased porosity and microcracking which dominates the results at later age. During heating and maybe a short while afterwards, due to the difference in the thermal expansion coefficients of the concrete constituents (the thermal expansion coefficients of water and air are roughly 15 and 200 times, respectively, higher than that of the aggregate and the cement [18]), the greater expansion of water and air inside the specimen can result in an increase in both the porosity and the internal pressure, leading to the formation of microcracks inside the specimen. The strength at the later age of the treated specimens can therefore be less than the untreated ones. However, the later-age strength of microwave-cured specimen can be equal to or better than that of normal-cured specimen if the effect of increased porosity and microcracks is minimized.
Another important point is that before the application of microwave energy, it is essential for concrete to observe a substantial natural curing time in order to allow initial reaction of hydration involving dissolution of anhydrous cement constituents to their ionic forms into the solution; in other words, microwave energy should be applied at the beginning of the induction period of hydration. If concrete is not allowed to have sufficient initial reaction, quick precipitation of hydration products and rapid evaporation of water due to an elevated temperature can cause the formation of unfavorable hydrated products leading to a decrease in strength. An adverse effect will also be found if the application of microwave occurs after the structure of concrete has begun to form (or after the ionic mobility in the solution is restricted). It can be explained that since the structure of concrete has already formed, when microwave energy is applied, free water in the capillary pores can escape leaving behind partially empty voids. Consequently, the paste structure becomes more porous and strength is reduced. Therefore, to increase both early and later strength, differential expansion due to application of microwave energy should take place during the liquid/plastic stage so that the entrapped air can escape without any adverse effect and the excess water can be driven to the surface and get evaporated. When water evaporates, the concrete can densify as the capillary structure collapses.
The above statement is consistent with the works by Wu et al.[52] and Pheeraphan [35]. The permeability result by Wu et al. indicates that while microwave energy is applied to fresh concrete, its porosity is decreased due to the removal of water before setting resulting in the collapse of capillary voids and the densification of concrete. Additional result shows that when the starting times of microwave application are at 45 and 120 minutes after mixing, the 3-day compressive strength is decreased to 90% and 83% of the reference strength, which is the 3-day strength of the specimen with microwave energy applied right after mixing. The reduction of strength is explained by the fact that if microwave energy is applied after the network structure of concrete
has already formed, porosity will not be reduced.
Similar results are obtained by Pheeraphan [35]. Using the 7-day strengths of normal-cured specimens as the baseline (100%) for each different delay time (defined as the time after water is mixed with cement), the 4.5-hour strengths of microwave-cured specimens whose delay times are 20, 30, and 61 minutes are 12.5%, 35.8%, and 29.3%, respectively. The corresponding values for 7-day strength are 69.5%, 70.3%, and 60.5%.
It is noticed that when the delay time is increased from 30 to 61 minutes, the strengths of microwave-cured specimens at both 4.5 hours and 7 days are decreased. The reduction of strength is due to the same reason described previously. In addition, Pheeraphan also observes that if fresh concrete is allowed to cure naturally for a substantial period of time before microwave application to have sufficient initial hydration, its early strength can be higher than that of the case where microwave energy is applied to fresh concrete right after mixing. It can be seen from the 4.5-hour results of specimens with 20- and 30-minute delay times that the former gains strength much slower than the latter at 4.5 hours while their 7-day strength in term of percentage are the same.
Therefore, it is important to experimentally determine the delay time in order to allow sufficient initial reaction of cement hydration while the concrete structure, that can restrict excess water to escape, has not begun to form yet.
Rate of heating is one of the most important factors on strength development of microwave-cured concrete. It can affect the occurrence of the second peak which is used to explain the gain of early strength. Based on the same explanation as described in the strength development of normal-cured concrete section, high early strength can be achieved if the specimen is removed for capping and test a short while after its second peak is reached. It can also be noted that the rate of heating affects not only the strength development at early age but later age. The effect will be discussed in a later section.
To conclude, the effect of accelerated cement hydration improves the early strength while in the long term, the adverse effect of increased porosity and internal microcracks becomes dominant and thus may reduce the later strength. The rate of heating as well as the location of the second acceleration peak are both significant factors for strength development of microwave-cured concrete.
2.3
Experimental Program
Preparation of material is first described, followed by the discussion of the feedback temperature control and its set-up. Then, the specimen preparation and curing process are explained.
2.3.1 Material preparation
Both mortar and concrete specimens are made with type III Portland cement but with different sources of sand. For mortar specimens, the cement/mortar sand ratio is fixed at 1:2. Mortar sand whose fineness modulus is 2.28 is supplied locally by B. Vitalini, Inc. from Milford in Massachusetts. For concrete specimens, the cement/Boston sand/pea gravel ratio is 1:1:1.5. Boston sand with 2.82 fineness modulus is obtained from Boston Sand and Gravel Co. while pea gravel is supplied from B. Vitalini, Inc..' Pea gravel is washed and dried in the conventional oven for one day. After 7 days in air, it is sieved to sizes between 0.371 inch (or 9.4 mm) and 0.093 inch (or 2.36 mm) before use.
WRDA-19 superplasticizer supplied by W.R. Grace & Co. is used to produce low w/c concrete. It is suggested by the supplier to add superplasticizer in a range of 6 to 20 fluid ounces per 100 lbs of cement. In the experiment, the ratio of 13.5 fluid ounces of WRDA-19 superplasticizer per 100 lbs of cement (or 4 grams of WRDA-19 per 1 lb. of cement) is used. It is added to the water before mixing.
To provide freeze-thaw resistance, Duravair-1000, a liquid air-entraining admixture supplied by W.R. Grace & Co., is used to produce air systems in concrete. Usually, air content should be in the range of 4-8% and can be produced with the typical addition rates range from 0.75 to 3 fluid ounces of Duravair-1000 per 100 lbs of cement (or 50 to 200 mL per 100 kg) as recommended by the supplier. The addition rate between this range is used in our experiments and the admixture is added to the water before mixing.
2.3.2 Feedback temperature control
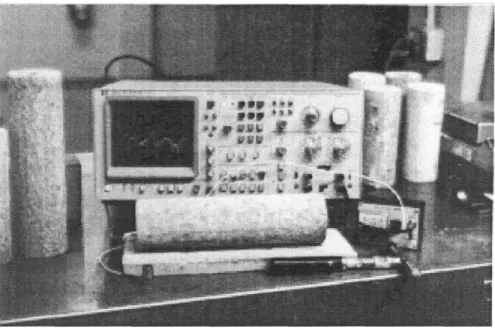
In the experiments, a microwave oven model LBM1.2V fabricated by Cober Electronics, Inc. is employed. It can generate power at any level from 0 to 1200 watts. To achieve uniform heating, there are a mode stirrer and a turntable. In addition, the oven is supplied with a product temperature probe and an Analog Devices MMAC-1050 data acquisition system to monitor the internal temperature of the material and to allow the feedback control of microwave process. The probe should be inserted into the material so that the tip is
positioned at the center. Figure 2-4 illustrates a configuration that protects the probe from concrete hardening
Pyrex Tube
(filled with heat sink compound)
Tube holder (made of Polyethylene sheet)
Thermal Couple
Details of Tube holder (Top View) Polyethylene Mould
Figure 2-4: A polyethylene mould with temperature probe
The pMAC-1050 is installed with the RS-232 interfacewhich can communicate data with the computer using the Labtech Notebook software. The analog signals sent to the liMAC-1050 from the devices, such as power and sample temperature, are converted to a digital format and can be collected by the computer via the interface and using the software. Therefore, the power and temperature can be measured and recorded. In addition, it is also possible to control the microwave power with the computer through the interface by setting up the analog output with the software.
The control process used with the Notebook is called Analog output closed-loop. It requires the input and output blocks. The input block is used to acquire the process data (input signal) from the controlled system to the Notebook while the output block is used to process this data through a control algorithm. A PID (Proportional-Integral-Derivative) algorithm is used to determine the output value based on the desired setup value. The output is then used to control the process. The sequences repeat until the end of the control.
Figure 2-5: Analog PID output diagram [adapted from Labtech Notebook reference manual, 1992] Figure 2-5 shows the Analog PID output diagram. The PID algorithm is shown below [21].
O(t) = P * e(t) + I e(t')dt' + D * dt
where O(t) e(t) P I D = output value,
= error (defined as desired setup value - input value),
= Proportional constant, = Integral constant, and = Derivative constant
The values of P, I, and D determine the performance of the control. The steps to determine the optimum values of P, I, and D are listed in [21]. Because concrete is a complicated material, it is very difficult to determine the optimum P, I, and D values. For simplicity, we set I and D to zero and find the value of P which allows the cycle to approach equilibrium without overshooting the set point. From our initial work, the appropriate value of P is found to be 3. Thus, in this control process, P is set to 3 while I and D are set
to 0.
For the temperature control, the desired temperature will be set initially while the value of temperature at a particular moment will control the next microwave power level. The control algorithm will calculate the output value based on the desired temperature and the temperature at the moment. Then, the output value will be sent to control the microwave power to heat up the product. The setup value will be equal to the desired temperature divided by the scale factor of the product temperature which is 200
C per volt. Therefore, if the desired temperature is at 800C, the setup value will be equal to 4.
In addition to setting the desired setup value to control the microwave power, it is also necessary to set the microwave percent power control which is located on the front panel of the microwave oven. The microwave percent power control is used as a power adjustment in manual control. In this work, when the microwave percent power control is set, for example to 50% or 600 watts, it will be referred to as "Max@600W." It is noted that even though the microwave percent power control is set to a certain value, the experimental results show the maximum power level does not agree with the set value. For example, if the microwave percent power control is set to 800 watts, the maximum power may turn out to be at 1200 watts instead. This is a limitation of the oven we employed.
2.3.3 Specimen preparation and curing process
Nine 3-inch by 6-inch specimens are casted in each batch. Six of them casted in polyethylene moulds are microwave-cured while the rests of them casted in plastic moulds are cured normally. To monitor the internal temperature, a probe is inserted in one of the microwave-cured specimens. In most of the mixing, thirty minutes after water is mixed with cement, sand and pea gravel, microwave energy is applied for 45 minutes unless indicated otherwise. The specimens except the one with the probe are then removed from the oven and covered with plastic sheets. At 3.5 hours after mixing, three microwave-cured specimens are removed from the moulds and capped for compression test at 4.5 hours. The rest of the specimens including the normal-cured specimens are then removed from the moulds after one day and cured in saturated-lime water at 23 + 1.70C (or 73.4 + 30F), according to ASTM C 192-90a, for 6 more days until testing.
For concrete with air-entraining admixture, nine 3-inch by 8-inch specimens are casted in each batch. Five of them are cured with the microwave energy. Temperature probe is not used in this experiment. To compare with the 14-days strength of normally cured concrete, the strength of microwave-cured concrete is measured at 4.5 hours and 14 days.
2.4
Results and Discussion
Mortar specimens with various heating rates are first investigated. Then, the trends identifying the optimal process for microwave-cured mortar specimens can be used to obtain the optimal process for microwave-cured concrete. After the optimal microwave process is determined for regular concrete, the investigation on the use of superplasticizer to obtain even higher early strength is performed. Lastly, concrete specimens with air-entraining admixture are investigated.
2.4.1 Mortar specimens
For mortar specimens with 0.50 w/c, five cases are investigated as follows:
* Case I: Constant power at 412 watts for 45 minutes
* Case II: Feedback temperature control at 600C for 90 minutes (P=3 and "Max@600W")
* Case III: Feedback temperature control at 500C for 20 minutes and at 800C for 25 minutes (P=3 and "Max@800W" for both)
* Case IV: Feedback temperature control at 800
C for 45 minutes (P=3 and "Max@1200W")
* Case V: Constant power at 800 watts for 20 minutes and Feedback temperature control at 800C for 25 minutes (P=3 and "Max@800W")
It should be noted that the 412-watt power used in Case I is the accurate value of power recorded in the computer when the dial on the oven is set to 400 watts. In earlier works ([35], [22] and [23]), this power level is referred to as 400 watts. To be more accurate, the value of 412 watts is used here.
1400
delay time = 35 minutes for Case IV
1200 Case V 1000 Case IV 800 - Case III 0 a 600 - Case I 400 Case II 200 0 0 10 20 30 40 50 60 70 80 90
Time during microwave heating (minute)
Figure 2-6: Power history plots for microwave-cured mortar specimens of Cases I, II, III, IV, and V (Time in x-axis = time during microwave processing)
Figure 2-6 shows the power histories of these cases while the plots of the measured temperature during and after microwave application are shown in Figure 2-7.
In Figure 2-7, the second peaks of Cases II, III, and IV occur at 45, 0, and -30 minutes after removal for capping, respectively. It is noted that -30 minutes after removal for capping means that 30 minutes before removing for capping. The temperature histories after microwave application of Cases I and V are not reported here because Case I is the optimal case for microwave process at a constant power [22] while the specimens in Case V are overheated.
The results of compressive strength at early and later stage of these cases are illustrated in Table 2.2 and Figure 2-8. It is clear that the results of Cases I and IV are similar but better than those of the others. The percent early strength gain of microwave-cured specimens of Case IV is higher than those of Cases II and III due to the fact that the second peak of Case IV occurs about 30 minutes before the time that the specimens are removed for capping which actually allows higher early strength development before the testing time. At
120
Time (minute)
240
Figure 2-7: Temperature history plots for microwave-cured mortar specimens of Cases I, II, III, IV, and V (Time in x-axis = time during and after microwave processing)
later age, the strength development mostly depends on the rate of heating.
For Case V, its heating rate is so high that the rate of strength development is low. By examining the specimens visually, there are some expansions on the surfaces owing to the result of rapid heating at the beginning. If the specimens experience too high a temperature, it will result in low strength development due to the increased microcracks and pores. The results in Figure 2-7 show that temperature of 800C or above is
unfavorable to the strength development of the mortar specimens.
For comparison, the average powers during the 45-minute microwave process of Cases I and IV are 412
and 403 watts, respectively. It is clear that Case IV requires slightly less microwave energy than Case I;
therefore, Case IV is the optimal case for microwave process of mortar with feedback temperature control and process with constant power level.
It is therefore important to highlight the findings from these mortar cases as follows:
Case
II
-- 4 Time to remove for capping
Case III Time to test
SCas I for early
strength
Table 2.2: Results of the effect of heating rate on the compressive strength development (at 4.5 hours and 7 days) of 0.50 w/c mortar specimens under microwave curing for Cases I, II, II, IV, and V
W/C Microwave Curing -MCWC Normal Curing - NC
Case # ratio 4.5 hours 7 days 7 days
by Wt Compr. NC 7-day Compr. NC 7-day Compr. NC 7-day before Strength Comp. Str. Strength Comp. Str. Strength Comp. Str.
MCWC (psi) (%) (psi) (%) (psi) (%)
I 0.50 1874.5 30.0 4077.9 65.3 6242.5 100
II 0.50 709.7 11.1 5708.4 89.5 6380.3 100
III 0.50 1364.7 21.1 4583.7 71.0 6458.2 100
IV 0.50 1857.5 27.3 4808.8 70.7 6805.9 100
V 0.50 1374.6 21.2 2666.7 41.2 6468.8 100
* By allowing the appropriate time (in this experiment, around 30 minutes) for specimens reaching the second peak, high strength at early time can be obtained.
to cure after
* The strength development can be interrupted enormously if the rate of heating is too high and if the internal temperature of specimen during the microwave heating is above 800C.
2.4.2 Concrete specimens
For regular concrete, (i) the effect of heating rate (with temperature probe), (ii) the process with discrete power (with temperature probe), and (iii) the effect of temperature probe are investigated.
Effect of heating rate (with temperature probe)
To bring the findings from mortar to concrete, the feedback temperature control at 800C for 45 minutes with "Max@412W" is employed (Case TCC1). Other cases (TCC2, TCC3 and TCC5). are also carried out for comparison. It is desirable to use "Max@412W" for Case TCC1 of concrete instead of "Max@800W" as Case IV of mortar because with "Max@800W", the maximum power is actually at 1200 watts which is believed to be too high for concrete microwave processing.
Case TCC2 is the process with constant power at 412 watts for 45 minutes while Case TCC3 uses the same power history obtained from Case TCC1 but reverse it before use (see Figure 2-9). Actually, the
100.0 100.0 100.0 100.0 100.0 100.0 89.5 o 80.0 ® 71.0 70.7 165.3 60.0 e 41.2 *z 40.0 ' 30.0 20.0 i 0 11.1 dP 0.0
Case I Case II Case III
Case number
Case IV Case V
S4.5-hour MCWC I 7-day MCWC U 7-day NC
Figure 2-8: Results of the effect of heating rate on the compressive strength development (at 4.5 hours and
7 days) of 0.50 w/c mortar specimens under microwave curing for Cases I, II, III, IV, and V
average power during 45 minutes of microwave processing for Case TCC3 which is 321 watts is a little lower than that of Case TCC1 which is 336 watts because of the inaccuracy of the scale factor at the high power of the analog output for microwave power which is used to control microwave power. (Note: with the output data stored in an output file in the computer, the analog output device will convert it to analog format and send the signal to control the microwave power level.)
Case TCC5 uses the feedback temperature control at 850C for 45 minutes with "Max@1200W" allowing
higher rate of heating. The power histories for these cases are shown in Figure 2-9. Since the temperature probe has been used in all of these cases, the temperature histories during and after microwave heating can be plotted as illustrated in Figure 2-10.
In Table 2.3 and Figure 2-11, it is obvious that the result of Case TCC1 is better than those of Cases
TCC3, and TCC5 but slightly better than that of Case TCC2. Its early (4.5 hours) and later (7 days) strength
of microwave-cured specimens are as high as 59.1% and 94.9%, respectively, based on the 7-days strength of the normally cured specimens while those of Case TCC2 are 62.5% and 87.1%.