Discriminating raining from non-raining clouds at mid-latitudes using Meteosat Second Generation daytime data
21
0
0
Texte intégral
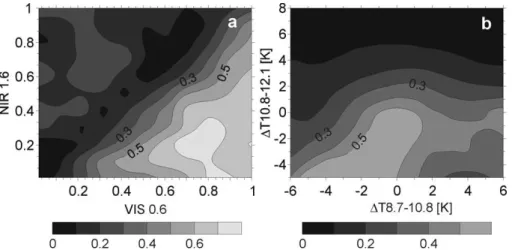
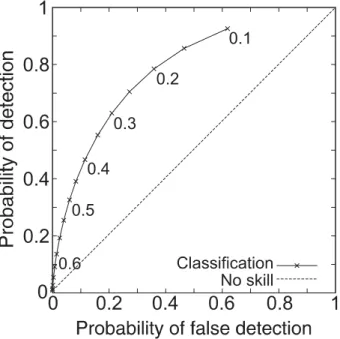
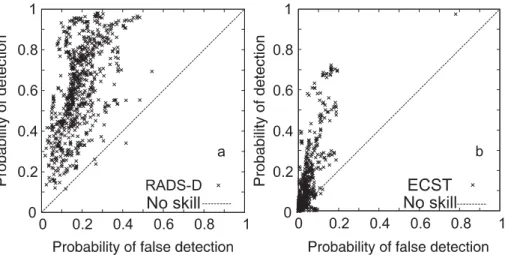
Figure

+2

Documents relatifs