HAL Id: hal-03018340
https://hal.archives-ouvertes.fr/hal-03018340
Preprint submitted on 22 Nov 2020
HAL is a multi-disciplinary open access
archive for the deposit and dissemination of sci-entific research documents, whether they are pub-lished or not. The documents may come from teaching and research institutions in France or abroad, or from public or private research centers.
L’archive ouverte pluridisciplinaire HAL, est destinée au dépôt et à la diffusion de documents scientifiques de niveau recherche, publiés ou non, émanant des établissements d’enseignement et de recherche français ou étrangers, des laboratoires publics ou privés.
Michael Hochberg
To cite this version:
Michael Hochberg. Countries should aim to lower the reproduction number close to 1.0 for the short-term mitigation of COVID-19 outbreaks. 2020. �hal-03018340�
Countries should aim to lower the reproduction number
𝓡 close to 1.0 for
the short-term mitigation of COVID-19 outbreaks
Michael E. Hochberg
ISEM, University of Montpellier, CNRS, IRD, EPHE, Montpellier, France Santa Fe Institute, Santa Fe, New Mexico, USA
michael.hochberg@umontpellier.fr
Abstract
The COVID-19 pandemic is still in its early stages and given the speed and magnitude of local outbreaks it is urgent to understand how mitigation measures translate into changes in key epidemiological and clinical outcomes. Here, we employ a mathematical model to explore the short-term consequences of lowering the reproduction number ℛ0 and delaying measures on total infections and fatalities. The positive implications of mitigation generally accrue as these measures are adopted early, with the most striking effects seen when the reproductive number is lowered to a level ℛC≈1.0. As the delay in adopting measures exceeds approximately the half-way point to the peak of an outbreak, the effects of lowering ℛ0 markedly decrease. Aiming for reproduction numbers close to 1.0 can substantially reduce fatality probabilities over short time scales, particularly for larger populations. We conclude that research is urgently needed on how mitigation measures impact ℛ0 and how these can be optimized so as to achieve ℛC≈1.0 whilst supporting individual freedoms, society and the economy.
Introduction
As of April, 2020, COVID-19 is continuing to spread in many countries despite dedicated measures. Persistent spread could reflect multiple factors, including insufficient physical distancing or incomplete adoption of those measures, delays in outbreaks between areas within a given country, and inhomogeneities in local contact networks (1,2). Because of the explosive nature of new cases in the exponential growth phase of COVID-19, data may be incomplete and can lag behind their potential use in making important decisions for curbing outbreaks. Modeling analyses are central in this regard, since they can evaluate different scenarios to achieve the interlocked objectives of preserving health services, reducing individual morbidity and mortality, while maintaining social freedoms. Numerous promising avenues have been explored, and can be broadly characterized as conceptual tools for understanding outbreaks and for proposing control strategies, and more tactical instruments for actually applying strategies (e.g., 3-13).
We previously simulated a simple SEIR model (14) to evaluate how short-term ‘bang-bang’ suppression-mitigation strategies could establish the conditions for a longer-term approach. A longer-term approach would integrate medicine (e.g., repurposed drugs, antibody transfusions, vaccines), technology (e.g., cell phone apps) and infrastructure (dedicated institutions) to reduce outbreaks and increase normalcy. The analysis showed that reacting insufficiently or increasingly late to an outbreak meant the need to enact more stringent ‘suppression’ measures to obtain a given level of reset in the numbers of infectious individuals. We found that this reset level, in turn, was crucial to how subsequent ‘mitigation’ measures could manage an outbreak. Importantly, approximate target levels were identified for lowered reproductive numbers, ℛ, that correspond to the rate of change in new cases.
More generally, a sequence of targets was proposed, based empirical observations of how countries have initially dealt with outbreaks, and a simple rational approach for future outbreak management. The sequence of targets that are being adopted – with each successive step following the perceived failure of the previous set of measures – take the symbolic form: (1) ℛ0 à (2) ℛC<ℛ0 à (3) ℛC<<1.0 à (4) ℛC≈1.0 à (5) ℛC<1.0, where ℛ0 is the basic reproductive number at the start of an outbreak (15) and ℛC is the level of ℛ that suppression or mitigation tactics strive to achieve in order to reduce the burden of an outbreak or meet specific objectives. Note that with the possible exception of a given country adopting or modifying measure packages engaged in other countries, governments do not know beforehand
exactly what a given set of measures will achieve in terms of precise reductions in ℛ0 and the corresponding impacts on the outbreak. Many countries – for example, Italy, France, Spain, Germany and the United States – are currently in the second (suggested mitigation measures, e.g., social distancing, quarantining...) or third (enforced lockdowns) phase of this simple suite of strategies. A successful step 2 that actually results in ℛC<1.0 may take the country directly to step 4, or possibly step 5, the latter which also seeks ℛC<1.0, but does so through less socially burdensome measures, such as the introduction of repurposed drugs and vaccination.
We explore the short-term consequences of lowering ℛ0 (referred to hereafter as ‘mitigation’) and of delaying measures on the impacts of outbreaks in terms of the number of individuals eventually infected by the virus and fatalities. We find that the positive implications of mitigation accrue as these measures are adopted early, with the most striking effects as ℛCà1.0. As the delay exceeds approximately the half-way point to the peak of an outbreak, the effects of lowering ℛC decrease. Finally, we show that lowering ℛCà1.0 can substantially lower fatalities over fixed time scales, particularly for larger populations. We conclude that research is urgently needed on how measures impact ℛ0 and how these can be optimized so as to achieve ℛC≈1.0, whilst supporting individual freedoms, society and the economy.
Model
We employ a modified SEIR model of Susceptible (S) → Exposed (E) → Infectious (I) → Removed (R) states (15). The ordinary differential equations take the form:
𝑑𝑆 𝑑𝑡 = −b 𝐼𝑆 𝑁 𝑑𝐸 𝑑𝑡 = b 𝐼𝑆 𝑁 − 1 𝑇/01 𝐸 𝑑𝐼 𝑑𝑡= 1 𝑇/01 𝐸 − 𝛾𝐼 𝑑𝑅 𝑑𝑡 = 𝛾𝐼,
where N is a constant equal to S+E+I+R, b is the transmission parameter, Tinf is the infectious period, 𝛾 is the rate of removal into different subclasses of R, including mild cases, severve cases and fatalities. Specifically, here we focus on fatalities 𝐶6, given by
𝑑𝐶6
𝑑𝑡 = 𝑃6 𝛾 𝐼 − 𝐶6
𝐷6 ,
where 𝑃6 is the case fatality rate and 𝐷6 is the time from end of incubation to death (Titod) minus duration of infectiousness (Tinf).
An outbreak occurs if the basic reproduction number, ℛ0 = b / 𝛾 > 1.0. The impact of control measures is easily understood by their impact on ℛ0, and in the presentation below, we refer to these effects by percent reductions in ℛ0, yielding the modified constant value, ℛC.
Numerical methods
The details of the numerical methods are described in (14). Briefly, the above model is an over-simplified representation of COVID-19 outbreaks. The purpose of its use is to generate first approximations of how mitigation efforts modeled by the proxy parameter ℛC could quantitively translate into the attenuation of outbreaks. Linking specific measures to their influence on key epidemiological parameters will be important in the future management of COVID-19.
The influences of reductions in ℛ0 on key epidemiological parameters were investigated using the Epidemic Calculator package (16) (Supplementary Material). This platform enables the user to set the parameters under focus here, namely, the total population size (N), the initial sub-population of infections individuals (I), the basic reproduction number (ℛ0), the day on which the mitigation measures begin and the resulting (lowered) reproduction number (ℛC). The platform produces output in a display that the user can consult by clicking on the day or period of interest (Figure 1). As discussed in 14, the accuracy of the Epidemic Calculator package has not been extensively tested, and the platform has several shortcomings. Caution is therefore necessary in interpreting the results presented below.
The model parameter values employed in this study are presented in Table 1. Estimates of ℛ0 for COVID-19 vary approximately four-fold from c.1.5 to 6.5 (17-20), and we adopt a modal value of 2.5. Although the quantitative model predictions differ for lower and higher values of ℛ0 in the observed range, the qualitative patterns remain the same.
Results
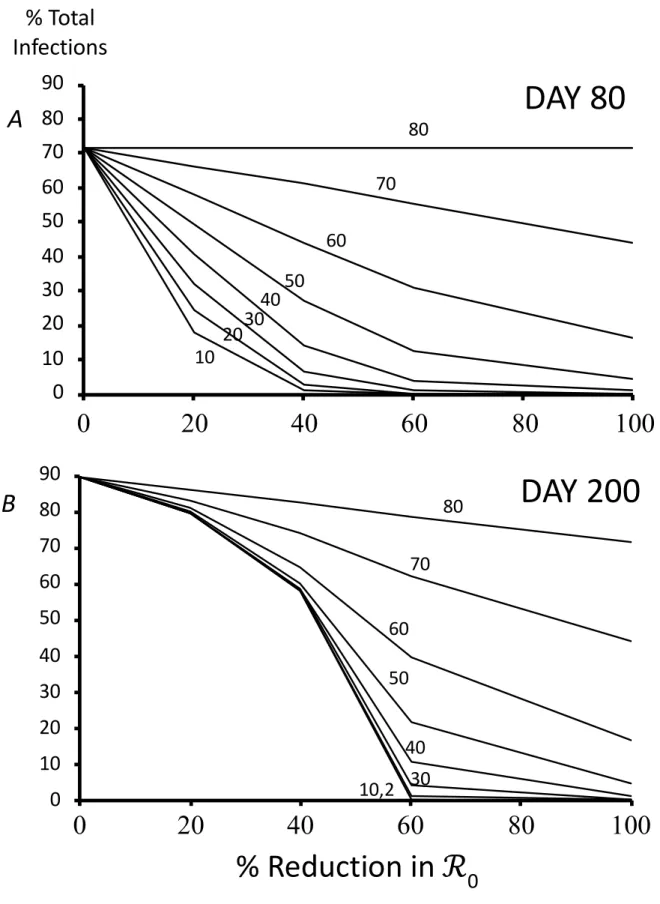
The fraction of the population infected by SARS-CoV-2 depends on the start day of mitigation measures, the time horizon, and the impact of measures on ℛ0 (Figure 2). As expected, delaying intervention results in larger fractions of a population infected at any given time, and infected levels are lower for the shorter (80 day) compared to the longer (200 days) time horizons. However, the differences between the two time-horizons decrease as impacts on ℛ0 increase (cf. values beyond a 60% decrease in ℛ0 – corresponding to ℛC≲1.0 – in Figs. 2A,B). Note too that sensitivity to start date increases as the time horizon decreases, but this effect is most appreciable for intermediate reductions in ℛ0 (e.g., cf. 20% to 40% reduction in Figs.
2A,B). In other words, whereas achieving 1.5≲ ℛC<ℛ0 – if commenced early – can result in a substantial reduction in total infections by day 80 (Fig. 2A), the effect is largely erased on the longer time horizon of 200 days (Fig. 2B). Interestingly, small delays in starting mitigation measures from the start of a simulation may make little difference to the total number eventually infected. This effect is most noticeable between start days 10 and 30, as mitigation exceeds a 60% or greater decrease in ℛ0 (i.e., ℛC≲1.0), and for the longer time window of 200 days. Note that the lack of sensitivity between start days for lower mitigation in Fig. 2B can be explained by the fact that the epidemic is virtually complete by 200 (see Fig. 1). These results thus underscore how attaining mitigation objectives is contingent on the time frame, with rapid responses having short term benefits for a range of mitigation levels (Fig. 2A), whereas they have disproportionately higher benefits in the longer-term only for sufficiently pronounced mitigation levels (Fig. 2B).
Lives saved by mitigation measures is influenced by the same factors considered above, but in an inverse way compared to total infections (cf. Figs. 2,3). Notably, reductions in ℛ0 approaching and exceeding 60%, corresponding to ℛC≲1.0, have major benefits to reducing fatalities, particularly when measures are started with minimum delays (Fig. 3). Delays of 40 or more days never exceed saving more than 50% of lives that would have been lost without measures, even if the reproduction number is lowered by 100% to 0.0. As for the total number of individuals infected, the shortcomings of insufficient impacts on ℛ0 accrue with time (cf. 20%-40% reductions in Figs. 3A,B).
Our previous work suggested that population size was important in the impact of mitigation measures (14). We find that the fraction of lives saved in a given time frame can be strongly associated with population size (Figure 4). The sensitivity in fatality reduction is maximal
intermediate reductions in ℛ0. For example, an individual who would have died in the first 80 days without mitigation measures has a virtually 100% chance of surviving based on mitigation measures that reduce ℛ0 by 40% or more, and if living in a population with c.1 billion inhabitants. In contrast, survival chances drop below 50% under the same conditions in a population of c.100,000 individuals. Similar to the observations in the previous paragraphs, longer mitigation time frames require stronger impacts on ℛ0 to achieve equivalent benefits of shorter ones in terms of the percentage of lives saved (cf. Figs. 4A,B).
Conclusions
The results support the patterns observed in our previous study showing how lowering ℛ0 to approximately 1.0 is a sensible strategy for mitigating outbreaks on time scales of several weeks to several months (14). Measures falling too short of the ℛC≈1.0 target can mean substantially diminished outcomes and the likelihood that additional measures are needed to mitigate the outbreak. This is in effect what we have observed in different countries, where sensible, but untested measures such as physical distancing, travel restrictions, washing hands frequently, coughing or sneezing away from others, and self-quarantining were insufficient in stemming new cases on time scales of days to weeks (21). On the other hand, further reductions below ℛC≈1.0 may have specific objectives (e.g., steps 3 and 5 in the Introduction section), but come with increased constraints to personal freedoms and costs to the economy.
Our previous work suggested that population size was an important parameter in how an outbreak unfolds and the impact of mitigation measures (14). We found that larger populations benefit more in terms of percentage reduced fatalities than do smaller populations. This can be explained in part because the same initial number (10000) of infectious individuals was used in all simulations, meaning that smaller countries were effectively further along in their outbreaks than were more populous ones. Nonetheless, this result and the findings of our previous study indicate that – all else being equal – larger populations have more time to reduce morbidity and mortality in outbreaks than do smaller ones. This insight could apply either to the homogenous populations assumed here, or to spatially subdivided ones, where we would expect delays in outbreaks between different localities. Further investigation is needed to establish how country size may correlate with other potentially important epidemic parameters such as population density and the age and spatial structure of contact networks.
We conclude that the key short-term target of mitigation measures is to lower the reproductive number as close as possible to 1.0, but that values slightly above are acceptable, especially if the numbers of circulating cases is very low. Mitigation measures engaged once an outbreak approaches its peak will have substantially less impact on infections and lessened fatalities than when started early. Given that different combinations of measures and their detailed deployments will influence ℛ, empirical and modeling research is urgently needed to establish optimal packages that prioritize those measures also sustaining individual freedoms, society and the economy.
Acknowledgements
I thank the members of the EEC research team at the Institute for Evolutionary Sciences and Joshua Weitz for discussions.
References
1. Davies N.D. et al. 2020. medRxiv 10.1101/2020.03.24.20043018
2. Keeling M.J. & Eames K.T.D. 2005. J Roy Soc Interface. DOI:10.1098/rsif.2005.0051 3. Wu J.T. et al. 2020. The Lancet. DOI:10.1016/S0140-6736(20)30260-9
4. Prem K. et al. 2020. The Lancet Public Health. DOI:10.1016/S2468-2667(20)30073-6 5. Kraemer M.U.G. et al. 2020. Science. DOI:10.1126/science.abb4218
6. Tian H. et al. 2020. medRxiv 10.1101/2020.01.30.20019844
7. Hellewell J. et al. 2020. The Lancet Glob. Health. DOI:10.1016/S2214-109X(20)30074-7 8. Morris D. et al. 2020. OSFPrepints DOI:10.31219/osf.io/9gr7q
9. Miller I.F. al. 2020. medRxiv DOI:10.1101/2020.04.05.20054700 10. Weitz J.S. et al. 2020. medRxiv DOI:10.1101/2020.04.01.20049767 11. Ferguson N.M. et al. 2020. Retrieved from
https://www.imperial.ac.uk/media/imperialcollege/medicine/sph/ide/gida-fellowships/Imperial-College-COVID19-NPI-modelling-16-03-2020.pdf
12. Walker P.G.T. et al. 2020. Retrieved from
https://www.imperial.ac.uk/media/imperialcollege/medicine/sph/ide/gida-fellowships/Imperial-College-COVID19-Global-Impact-26-03-2020v2.pdf
13. Flaxman S. et al. 2020. Retrieved from
https://www.imperial.ac.uk/media/imperialcollege/medicine/sph/ide/gida-fellowships/Imperial-College-COVID19-Europe-estimates-and-NPI-impact-30-03-2020.pdf
14. Hochberg M.E. 2020. medRxiv DOI: 10.1101/2020.03.31.20048835
15. Anderson R.M. & R.M. May. 1992. Infectious Diseases of Humans: Dynamics and Control. OUP 16. Accessed at http://gabgoh.github.io/COVID/index.html on April 14th, 2020
17. Li Q. et al. 2020. N Engl J Med. DOI:10.1056/NEJMoa2001316 18. Wu J.T. et al. 2020. The Lancet. DOI:10.1016/S0140-6736(20)30260-9 19. Park S.W. et al. 2020. medRxiv DOI:10.1101/2020.01.30.20019877 20. Liu, Y. et al. 2020. J. Travel Med. DOI:10.1093/jtm/taaa021
Parameter Value
Basic Reproduction Number (ℛ0) 2.5
Removal rate (g ) 1/5.2 days
Duration patient is infectious (Tinf) 2.9 days
Case fatality rate (𝑃6 ) 0.02
Time from end of incubation to death (Titod) 32 days
Table 1. Parameters and their baseline values employed in this study. See (16) and main text for details on
parameter value sources.
Figure 1. Visualization of output from the Epidemic Calculator (16), showing daily numbers of currently
infectious individuals and cumulative fatalities in a population of 7 million. Statistics for Day 80 shown on the left. Initial number of infectious individuals=100. Other parameter values in Table 1.
Figure 2. Effect of mitigation measures (represented as % reductions in ℛ0), number of days elapsed before mitigation
begins (numbers next to lines), and number of days of the simulation (A 80 days; B 200 days), on the percentage of the population infected. At ℛ0, we observed 72% of the population had been infected at 80 days and 89% at 200 days.
Lines connecting points at 0, 20, 40, 60 and 100% reduction in ℛ0 aid visualization. Assume population of 7 million
inhabitants and 100 initial number infectious cases. Other parameters as in Table 1.
0
10
20
30
40
50
60
70
80
90
0
10
20
30
40
50
60
70
80
90
B
% Total
Infections
A
DAY 80
DAY 200
10
20
30
40
50
60
70
80
10,2
0
30
40
50
60
70
80
0
20
40
60
80
100
% Reduction in ℛ
0
0
20
40
60
80
100
Figure 3. Effect of mitigation measures (represented as % reductions in ℛ0), number of days elapsed before
mitigation begins (numbers next to lines), and number of days of the simulation (A 80 days; B 200 days), on the percentage of fatalities averted compared to no mitigation measures. Assume population of 10 million and 10,000 initial infectious individuals. At ℛ0, we observed 111,437 deaths at 80 days and 177,756 at 200
days. Lines connecting points at 0, 20, 40, 60 and 100% reduction in ℛ0 aid visualization. Other parameters
0
25
50
75
100
0
25
50
75
100
0
20
40
60
80
100
DAY 80
0
20
40
60
80
100
% Reduction in ℛ
0
DAY 200
% Reduction in
Fatalities
B
A
10
20
30
40
50
10
20
30
40
50
Figure 4. Effect of mitigation measures (represented as % reductions in ℛ0), population size (letters next to
lines), and number of days of the simulation (A 80 days; B 200 days), on the percentage of fatalities averted compared to no mitigation measures. a=1 billion, b=100 million, c=10 million, d=1 million, e=100 thousand individuals. Assume 10,000 initial infectious individuals. At ℛ0, we observed 111,437 deaths at 80 days and
177,756 at 200 days. Lines connecting points at 0, 20, 40, 60 and 100% reduction in ℛ0 aid visualization.