Publisher’s version / Version de l'éditeur:
Questions? Contact the NRC Publications Archive team at
PublicationsArchive-ArchivesPublications@nrc-cnrc.gc.ca. If you wish to email the authors directly, please see the first page of the publication for their contact information.
https://publications-cnrc.canada.ca/fra/droits
L’accès à ce site Web et l’utilisation de son contenu sont assujettis aux conditions présentées dans le site LISEZ CES CONDITIONS ATTENTIVEMENT AVANT D’UTILISER CE SITE WEB.
Research Report (National Research Council of Canada. Institute for Research in Construction), 2008-09-12
READ THESE TERMS AND CONDITIONS CAREFULLY BEFORE USING THIS WEBSITE.
https://nrc-publications.canada.ca/eng/copyright
NRC Publications Archive Record / Notice des Archives des publications du CNRC :
https://nrc-publications.canada.ca/eng/view/object/?id=81b96a15-0d81-4a0e-97a1-9dae29c1bdce https://publications-cnrc.canada.ca/fra/voir/objet/?id=81b96a15-0d81-4a0e-97a1-9dae29c1bdce
NRC Publications Archive
Archives des publications du CNRC
For the publisher’s version, please access the DOI link below./ Pour consulter la version de l’éditeur, utilisez le lien DOI ci-dessous.
https://doi.org/10.4224/20375040
Access and use of this website and the material on it are subject to the Terms and Conditions set forth at
International Road Tunnel Fire Detection Research Project - Phase II Summary
http://irc.nrc-cnrc.gc.ca
International Road Tunnel Fire Detection Research Project - Phase II
Summary of International Road Tunnel Fire Detection Research Project -
Phase II
R R - 2 7 4
L i u , Z . G . ; K a s h e f , A . ; L o u g h e e d , G . D . ; C r a m p t o n , G . P . ; G o t t u k , D .Sept. 12, 2008
The material in this document is covered by the provisions of the Copyright Act, by Canadian laws, policies, regulations and international agreements. Such provisions serve to identify the information source and, in specific instances, to prohibit reproduction of materials without written permission. For more information visit http://laws.justice.gc.ca/en/showtdm/cs/C-42
International Road Tunnel Fire Detection Research Project – Phase II
Summary of International Road Tunnel Fire Detection
Research Project – Phase II
Prepared by
Z. G. Liu, A. Kashef, G. Lougheed, and G. Crampton
National Research Council of Canada, Ottawa, Canada
Daniel T. Gottuk
Hughes Associates, Inc., Baltimore, USA
International Road Tunnel Fire Detection Research Project – Phase II
Project Technical Panel
Frank Gallo, Port Authority of New York and New Jersey Harry Capers, New Jersey DOT
Alexandre Debs, Ministry of Transportation of Quebec Jesus Rohena, Federal Highway Administration
Paul Patty, Underwriters Laboratories Inc. Volker Wetzig, Versuchs Stollen Hagerbach AG Art Bendelius, A & G Consultants
Bill Connell, Parsons Brinckerhoff
Margaret Simonson, Swedish National Testing and Research Institute Gary English, Seattle Fire Department
Peter Johnson, ARUP Fire Risk & Security Jim Lake, NFPA staff liaison
Principal Sponsors
Ministry of Transportation of British Columbia Ministry of Transportation of Ontario
Ministry of Transportation of Quebec
The City of Edmonton, Transportation Department, Transit Projects BranchAxonX LLC
Siemens Building Technologies Tyco Fire Products
VisionUSA
Sureland Industrial Fire Safety
United Technologies Research Corporation
Contributing Sponsors
National Research Council of Canada
Port Authority of New York and New Jersey A & G Consultants
PB Foundation Micropack, Inc.
ACKNOWLEDGEMENTS
The project was conducted under the auspices of the Fire Protection Research Foundation (FPRF). The authors would like to acknowledge the support of the Technical Panel, project sponsors as well as many NRC staff to this project. The authors would also like to acknowledge Professor G. Hadjisophocleous and Ms. Y. Ko of Carleton University for their contributions to computer modeling study in the project. A special acknowledgement is noted to Kathleen Almand of the FPRF for her contribution in managing the project. In addition, the Ministry of Transportation of Quebec and the Port Authority of New York and New Jersey are recognized for their contribution of resources and time, particularly Alexandre Debs, Joe Agosta, Tom Connors and Alex Ang.
1. INTRODUCTION
This report provides a summary for Phase II of the International Road Tunnel Fire Detection Research Project. The test conditions and research findings of the project are summarized and recommendations for future research on fire detection technologies for tunnel applications are made.
The major research activities of the project were conducted in the period from 2006 to 2007, with support of government organizations, industry and private sector organizations. The main objectives of the study were to:
• Investigate the performance attributes of current fire detection technologies for roadway tunnel protection;
• Provide technical information/data for use in the development of performance criteria, guidelines and specifications for tunnel fire detection systems; and
• Provide technical data to help optimize technical specifications and installation requirements for applications.
Seven tasks were carried out as part of the project. They included:
• Task 1: Identify currently available fire detection technologies, and develop appropriate design fire scenarios and test protocols for evaluating the performance of road tunnel detection systems;
• Task 2: Conduct full-scale fire tests in a laboratory tunnel facility to investigate the performance of the fire detection systems for tunnel fire scenarios;
• Task 3: Analyze technical data and conduct numerical simulations to help understand and optimize the technical specifications and installation requirements for the application of fire detection technologies in road tunnels;
• Task 4: Conduct full-scale fire tests in the Viger Tunnel in Montreal to investigate the performance of the fire detection systems in a real tunnel environment.
• Task 5: Evaluate the effect of a tunnel working environment on performance of the detection systems in the Lincoln Tunnel near New York City for one year; • Task 6: Conduct demonstration fire tests in the Lincoln Tunnel near New York
City to document the response of the detection systems when exposed to a set of controlled test fires;
• Task 7: Conduct full-scale fire tests in a laboratory tunnel facility to study effects of longitudinal ventilation conditions on the performance of the fire detection systems.
2. TEST
TUNNELS
Full-scale fire tests were carried out in the Carleton University laboratory research tunnel that is located at the site of the National Research Council (NRC) full-scale fire test facilities and in the Carré-Viger Tunnel, which is an operating road tunnel in Montreal. The demonstration and environmental tests were conducted in the Lincoln Tunnel in New York City.
The laboratory tunnel facility is 37.5 m long, 5.5 m high and 10 m wide (representing a three-lane roadway) [2]. It has two end doors, one large side door to an adjacent burn hall at the West end of the tunnel, two side louvers at the East end of the tunnel, and a number of observation windows located in the North wall of the tunnel. It also has five ceiling openings located near the West end of the tunnel, which can be used to vent smoke and air through a duct and fan system.
The Carré-Viger Tunnel in Montreal is a road tunnel. The section of the tunnel used in the tests is 400 m long, 5 m high and 16.8 m wide (representing 4 lanes). The tunnel is equipped with four jet fans for longitudinal ventilation [6].
The south tube of the Lincoln Tunnel was used for demonstration and environmental tests [5]. The tunnel has two lanes of traffic. The tunnel is 2,441 m long bringing eastbound traffic from NJ to NY. The construction of the tunnel consists of a roadway section 6.6 m wide and 4.15 m high within a 9.5 m diameter cast iron drum ring with interior concrete lining. Above and below the roadway are air plenums used for full transverse ventilation. The air is supplied low along the roadway curbs and exhausted at the ceiling. The interior walls and ceiling consist of ceramic tile on concrete.
The south tube of the Lincoln Tunnel accommodates all types of vehicles, except heavy goods vehicles. The average daily traffic volume is about 44 thousand vehicles with roughly equal traffic in both lanes. Slow moving and stopped traffic frequently occur. Vehicle speeds range from below 15 to 100 km/h. Typically, the traffic speed is about 30 km/h.
3. DETECTION
SYSTEMS
Nine fire detection systems that were representative of currently available fire detection technologies for use in tunnel were evaluated in the project [1]. These systems were:
1. D-1L1: a fiber optic linear heat detection system; 2. D-2L2: a co-axial cable linear heat detection system; 3. D-3F1: a IR3 optical flame detector;
4. D-4C1: a flame/smoke video image detection (VID) system; 5. D-5C2: a flame/smoke video image detection (VID) system; 6. D-6C3: a flame video image detection (VID) system;
7. D-7H1: a pneumatic and spot-type heat detection system; 8. D-8H2: a rate-anticipation spot heat detector; and
9. D-9S1: a smoke detection system with air sampling.
The fire detection systems were installed in the tunnels by the system suppliers. The configuration and installation of the fire detection systems in the laboratory tunnel were based on the design of a system to protect an operating road tunnel. The installation configuration was not changed during the tests. The sensitivity levels or alarm thresholds of five fire detection systems (D-1L1, D-6C3, D-7H1, D-8H2, and D-9S1) were not changed during the entire test series. However, the sensitivity levels of the linear heat detection system D-2L2, the optical flame detector D-3F1, the VID system D-4C1, and the function of the VID system D-5C2 were modified by the system suppliers, based on the performance in environmental tests in the Lincoln Tunnel and the results of Task 2 [2]. The detection systems and their sensitivities are summarized in Table 1.
Investigations on the performances of the fire detection systems in the project were focused on both their detection capability in fire incidents, including response times to a fire and ability to locate and monitor a fire in the tunnel as well as their reliability in harsh tunnel environments, including their nuisance alarm immunity and requirements for maintenance.
All nine detection systems were evaluated in the tests carried out in Tasks 2 and 7 conducted in the laboratory tunnel facility. Six fire detection systems (D-1L1 to D-6C3) were involved in the field fire tests of Task 4 conducted in an operating road tunnel in Montreal. Four detection systems (D-3F1, D-4C1, D-6C3, D-9S1) were included in the demonstration and environmental tests in Tasks 5 and 6 conducted in the Lincoln Tunnel. The tasks in which the detector systems were included are summarized in Table 1.
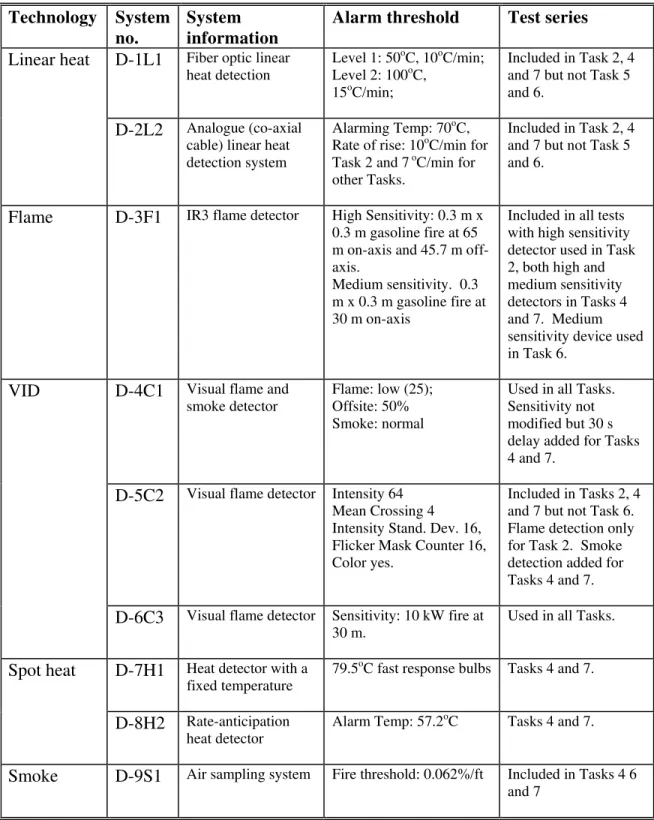
Table 1. Fire Detection Systems in Test Program
Technology System no.
System information
Alarm threshold Test series
D-1L1 Fiber optic linear heat detection
Level 1: 50oC, 10oC/min; Level 2: 100oC,
15oC/min;
Included in Task 2, 4 and 7 but not Task 5 and 6.
Linear heat
D-2L2 Analogue (co-axial cable) linear heat detection system
Alarming Temp: 70oC, Rate of rise: 10oC/min for Task 2 and 7 oC/min for other Tasks.
Included in Task 2, 4 and 7 but not Task 5 and 6.
Flame D-3F1 IR3 flame detector High Sensitivity: 0.3 m x 0.3 m gasoline fire at 65 m on-axis and 45.7 m off-axis.
Medium sensitivity. 0.3 m x 0.3 m gasoline fire at 30 m on-axis
Included in all tests with high sensitivity detector used in Task 2, both high and medium sensitivity detectors in Tasks 4 and 7. Medium sensitivity device used in Task 6.
D-4C1 Visual flame and smoke detector
Flame: low (25); Offsite: 50% Smoke: normal
Used in all Tasks. Sensitivity not modified but 30 s delay added for Tasks 4 and 7.
D-5C2 Visual flame detector Intensity 64 Mean Crossing 4
Intensity Stand. Dev. 16, Flicker Mask Counter 16, Color yes.
Included in Tasks 2, 4 and 7 but not Task 6. Flame detection only for Task 2. Smoke detection added for Tasks 4 and 7.
VID
D-6C3 Visual flame detector Sensitivity: 10 kW fire at 30 m.
Used in all Tasks.
D-7H1 Heat detector with a fixed temperature
79.5oC fast response bulbs Tasks 4 and 7.
Spot heat
D-8H2 Rate-anticipation heat detector
Alarm Temp: 57.2oC Tasks 4 and 7.
Smoke D-9S1 Air sampling system Fire threshold: 0.062%/ft Included in Tasks 4 6 and 7
*For Tasks 5 and 6: There were three algorithms initially utilized, smoke, flame and off-site. The system was initially set up with all algorithms active and set to low sensitivity with a 30 second delay. After the first three months of monitoring, the system was changed on July 13, 2007 at 1:30 pm to use only the off-site algorithm set to medium with a 30 second delay.
4.
FIRE TEST PROTOCOLS AND COMPUTER MODELING
Fire scenarios were developed to evaluate the performance of the fire detection systems in the tests conducted in the laboratory tunnel facility [1]. These fire scenarios included pool fires, stationary vehicle fire and a moving vehicle fire. Three pool fire scenarios were used: open pool fires, pool fires under a simulated vehicle, and pool fires shielded by a simulated vehicle. Two types of stationary vehicle fire scenarios were used: an engine compartment fire and a passenger compartment fire. A brief description of the fire scenarios is as follows:
• Small-unobstructed pool fires. Tests were conducted using gasoline pool fires (~125 kW) using a 0.3 m by 0.3 m pan. The unobstructed gasoline pool fire was placed at different locations in the tunnel during the test series. It was used to investigate the detection capability of the systems to small fires at different distances including the maximum detector distance and coverage areas for the optical based detection systems.
• Pool fires underneath a simulated vehicle. Tests were conducted with four different sizes of gasoline pool fires located under a simulated vehicle. The pan sizes were 0.3 m x 0.3 m, 0.6 m x 0.6 m, 1.0 m x 1.0 m and 1.0 m x 2.0 m. In addition, a propane burner was also used for tests underneath the simulated vehicle. An obstacle, simulating a crashed vehicle, was placed between the fire source and fire detectors mounted on the wall of the tunnel. In this scenario, the simulated vehicle under fire as well as a vehicle between it and the wall-mounted detectors obstructed the view of the fire. The heat output of the fires were ~125-3400 kW as measured using an open calorimeter. The results of the tests indicate that the fire size was limited in the tunnel fire scenarios by the presence of the simulated vehicle under which it was located.
• Pool fires behind a large vehicle. Tests were conducted with the four sizes of pool fires located behind a simulated vehicle. A large plate simulating a large truck was located between the fire and the wall-mounted detectors. These pool fires developed very quickly and reached their maximum heat release rate in a short time (in less than 1 minute).
• Engine compartment fire. Tests were conducted using a simulated vehicle engine compartment. A gasoline fuel pan with a movable lid was placed inside the engine compartment. The dimension of the fuel pan was 1.0 m wide x 2.0 m long x 0.2 m high. During test, the size of the opening of the pan gradually increased to simulate the fire growth rate generated from a real vehicle engine compartment fire. A propane burner was also used to simulate an engine fire. • Passenger compartment fire. A passenger compartment fire (~1,200 kW) was
simulated using wood cribs and plastic foam inside a vehicle mock-up. This fire developed slowly.
• Moving vehicle fire. A small moving vehicle fire was simulated by dragging a fire source using a high-speed winch apparatus. The fire source consisted of a piece of ceramic fibre insulation soaked with gasoline. The heat output of the fire source was approximately 125 kW under stationary conditions. Fire tests were conducted with two different driving speeds (27 km/h and 50 km/h) and two driving directions relative to the detectors.
All the fire scenarios were used in the initial series of tests conducted in the laboratory tunnel facility with minimal airflow in the tunnel (Task 2) [2]. The pool fire scenarios with the fire located under a simulated vehicle and behind a simulated vehicle as well as a fire in a passenger compartment were used in the tests in the laboratory facility with longitudinal airflow (Task 7) [6]. The three pool fire scenarios were used in the tests in the operating road tunnel in Montreal (Task 7) [6].
The fire scenario used in demonstration tests in the Lincoln Tunnel was a
simulated vehicle fire (Task 6) [5]. The simulated vehicle fire consisted of burning diesel fuel inside a gutted van with all of its windows removed. The primary view of the fires was through the relatively small back window openings although as the fire developed flames also extended through the open side windows. The estimated fire size was 1 to 2 MW.
The fire scenarios used in the project were considered representative of the majority of tunnel fire incidents, and presented a challenge to the fire detection systems.
The effect of longitudinal airflow on the fire characteristics and the performance of the fire detection systems were investigated in tests conducted in Tasks 4 and 7. Three airflow speeds were used in tests conducted in a laboratory tunnel research facility: 0 m/s, 1.5 m/s and 3 m/s. Four airflow speeds were used in the tests conducted in an operating road tunnel in Montreal: 0 m/s, 1.3 m/s, 2 m/s and 2.4 m/s. The airflow was towards the optical detectors mounted on the sidewall of the tunnel. A fully transverse ventilation conditions was used in the Lincoln tunnel.
The Fire Dynamic Simulator (FDS) CFD model was used to study the fire growth and smoke movement in road tunnels (Task 3). CFD simulations were carried out to compare numerical predictions against selected experimental data from the laboratory and field experiments. Further simulations were conducted to investigate the impact of various fire scenarios, ventilation mode, and tunnel length on fire behaviour and detection system performance.
5.
LABORATORY TUNNEL FIRE TESTS
Two series of fire tests were conducted in a laboratory scale test facility. In the first series of tests (Task 2), all the fire scenarios were used in tests with minimal airflow in the tunnel. In the second series of tests, the pool fire scenarios with the fire located under a vehicle and behind a large vehicle as well as the passenger compartment fire were used to investigate the performance of the detectors under longitudinal airflow conditions. Detailed information on the performance of each fire detection system in the laboratory tests is provided in the technical reports [2, 6]. The responses of the fire detection systems were dependent on the fuel type, fire size, location and growth rate, ventilation conditions as well as detection method.
5.1
Minimum Airflow Tests (Task 2)
In Task 2, the performance of fire detection systems was evaluated using all fire scenarios under minimal airflow conditions. The results of the test series are summarized in Table 2. The following is a summary on the performance of the fire detection systems.
• Pool fires located underneath the vehicle were a challenging fire for detection systems, as the vehicle body confined the flame and heat produced by the fire. The vehicle body also limited the size of the fire when there was limited airflow in the tunnel. In addition, the view of the flames from the front of the vehicle was partially obstructed by a simulated vehicle that was placed between the detectors and fire source. It was difficult for most detection systems to detect a small fire located underneath a vehicle. With an increase in fire size, more detectors responded to the fire and their detection times also decreased.
• The pool fire located behind a large vehicle was a challenge for those detectors that detected fires based on the characteristics of the flames produced by the fire, as the vehicle obstructed the view of the flames. However, the large vehicle body in front of the fire did not affect the burning process of the fire as well as temperature development and smoke spread in the tunnel. More detection systems were able to detect fires located behind a vehicle with shorter response time compared to fires located under a vehicle.
• Response of detection systems to the stationary vehicle fires was slow, because of the slow growth rate and the fire location. The flame, heat and smoke produced by the fires were limited during the initial few minutes after ignition. The earliest response by a detector was 180 s after ignition.
• The small moving vehicle fires were difficult to detect. These fires did not produce any changes in the temperature and smoke density in the tunnel. Also, the fire detectors need a relatively long time to respond to and process the fire signals, in comparison to the moving speed of the vehicle. Only the optical flame detector with high sensitivity setting detected the moving fire at 27 km/h. It did not respond to the fire at a speed of 50 km/h. No other detection systems
• Under low airflow conditions, the linear fiber optical heat detection systems, the optical flame detector, VID systems, and smoke detection system were able to detect a small-unobstructed fire (125 kW). The spot heat detectors did not respond to the small fire and responded only to fires of 1,500 kW or larger. The performances of the linear heat detection systems and VID systems were generally not affected by fire location in the tunnel.
• Propane fires were used to evaluate the performance of fire detection systems in the test series. No visible smoke was generated from the propane fires. The propane fires were difficult to detect for those detection systems that responded to the fire, based on smoke production.
Table 2. Summary of Results for Tests in Laboratory Tunnel Facility with Minimal Airflow.
Detector Technology
Fire Scenario
Linear Heat Detectors Flame Detector Video Imaging
Detection (VID) Systems Spot Heat Detectors Smoke Detection System
Open Pool Fire
Gasoline in 0.3 x 0.3 m pan. Produced limited temperature increase (7°C) and smoke production. Fibre optic – 22 s Analog – no response 4 s < 15s No response. 103 s Fires Under Vehicle Gasoline in 0.3x0.3, 0.6x0.6, 1.0x1.0 and 1.0x2.0 m pans under simulated vehicle. A 1.5 m wide by 1.2 m high obstruction was located 1.5 m in front of the fire. The simulated vehicle affected the burning rate and thus the fire size for tests with the two larger pans resulting in longer detection times for some of the systems.
Did not detect small fire (0.3x0.3 m pan). Detected large fires with earlier response with increasing pan size.
Did not detect small fire (0.3x0.3 m pan). Detected large fires with earlier response with increasing pan size..
VID D-4C1 responded to all fire sizes. VID D-C52 did not detect small fire (0.3x0.3 m pan). VID D-6C3 did not detect small fires (0.3x0.3 and 0.6x0.6 m pans).
Simulated vehicle affected flame size for 1.0x2.0 m pan resulting in delayed detector responses.
Did not detect small fires (0.3x0.3 and 0.6x0.6 m pans).
Responded to all fire sizes. Simulated vehicle affected flame size and smoke production for scenario with 1.0x2.0 m pan resulting in longer response time.
Table 2. Summary of Results for Tests in Laboratory Tunnel Facility with Minimal Airflow (continued).
Detector Technology
Fire Scenario
Linear Heat Detectors Flame Detector Video Imaging
Detection (VID) Systems Spot Heat Detectors Smoke Detection System
Fires Under Vehicle
Propane burner. The propane burner produced limited or no smoke and was thus difficult to detect for systems that relied partially or totally on smoke for detection.
Detected fires with response time < 15 s for fiber optic system and < 25 s for analog system
Detected fire with response time < 15 s.
VID D-4C1 responded ≤15 s. VID D-C52 responded only in the second test with the propane burner. VID D-6C3 responded only in the first test with the propane burner.
Detected fires with response times < 155 s for D-7H1 and < 75 s for D-8H2.
Did not detect fire. Minimal smoke produced.
Fires Behind Vehicle
Gasoline in 0.3x0.3, 0.6x0.6, 1.0x1.0 and 1.0x2.0 m pans behind a simulated vehicle. The flame produced by the fires tilted towards the simulated vehicle, especially for the larger fires. This increased the shielding of the flame by the obstruction and could affect the response of the detection systems that depended on a view of the flames.
Fiber optic system detect all fires <50 s. Analog system did not detect small fire (0.3x0.3 m pan) but responded to other fires <60 s.
Responded to all fires < 25 s.
VID D-4C1 and VID D-C52 able to detect most fires in this scenario with response times < 35 s. Long response time for VID D-4C1 with the 0.6x0.6 m pan and no response for VID D-C52 for the 1.0x1.0 m pan. VID D-6C3 did not detect any of the fires.
Did not detect small fires (0.3x0.3 and 0.6x0.6 m pan). Response times < 65 s for D-7H1 and < 40 s for D-8H2. for the fires with the two larger pans.
Detected all fires <125 s with earlier response with increased fire size.
Table 2. Summary of Results for Tests in Laboratory Tunnel Facility with Minimal Airflow (continued).
Detector Technology
Fire Scenario
Linear Heat Detectors Flame Detector Video Imaging
Detection (VID) Systems Spot Heat Detectors Smoke Detection System Engine Compartment Fire Gasoline in a 1.0x2.0 m pan with a lid. Lid moved to produce slowly growing fire. No obstacle between the fire and the wall-mounted detectors.
Fiber optic system and analog system responded at 107 and 175 s, respect lively. 5 s Detectors responded between 76 and 149 s. Detectors responded <395 s. 177 s Engine Compartment Fire
Propane burner used to simulate slowly growing fire.
Detectors responded < 71 s.
5 s VID D-4C1 responded
at 7 s. The other two systems did not respond.
Detectors responded <340 s
Did not respond. Limited smoke produced.
Passenger
Compartment Fire
Wood crib used to produce slowly growing fire in a simulated passenger compartment.
Fiber optic system and analog system responded at 171 and 291 s, respect lively. 173 s Detectors responded between 178 and 291 s.
Detectors did not respond.
Table 2. Summary of Results for Tests in Laboratory Tunnel Facility with Minimal Airflow (continued).
Detector Technology
Fire Scenario
Linear Heat Detectors Flame Detector Video Imaging
Detection (VID) Systems Spot Heat Detectors Smoke Detection System Passenger Compartment Fire Polyurethane foam produced a fast growing low heat release rate fire. Fibre optic – 105 s Analog – no response 76 s VID D-4C1 and VID D-5C2 responded at 12 and 61 s, respectively. VID D-6C3 did not detect the fire.
Detectors did not respond.
115 s
Moving Vehicle Fire
Small fire moving at 25 and 50 km/h towards and away form wall-mounted detectors. Limited or no effect on tunnel temperature and minimal smoke production.
No response. Detected the fire moving at 25 km/h <5 s. Did not detect the fire moving at 50 km/h
No response. No response. No response.
5.2
Longitudinal Airflow Tests (Task 7)
In Task 7, the performance of fire detection systems was evaluated using the pool fire scenarios with the fire located under a vehicle and behind a large vehicle as well as the passenger compartment fire under longitudinal airflow conditions. The results of the tests with Longitudinal airflow are summarized in Table 3.
Test results showed that the longitudinal airflow in the tunnel had a significant effect on fire behaviour and the performance of the fire detectors/detection systems. The response times of detectors/detection systems to a fire in the tunnel could be delayed or shortened under airflow conditions, depending on fuel type, fire size, location and growth rate of the fire, airflow speed as well as the detection method.
With airflow, the fire plume was tilted toward the downstream side of the fire source. The angle of the fire plume to the ground decreased with an increase in airflow speed. In some cases, the fire plume decreased in length and became unstable at high airflow speeds (3 m/s). The effect of the airflow on the fire plume decreased with an increase in fire size.
The duration of the passenger compartment fire was decreased under longitudinal airflow conditions. Temperature and smoke optical density near the ceiling of the tunnel were lower than those produced under non-ventilated conditions. Generally, the response times of fire detection systems to the passenger compartment fire in the stationary vehicle were delayed or in some cases there was no response under airflow conditions.
The performance of the heat detection systems for the fire scenarios with the pool fires located under a simulated vehicle and behind a large vehicle is summarized as follows:
• The change in the fire plume under longitudinal airflow conditions resulted in a shift of the ceiling hot spot from vertically above the fire source. The distance of the shift was dependent on the fire size, location, fuel type, fire scenario, and airflow speed. The maximum distance observed in the tests was approximately 6-8 m. As a result, the hot spot identified by heat detection systems (linear and spot) under longitudinal airflow conditions would not reflect the real fire location. • The ceiling temperatures produced by small fires located underneath a vehicle,
and open pool fires located behind a vehicle, were lower than those produced under non-ventilated conditions. These temperatures were further decreased with the increase in airflow velocity. The response times of heat detection systems to these fires, generally, increased with the increase in airflow speed.
• Ceiling temperatures produced by large pool fires located underneath a vehicle with an airflow velocity of 1.5 m/s were higher than those produced under non-ventilated conditions. The increased temperature was due to the increased burning rate of the fire compared with tests with minimal airflow in the tunnel. However, the ceiling temperatures were lower in the tests with airflow velocity to 3 m/s. Therefore, the response times of heat detection systems to large pool fires located under a vehicle were shorter for tests with an airflow velocity of 1.5 m/s than those in tests with minimal airflow velocity as well as for the higher airflow velocity tests.
The performance of the VID systems for the fire scenarios with the pool fires located under a simulated vehicle and behind a large vehicle is summarized as follows:
• The burning rate of the fuel increased with an increase in airflow speed. There was a significant change in burning rate between the tests with minimal airflow and the tests with a 1.5 m/s airflow velocity. The results also indicated there was a further small increase in burning rate for tests with an airflow velocity of 3 m/s. However, the effect of airflow on the burning rate was, generally, reduced with the increase in fire size. It was also dependent on the fire scenario and fuel type. Under airflow conditions, smoke production was increased and its spread in the tunnel was more rapid. As a result, the period of time available for the VID systems to detect and monitor the fire decreased with the increase in airflow speed as well as fire size.
• The response times of VID D-4C1 to the fires, generally, increased with the increase in airflow speed. While, it detected the 1 m2 gasoline pool fire located behind a simulated vehicle, it was unable to detect the 2 m2 gasoline pool fire. In this case, the visibility in the tunnel was quickly lost. VID D-5C2 did not respond to large fires located behind a vehicle at an airflow speed of 1.5 m/s but detected them at an airflow speed of 3 m/s.
• Both VIDs D-4C1 and D-5C2 were, generally, able to detect fires located underneath the vehicle. VID D-5C2 detected small fires located underneath a vehicle at the three airflow velocities. The response time decreased with an increase in fire size but was not affected by a change in airflow speed (for small fires, smoke was the main parameter that controlled the response time). On the other hand, the response times of D-4C1 decreased with an increase in airflow speed.
• It was difficult for VID D-6C3 to detect fires located underneath a vehicle and behind a large vehicle under longitudinal airflow conditions, as the fire plume was titled and shielded behind the obstacles. The detector only responded to a 1 m2 gasoline pool fire located underneath the vehicle at an airflow speed of 1.5 m/s but did not respond to the other scenarios with pool fires.
The performance of the optical flame detector, D-3F1, for the fire scenarios with the pool fires located under a simulated vehicle and behind a large vehicle is summarized
• The sensitivity of the optical flame detector was reduced to medium for the tests with longitudinal airflow as a result of the environmental tests conducted in the Lincoln tunnel. A second detector with the high sensitivity level used in Task 2 was also included in the Task 7 tests. This detector was able to detect all the fires. The alarm thresholds/sensitivity for the two levels are provided in Table 1.
• The detector with a medium sensitivity level did not respond to a small fire located underneath a vehicle at an airflow speed of 1.5 m/s. However, it detected the same fire at an airflow speed of 3 m/s.
• It was difficult for the detector with medium sensitivity to respond to a fire located behind a large simulated vehicle for tests with longitudinal airflow. The detector responded to the fires at an airflow speed of 1.5 m/s but did not respond at an airflow speed of 3 m/s.
• The response time of the detector with a medium sensitivity to a 1 m2 pool fire located underneath a vehicle increased with an increase in airflow speed. However, the effect of airflow on detection time for a 2 m2 pool fire located underneath the vehicle was limited.
The performance of the smoke detector system for the three fires scenarios is summarized as follows:
• The response times of the smoke detection system to a 0.36 m2 gasoline pool fire located underneath a vehicle increased with the increase in airflow speed. However, the response time for the open pool fires located behind the vehicle under airflow conditions were shorter or comparable to those under non-ventilated conditions, as more smoke was produced in the tests with airflow.
• For large pool fires located underneath a vehicle, the smoke optical densities produced with an airflow velocity of 1.5 m/s were higher than those produced under non-ventilated conditions due to the increased burning rate of the fire. However, smoke optical density near the ceiling of the tunnel decreased in the tests with an airflow velocity of 3 m/s. Therefore, the response times of smoke systems to these fires were shorter for tests with an airflow velocity of 1.5 m/s than those in tests with minimal and higher airflow velocities.
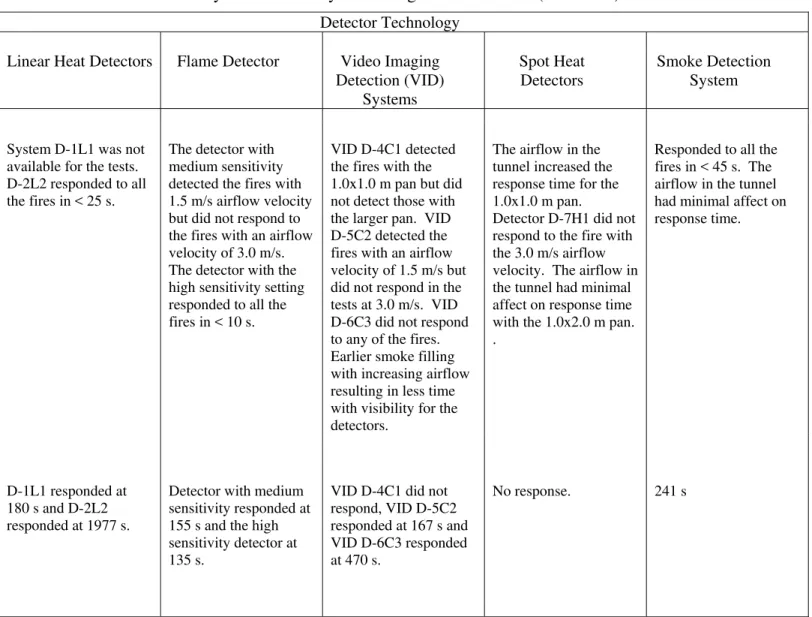
Table 3. Summary of Results for Tests in Laboratory Tunnel Facility with Longitudinal Airflow.
Detector Technology
Fire Scenario
Linear Heat Detectors Flame Detector* Video Imaging
Detection (VID) Systems Spot Heat Detectors Smoke Detection System
Fires Under Vehicle
Gasoline pool fires in a 0.6x0.6, 1.0x1.0 and 1.0x2.0 m pans. Airflow velocities 0, 1.5 and 3 m/s. The airflow in the tunnel tilted the plume with the amount of tilt depending on the fire size. The airflow cooled the smoke layer and diluted the smoke. For the fires with the large pans (1.0x1.0 and 1.0x2.0 m pans).under the vehicle, the airflow increased the burning rate resulting in a larger fire.
For the small fire (0.6x0.6 m pan) response time increased with increasing airflow as the airflow affected the temperature at the ceiling due to dilution and effects on the plume. For the 1.0x2.0 m fire, the temperature decrease due to dilution and effects on the plume was offset by an increase in fire size resulting in earlier or minimal change in detection time.
The detector with medium sensitivity did not respond to the small fire with airflow but did respond with minimal airflow. This detector did respond to the other two fires with airflow. Increasing airflow resulted in longer response times with the 1.0x1.0 m pan but did not affect the response time for the larger fire. The high sensitivity detector responded to all the fires and responded earlier than the system with medium sensitivity.
VID D-4C1 was able to detect all the fires. The response time increased with airflow velocity for the small fire (0.6x0.6 m pan). There was minimal variation in response time for the larger fires (42-50 s). VID D-5C2 responded to all the fires with a response time of 40-45 s for the small fire and 17-31 s for the larger fires. VID D-6C3 responded to only one fie under a vehicle (1.0x1.0 m pan with 3 m/s airflow).
There was no response to the small fire (0.6x0.6 m pan). The response time for detector D-7H1 increased with increasing airflow velocity with the two larger fires. Detector D-8H2 responded in <40 s for all tests with larger fires with minimal variation with fire size and airflow velocity.
For the small fire (0.6x0.6 m pan) response time increased with increasing airflow. The airflow resulted in more smoke spread at lower elevations as well as dilution of the smoke. For the fires with the two larger pans, the temperature decrease due to dilution and effects on the plume was offset by an increase in fire size resulting in earlier or minimal change in detection time.
Table 3. Summary of Results for Tests in Laboratory Tunnel Facility with Longitudinal Airflow (continued).
Detector Technology
Fire Scenario
Linear Heat Detectors Flame Detector Video Imaging
Detection (VID) Systems Spot Heat Detectors Smoke Detection System
Fire Behind Vehicle
Gasoline fires in 1.0x1.0 and 1.0x2.0 m pan with airflow velocities of 1.5 and 3.0 m/s. The airflow increased the tilt of the flame towards the obstacle. The 3.0 m/s airflow caused instability in the flame and reduced its size. The tilting of the flame resulted in a shift of the hot spot at the ceiling by up to 8 m.
System D-1L1 was not available for the tests. D-2L2 responded to all the fires in < 25 s.
The detector with medium sensitivity detected the fires with 1.5 m/s airflow velocity but did not respond to the fires with an airflow velocity of 3.0 m/s. The detector with the high sensitivity setting responded to all the fires in < 10 s.
VID D-4C1 detected the fires with the 1.0x1.0 m pan but did not detect those with the larger pan. VID D-5C2 detected the fires with an airflow velocity of 1.5 m/s but did not respond in the tests at 3.0 m/s. VID D-6C3 did not respond to any of the fires. Earlier smoke filling with increasing airflow resulting in less time with visibility for the detectors.
The airflow in the tunnel increased the response time for the 1.0x1.0 m pan. Detector D-7H1 did not respond to the fire with the 3.0 m/s airflow velocity. The airflow in the tunnel had minimal affect on response time with the 1.0x2.0 m pan. .
Responded to all the fires in < 45 s. The airflow in the tunnel had minimal affect on response time.
Passenger
Compartment Fire
Test with wood crib and polyurethane foam with 3.0 m/s airflow velocity. The airflow increased the burning rate of the fire
D-1L1 responded at 180 s and D-2L2 responded at 1977 s.
Detector with medium sensitivity responded at 155 s and the high sensitivity detector at 135 s.
VID D-4C1 did not respond, VID D-5C2 responded at 167 s and VID D-6C3 responded at 470 s.
6.
Fire Tests in Carré-Viger Tunnel (Task 4)
The performance of the fire detectors/detection systems was investigated in a series of fire tests conducted in the Carré-Viger Tunnel in Montreal, Canada. The tests investigated the response of fire detectors/detection systems to the fire scenarios in an operating tunnel environment at their maximum detection range.
Six detection systems were used in the tests in Montreal. This included the two linear heat detection systems, the optical flame detection system and the three VID systems.
The fire scenarios used in the tests were selected from those used in the laboratory tests and included a small gasoline pool fire, a gasoline pool fire located underneath a simulated vehicle, and a gasoline pool fire located behind a large vehicle. Four airflow velocities were used in the tests: 0 m/s, 1.3 m/s, 2 m/s and 2.4 m/s. The fire size varied from 125 kW to 650 kW.
The fire characteristics, including temperatures and smoke spread in the tunnel, were measured in the tests. The activation time of each detector/detection system under various ventilation conditions was recorded. The ability of the detection systems to locate and monitor the fire was also evaluated. The results of the tests are summarized in Table 4. General observations on the performance of fire detectors/detection systems in test series are as follows:
• The performances of the fire detection systems were generally consistent with those observed in the laboratory tunnel tests under the same test conditions.
• The pool fires located underneath a vehicle were more difficult to detect than the fires located behind a vehicle. The response times of fire detection systems for the fire located underneath a vehicle were generally longer than those for the fire located behind a vehicle.
Observations on the response of the linear heat detection systems are as follows: • The linear heat detection systems were able to respond to small fires based on the
rate of rise of temperature, even though the ceiling temperature was not high. The response time of the linear detection system D-1L1 to a small open pool fire (125 kW) ranged from 22 s to 33 s, and the response time of the linear detection system D-2L2 ranged from 41 s to 45 s.
• The response times of the linear heat detection systems were not affected by fire location in the tunnel, as the fires were always near a section of the cable. The detection times increased with an increase in airflow speed as the ceiling temperature decreased.
• The linear heat detection system D-1L1 was able to determine the fire location to within 2 m range but the hot spot identified by the system under longitudinal airflow conditions was not the real fire location.
Observations on the response of the optical flame detector D-3F1 are as follows: • The optical flame detector D-3F1 was able to detect all fires within its detection
range. The detection time ranged from 25 s to 76 s in the test series, depending on the fire scenario, fire size and airflow conditions.
• The detector did not respond to the fire, when it was located beyond its maximum detection distance (~30 m).
• Its performance was affected by an increase in airflow speed.
Observations on the response of the three VID systems are as follows:
• The three VID systems were able to detect the small open fires (125 kW) at their maximum detection range (~60 m). The change in location of the small open fire in the tunnel had a limited impact on the performance of Detectors 4C1 and D-6C3, but had a substantial impact on the performance of D-5C2.
• The performance of the three VID systems was affected by longitudinal airflow conditions. Both D-4C1 and D-5C2 were able to detect the fire located underneath a vehicle at the three airflow speeds. The response time was either decreased or increased depending on the airflow velocity.
• The airflow conditions made it more difficult for D-6C3 to respond to the fire. It detected the fire in the tests with an airflow speed of 1.3 m/s and 2.4 m/s but did not respond to the fire at an airflow speed of 2 m/s.
• Both D-4C1 and D-5C2 were able to detect the fire located behind the vehicle when the fire was 32 m from the detectors, but did not respond to the fire when it was 60 m from the detectors.
• D-6C3 detected the fire at both locations but the response time increased with an increase in distance.
Table 4. Summary of Results for Tests in Carré-Viger Tunnel.
Detector Technology
Fire Scenario
Linear Heat Detectors Flame Detector Video Imaging
Detection (VID) Systems Spot Heat Detectors Smoke Detection System
Open Pool Fires
Gasoline fires with a 0.3x0.3 m pan at four locations approximately 30 and 60 m from the wall-mounted detectors. At each distance, a test was conducted in the two outside lanes of the tunnel.
System D-1L1
responded to all fires in < 35 s. D-2L2 detected the two fires (< 45 s) at the locations
approximately 30 m from the wall-mounted detectors but did not respond to the other two fires. For all fire locations, a section of the detection cable was near the fire.
The medium sensitivity detector detected the fire at 30 m in the lane adjacent to the wall on which the detector was mounted but not on the opposite side of the tunnel. The fires were at the detection limits of the detector. The high sensitivity detector responded in all tests within 10 s.
VID D-4C1 detected all the fires between 44 and 57 s. The
response time for VID D-5C2 varied from 13 s to 167s. VID D-6C3 detected all the fires in < 10s.
Not included in the tests.
Not included in the tests.
Fires Under Vehicle
Gasoline fires with a 0.6x0.6 m pan. The fires were approximately 30 m from the wall-mounted detectors. The airflow velocity in the tunnel was 1.5, 2.5 and 3.0 m/s.
The response time increased with increasing airflow velocity. Response time < 105 s except detector D-1L1 did not respond in the test with a 3.0 m/s airflow velocity.
The response time increased with increasing airflow velocity. The medium sensitivity detector did not respond at the highest airflow velocity. The high sensitivity detector responded < 35 s.
No systematic variation in detection time with airflow velocity. VID D-4C1 detected the fires between 56 and 88 s. VID D-5C2 detected the fires between 18 and 66 s. VID D-6C3 did not detect the fire with an airflow velocity of 2.5 m/s
Not included in the tests
Not included in the tests
Table 4. Summary of Results for Tests in Carré-Viger Tunnel (continued).
Detector Technology
Fire Scenario
Linear Heat Detectors Flame Detector* Video Imaging
Detection (VID) Systems Spot Heat Detectors Smoke Detection System
Fires Behind Vehicle
Gasoline fires with a 0.6x0.6 m pan approximately 30 and 60 m from the wall-mounted detectors. The airflow velocity was 1.3 m/s.
Responded to the fires <35 s.
Medium sensitivity detector responded to the fire at 30 m at 25 s but did not respond to the fire at 60 m. The high sensitivity detector responded to the fire at 60 m at 12 s.
VIDs D-4C1 and D-5C2 responded to the fire at 30 m at 47 and 24 s, respectively but did not detect the fire at 60 m. VID D-6C3 responded to the fires <20 s.
Not included in the tests
Not included in the tests
7.
MODELLING STUDY (Task 3)
Four types of ventilation systems and two tunnel lengths were investigated using computer simulations. The ventilation systems included: longitudinal systems, full-transverse, semi-transverse (supply), and semi-transverse (exhaust). The two investigated tunnel lengths were 37.5 m and 500 m. The length 37.5 is same as the length of the tunnel testing facility. Detailed information on the computer modeling simulations is provided in the report for Task 3 [6]. The following is a summary on the findings of the computer modeling:
• In general, favourable comparisons between the numerical predictions and experimental data were observed. Discrepancies were noted in some comparisons. Both radiation and turbulence close to the fire source had a significant effect on the numerical predictions at these locations. For large fire sizes and highly turbulent situations, these effects were more pronounced. Away from the fire, the predications and hence the comparison with the experimental results were improved as the effect of both radiation and turbulence was reduced. • The numerical predications for temperature fluctuated with large amplitudes
especially at locations closer to the fire. The experimental results did not exhibit the same phenomenon. This can be attributed to two reasons: the frequency of data collection was coarse in the experiments and the plume shape was not properly replicated in the numerical simulation. As the size of the pool fire increased, the instability of flames was more pronounced and hence larger fluctuations were observed.
• In some cases where the fire plume was deflected differently than what was observed in the corresponding full-scale test, the vertical profile close to the fire was altered and the maximum plume temperature was shifted up or down depending on the angle of deflection of the plume.
• In general, the comparisons were more favourable for the scenario with a fire behind a vehicle than for the case of fire under a vehicle. This can be attributed to the fact that the fire under a vehicle was under-ventilated. In general, the CFD model, FDS, used for the study is more suited for well-ventilated cases.
• Among the investigated ventilation schemes, the semi-transverse supply ventilation system resulted in the highest ceiling temperature and soot volume fraction. Both the full-transverse and semi-transverse exhaust ventilation systems produced similar average ceiling temperature and soot profiles. The longitudinal ventilation system resulted in the lowest average ceiling temperature. The semi-transverse supply ventilation system resulted in the fastest rate of rise of ceiling temperature and the semi-transverse exhaust ventilation system resulted in the slowest rate of rise of ceiling temperature.
• The ceiling temperature and soot volume fraction profiles for the two tunnel lengths were very similar implying that the length of the tunnel has limited effect on the ceiling temperature and smoke density.
• In certain cases, the ventilation system or the prevailing wind could result in a strong longitudinal airflow in the tunnel causing a significant tilting of fire plume. This could, in turn, result in the shift of the hot spot and sometimes, depending on the strength of the airflow, could slow or even prevent the formation of a hot layer. In these cases, the performance of detection systems that rely on absolute temperature or rate of temperature rise in detecting a fire incident may be compromised. Moreover, the strong longitudinal airflow may disrupt the structure of the fire plume altering its shape. Consequently, it becomes more difficult for detection systems that depend on visualizing the flame to detect the fire incident.
• The existence of stopped traffic in the tunnel could affect the flow field in the tunnel. It may lead to faster flow in some areas resulting in lower temperatures, or to pockets of stagnant air resulting in higher temperatures. Moreover, the vehicles may obstruct the view of detection systems causing a delay in detecting a fire. Although traffic patterns were not investigated in the current study, the existence of an obstruction can greatly affect the fire dynamics.
8.
RESULTS OF TESTS IN LINCOLN TUNNEL (Tasks 5 and 6)
The four detection systems installed in the Lincoln Tunnel were monitored for a period of 10 months. Over the monitoring period, the tunnel was exposed to outside temperatures ranging from -12°C to 33°C (10°F to 92°F). The snowfall was only 2.5 cm (1.0 in.) and the rainfall was 19.2 cm (7.6 in.). Besides the weather conditions, the detectors were also exposed to high soot and dirt levels from the traffic and to overspray from periodic washing of the tunnel walls and ceiling with a water and soap solution.
There were two primary areas of detection coverage in the tunnel: 1) the NJ entrance and 2) the second incline toward NY. The NJ portal was selected to assess effects of weather and varied lighting conditions on detector performance. The second location is east of center in the tunnel and is the location that vehicles must accelerate most; this was deemed to be the location with the most exhaust.
The results for Tasks 5 and 6 are summarized in Table 5. Following are the general findings of the monitoring study considering both detector locations together:
• The VID system (D-4C1) designed for both smoke and flame detection had a large number of nuisance alarms. However, the number of nuisance alarms was substantially influenced by two issues that would not be present in future, non-test installations. First, the system used the existing tunnel cameras. These cameras had to be used as is and were not optimized for the VID system. In particular, the manufacturer reported that the camera auto-iris operation created a flicker effect that the VID algorithm identified as reflected fire light. The second issue was that
were primarily due to flashing lights on service/utility vehicles or weather
conditions causing fouling of the camera window or causing fog and headlights to trip the system. Reflection of sunlight into the tunnel entrance was also a
significant cause of nuisance alarms.
• The other VID system (D-6C3) designed for flame detection had no nuisance alarms.
• The optical flame detectors (D-3F1) were installed without heating elements active. This may have contributed to the excessive number of problems for the devices. The detectors facing on-coming traffic became very dirty with grime on the sensor windows. This resulted in optical fault conditions for the majority of the service time. The devices viewing with the flow of traffic did not have the same optical fault problems and collectively had approximately three nuisance alarms per month on average.
• The air sampling smoke detection system (D-9S1) monitoring the exhaust vents in the roadway ceiling had two nuisance alarm events. These two detectors with the sampling points in the ceiling vents proved to be practical and effective.
However, a third detector and sampling line in the main exhaust vent shaft was not a practical system; it became excessively dirty in a short period of time resulting in air blockage and air flow trouble signal.
In the fire demonstration tests, the primary view of the interior vehicle fires was through the back window openings of a stripped-out van in which a diesel pool fire was burning. The two VID systems did not detect any of the fires. The optical flame detector detected two of the five fires at 30 m (100 ft) and 15 m (50 ft) distances. The air
sampling detection system was only exposed to three of the fires, and detected two of the three and was quite close to reaching the threshold in the third (i.e., at 93% of the alarm level).
Based on overall performance considering nuisance alarms, maintenance and fire detection, the air sampling detection system performed well; it had few false alarms and the highest percentage of fires detected. In general, the detection systems that rely on field-of-view (FOV) measurements had limitations during the fire tests due to the relatively concealed fire scenario (i.e., an interior vehicle fire visible through open windows). However, this scenario was also quite realistic in that it was a fire in a single isolated vehicle, whereas many accidents involve multiple vehicles that may obstruct the view of the fire. To deal with obstructions, most manufacturers of FOV detectors recommend two detectors covering the same area from different angles, such as from both directions within a tunnel. This approach leads to the need for many devices that will have ranges of 15 m (50 ft) to approximately 60 m (200 ft) or more depending on the desired target fire size.
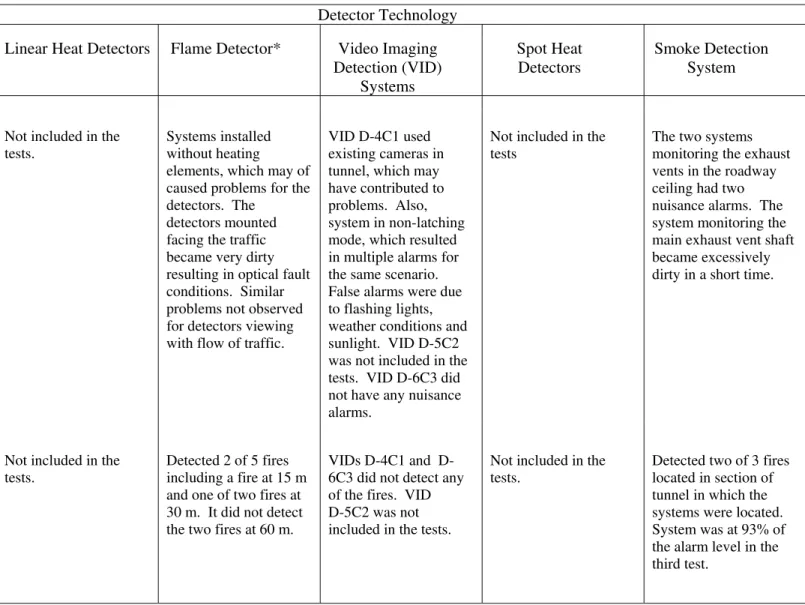
Table 5. Summary of Results for Tests in Lincoln Tunnel.
Detector Technology
Linear Heat Detectors Flame Detector* Video Imaging
Detection (VID) Systems Spot Heat Detectors Smoke Detection System Environmental Tests
The systems were monitored over a 10 month period.
Not included in the tests.
Systems installed without heating elements, which may of caused problems for the detectors. The
detectors mounted facing the traffic became very dirty resulting in optical fault conditions. Similar problems not observed for detectors viewing with flow of traffic.
VID D-4C1 used existing cameras in tunnel, which may have contributed to problems. Also, system in non-latching mode, which resulted in multiple alarms for the same scenario. False alarms were due to flashing lights, weather conditions and sunlight. VID D-5C2 was not included in the tests. VID D-6C3 did not have any nuisance alarms.
Not included in the tests
The two systems monitoring the exhaust vents in the roadway ceiling had two nuisance alarms. The system monitoring the main exhaust vent shaft became excessively dirty in a short time.
Demonstration Tests
Fire inside van with diesel fuel in two vertical halves of a 55-gallon drum. Primary view was through the 0.44 m2 rear window as well as
Not included in the tests.
Detected 2 of 5 fires including a fire at 15 m and one of two fires at 30 m. It did not detect the two fires at 60 m.
VIDs 4C1 and D-6C3 did not detect any of the fires. VID D-5C2 was not included in the tests.
Not included in the tests.
Detected two of 3 fires located in section of tunnel in which the systems were located. System was at 93% of the alarm level in the
9.
RECOMMENDATIONS FOR FUTURE RESEARCH
Following recommendations are made for future research on fire detection technologies for tunnel applications:
1. Various fire scenarios were used in the project to investigate the strengths and weaknesses of the detection technologies. Further work needs to be undertaken with testing and certification organizations to select and develop standard fire tests for use in evaluating detection systems for tunnel applications.
2. The impact of longitudinal ventilation conditions on the performance of fire detection systems was studied. The impact of other ventilation modes in tunnels, such as transverse or semi-transverse ventilation, on the performance of fire detection systems should be investigated.
3. More studies on the conditions in a tunnel under longitudinal airflow conditions would be useful in determining the effect of the airflow on flame shape, temperature distribution and smoke spread in the tunnel. Such studies would be helpful in developing the detection technologies. In addition, the performance of VID systems to the fires under airflow conditions should be studied, when the detectors are located upstream of the fire.
4. The linear heat detection systems were able to detect small fires, based on the rate of rise of the temperature. However, these systems were not included in the environment study. A study is required to determine if these systems are subject to nuisance alarms in a tunnel environment.
5. More effort is required to link CFD data to VID and flame detectors in terms of smoke (obscuration, density, or visibility) and the visible envelope of the flame.
10. CONCLUSIONS
In general, roadway tunnels are challenging environments for fire detection systems, both in terms of the detection challenge and the environmental conditions under which these systems must operate. Five currently available detection technologies for tunnel applications were investigated in the project. As described above, each has strengths and weaknesses for specific fire scenarios. The general performance of each type of technology is summarized as follows:
1. Linear heat detection systems. The linear heat detection systems had good
response to the fire scenarios, based on rate of temperature rise. Longitudinal airflow in the tunnel delayed the response time for these systems for most scenarios as the temperature at the ceiling decreased with the tilting of the flame and cooling of the fire plume by the airflow. The one scenario in which there was a faster response with a longitudinal airflow was a large shielded fire under a simulated vehicle. In this case, the size of the fire increased resulting in faster response times.
location. However, under longitudinal airflow, the hot spot at the ceiling could be shifted downstream and the actual fire location could be up to 10 m from the location indicated by the detection system.
The linear heat detection systems were not installed in the Lincoln tunnel. As such, there were no results developed on potential nuisance alarms and
maintenance problems in a tunnel environment. By using rate of temperature rise as the basis for detection, these systems responded to fires that produced
relatively small temperature increases at the ceiling. The potential for comparable temperature increases to be produced by vehicles in a tunnel should be
investigated.
2. Flame detector. Initial laboratory tunnel tests were conducted using a flame
detector set at high sensitivity. The sensitivity of the system was adjusted to medium sensitivity for the tests with longitudinal airflow and the tests in the Carré-Viger Tunnel as a result of the environment tests in the Lincoln Tunnel. With the medium setting, the flame detector could detect small open fires within its detection range (30 m).
The flame detector as with other systems that relied on field-of-view had difficulty detecting fires located under a vehicle, behind a vehicle or inside a vehicle as was the case for the demonstration test in the Lincoln tunnel. The response time to these scenarios were increased under longitudinal airflow conditions as the flames were tilted and, as a result, there was an increased concealment of the flames by obstacles. To deal with obstructions, most
manufacturers of FOV detectors recommend two detectors covering the same area from different angles, such as from both directions within a tunnel.
The flame detectors had some problems in the environmental tests in the Lincoln tunnel. The devices were installed without their integral heating elements active to keep moisture from condensing on the sensor windows. The devices facing the on-coming traffic became very dirty with grime on the sensor windows, which resulted in an optical fault condition for the majority of the service time. The devices viewing with the traffic flow did not have the same optical fault problem but collectively had approximately three nuisance alarms per month on average.
3. Video imaging detection (VID) systems. Three types of VID systems were
investigated in the project. There was a variation in the performance of the system depending on the method used to determine the presence of a fire. For the initial laboratory tunnel tests with minimal airflow, two of the systems detected a fire based on flame characteristics and the third used both flame and smoke characteristics. For the tests with longitudinal airflow and the tests in the Carré-Viger Tunnel one of the flame based systems was converted to a flame and smoke system.
inside a vehicle). The detectors that utilized both flame and smoke characteristics had better response for the concealed fire scenarios. The two detectors that used both flame and smoke characteristics were not affected or the response time improved with airflow in the tunnel as detector response was primarily dependent on the detection of smoke.
The longitudinal airflow in the tunnel affected the buildup of smoke in the tunnel downstream of the fire. This increased build-up of smoke decreased the time available for detectors dependent on field-of-view to detect a fire and thus detection did not occur in several instances. As noted under flame detectors, the use of multiple detectors would be required to provide effective coverage. The VID system designed for both smoke and flame detection installed in the Lincoln tunnel had a large number of nuisance alarms, approximately one per day per camera. Alarms were primarily due to flashing lights on service/utility
vehicles or weather conditions causing fouling of the camera window or causing fog and headlights to trip the system. Reflection of sunlight into the tunnel entrance was also a significant cause of nuisance alarms. The other VID system (D-6C3) designed for flame detection had no nuisance alarms.
4. Spot heat detectors. Spot heat detectors were used only in the laboratory tunnel tests under minimal airflow and with longitudinal airflow. Under minimal airflow conditions, the detectors were not able to detect small fires. They only responded to fires of 1,500 kW or larger. Longitudinal airflow in the tunnel delayed the response time for these systems for most scenarios as the temperature at the ceiling decreased with the tilting of the flame and cooling of the fire plume by the airflow. The one scenario in which there was a faster response with a longitudinal airflow was a large shielded fire under a simulated vehicle. In this case, the size of the fire increased resulting in faster response times.
Spot heat detectors were not included in the tests in the Lincoln tunnel.
5. Smoke detection system. An air sampling smoke detection system was included
in the laboratory tunnel tests and the environmental tests in the Lincoln tunnel. The system was able to detect all the fires in the laboratory tunnel except those using in propane burner, which produced a limited amount of smoke. The
longitudinal airflow affected the response of the smoke detection system. For the scenarios with pool fires behind a simulated vehicle and large pool fires located under a simulated vehicle, the response time decreased as the amount of smoke produced increased with airflow in the tunnel. There was an increase from approximately 50 s to approximately 150 s in response time for the scenario with the small fire under a simulated vehicle. In this case, smoke optical density was decreased by the airflow in the tunnel.
In the tests in the Lincoln tunnel, the air sampling smoke detection system monitoring the exhaust vents in the roadway ceiling had two nuisance alarm events. These two detectors with the sampling points in the ceiling vents proved
to be practical and effective. However, a third detector and sampling line in the main exhaust vent shaft was not a practical system; it became excessively dirty in a short period of time resulting in air blockage and an air flow trouble signal. Based on overall performance, the air sampling detection system performed well; it had few false alarms and was able to detect the fire for most scenarios including those with longitudinal airflow. The linear heat detection systems were also able to detect the fires for most scenarios. However, there was no information developed on the
performance of these systems in terms of nuisance alarms. The systems that rely on field-of-view had problems detecting fires that were concealed by obstructions. Multiple detectors could be used to address this issue. The VID systems that included detection based on both flame and smoke characteristics had better performance in terms of detecting a fire but had problems in the environmental tests. The spot heat detection systems were not able to detect small fires (< 1,500 kW).
The research program has provided valuable information to detection system manufacturers, which will lead to further improvements in technology. In the meantime, tunnel specialists can use the information from this study in determining the most
appropriate technology for their application. The NFPA Technical Committee
responsible for Standard 502, Standard for Road Tunnels, Bridges, and Other Limited Access Highways, will be considering this information in the further development of the standard.
11. REFERENCES
1. Liu, Z.G., Crampton, G.P., Kashef, A., Lougheed, G.D., Gibbs, E., Su, J.Z., Bénichou, N., Task 1: Fire Detectors, Fire Scenarios and Test Protocols. International Road Tunnel Fire Detection Research Project - Phase II, National Research Council, Ottawa, 2006.
2. Liu, Z.G., Crampton, G.P., Kashef, A., Lougheed, G.D., Gibbs, E., and Muradori, S., Task 2, Full-scale Fire Tests in a Laboratory Tunnel for Study of Tunnel Fire Detection Technologies, International Road Tunnel Fire Detection Research Project – Phase II, National Research Council, Ottawa, 2007.
3. Kashef, A., Liu, Z.G., Lougheed, G.D., and Crampton, G.P., Task 3: Study of Computer Simulation Modeling for Tunnel Fire Detection. International Road Tunnel Fire Detection Research Project - Phase II, National Research Council, Ottawa, 2008.
4. Liu, Z.G., Crampton, G.P., Kashef, A., Lougheed, G.D., Gibbs, E., and Muradori, S., Task 4: Full-scale Fire Tests in an Operating Road Tunnel at Montreal City. International Road Tunnel Fire Detection Research Project - Phase II, National Research Council, Ottawa, 2008
S., Task 7, Effect of Naturally Longitudinal Ventilation on Performance of Fire Detectors/Detection Systems for Road Tunnel Protection, International Road Tunnel Fire Detection Research Project – Phase II, National Research Council, Ottawa, 2008.