Publisher’s version / Version de l'éditeur:
Materials Science and Engineering B, 2010-12-01
READ THESE TERMS AND CONDITIONS CAREFULLY BEFORE USING THIS WEBSITE.
https://nrc-publications.canada.ca/eng/copyright
Vous avez des questions? Nous pouvons vous aider. Pour communiquer directement avec un auteur, consultez la
première page de la revue dans laquelle son article a été publié afin de trouver ses coordonnées. Si vous n’arrivez pas à les repérer, communiquez avec nous à PublicationsArchive-ArchivesPublications@nrc-cnrc.gc.ca.
Questions? Contact the NRC Publications Archive team at
PublicationsArchive-ArchivesPublications@nrc-cnrc.gc.ca. If you wish to email the authors directly, please see the first page of the publication for their contact information.
NRC Publications Archive
Archives des publications du CNRC
This publication could be one of several versions: author’s original, accepted manuscript or the publisher’s version. / La version de cette publication peut être l’une des suivantes : la version prépublication de l’auteur, la version acceptée du manuscrit ou la version de l’éditeur.
For the publisher’s version, please access the DOI link below./ Pour consulter la version de l’éditeur, utilisez le lien DOI ci-dessous.
https://doi.org/10.1016/j.mseb.2011.02.031
Access and use of this website and the material on it are subject to the Terms and Conditions set forth at
Effect of electrodeposition current density on the microstructure and
the degradation of electroformed iron for degradable stents
Moravej, Maryam; Amira, Sofiene; Prima, Frédéric; Rahem, Ahmed; Fiset,
Michel; Mantovani, Diego
https://publications-cnrc.canada.ca/fra/droits
L’accès à ce site Web et l’utilisation de son contenu sont assujettis aux conditions présentées dans le site LISEZ CES CONDITIONS ATTENTIVEMENT AVANT D’UTILISER CE SITE WEB.
NRC Publications Record / Notice d'Archives des publications de CNRC: https://nrc-publications.canada.ca/eng/view/object/?id=dc5bafaa-0eb4-4518-81b9-550a8ad804ed https://publications-cnrc.canada.ca/fra/voir/objet/?id=dc5bafaa-0eb4-4518-81b9-550a8ad804ed
Elsevier Editorial System(tm) for Materials Science and Engineering B Manuscript Draft
Manuscript Number:
Title: Effect of electrodeposition current density on the microstructure and the degradation of electroformed iron for degradable stents
Article Type: Special Issue: Biodegradable Metals
Keywords: Electrodeposition, Electroforming, Degradable Stents, Microstructure, Texture, Corrosion Corresponding Author: Prof. Diego Mantovani, PhD
Corresponding Author's Institution: Laval University First Author: Maryam Moravej, PhD candidate
Order of Authors: Maryam Moravej, PhD candidate; Sofiene Amira, PhD; Frederic Prima, PhD; Ahmed Rahem, PhD; Michel Fiset, PhD; Diego Mantovani, PhD
Dear Editor:
Please find enclosed the manuscript we submit in Mater Sci Eng B for consideration and eventual publication in the special issue on Biodegradable Metals, following the Maratea 2nd Intl Symposium. Please consider that this manuscript reports on an original work that has never been submitted elsewhere.
In case you might require suggestions for few evaluators, please consider the following: Dr A. Cortes, Senior Researcher in Metallurgy of Biomaterials, CINVESTAV, Saltillo, Mexico,
dora.cortes@cinvestav.edu.mx
Prof JJ Pireaux, Director, Lab for Interdisciplinary Electron Spectroscopy, Univ of Namur, Belgium, jean-jacques.pireaux@fundp.ac.be
Prof. F Migliavacca, LabS, Dip Bioengineering, Polytechnic of Milan, Italy,
francesco.migliavacca@polimi.it
Please feel free to contact me for any further information you might require With my highest regards
Diego Mantovani, professor
Director, Lab Biomaterials and Bioengineering, Laval U., Canada
www.lbb.gmn.ulaval.ca
In this work, we report for the first time the effect of electrodeposition current density on the
microstructure and texture of iron for a biomedical-structural application such as degradable
stents. In particular, the application of Electron Backscatter Diffraction in microstructure and
texture identification of electrodeposited iron has never been reported before. In addition, the
effect of electrodeposition parameters including current density is particularly important in
case of degradable stents, as the microstructure is shown to influence the rate and form of
corrosion. This work also elucidates the effect of the grain size and texture of electrodeposited
iron on its degradation in physiologically simulated solutions. Finally, the electroforming
process we used here has never been used for the fabrication of devices. The study of the
relationships between the microstructure and the consequent properties in case of degradable
stents is a new field of research in biomaterials and our works are recognized between the
pioneer researches in this field.
1
Effect of electrodeposition current
density on the microstructure and the
degradation of electroformed iron for
degradable stents
Maryam Moravej 1,2, Sofiene Amira 3, Frédéric Prima 4, Ahmed Rahem3, Michel Fiset 2 and Diego Mantovani 1,2
1. Laboratory for Biomaterials and Bioengineering, Department of Mining, Metallurgy and Materials Engineering & University Hospital Research Center, Université Laval, Québec City, Que. G1V 0A6, Canada 2. Department of Mining, Metallurgy and Materials Engineering, Pavillon Adrien-Pouliot, 1065 avenue de la Médecine, Local 1745D, Université Laval, Québec City, Que. G1V 0A6, Canada
3. Aluminium Technology Centre, Industrial Materials Institute, National Research Council Canada 501, boul. de l'Université Est, Saguenay, Québec, Canada G7H 8C3
4. Laboratory for Physical Metallurgy, École Nationale Supérieure de Chimie de Paris, Université Pierre et Marie Curie, Paris 6, France
Corresponding author: Diego Mantovani Contact address:
Laboratory for Biomaterials and Bioengineering
Department of Mining, Metallurgy and Materials Engineering Pav. Adrien-Pouliot, 1745-E, Laval University
1065 Ave de la Médecine
Québec City, QC, G1V 0A6, Canada Phone: (418) 656-2131 ext. 6270 Fax: (418) 656-5343
E-mail: Diego.Mantovani@gmn.ulaval.ca www.lbb.gmn.ulaval.ca
*Text Only
2
Abstract
Pure iron has become one of the most interesting candidate materials for degradable metallic stents due to its high mechanical properties and moderate degradation. In this work we studied the effect of electrodeposition current density on microstructure and degradation of pure iron films electrodeposited on Ti alloy substrate for degradable metallic stent application. Iron sheets were produced by electrodeposition using four different current densities 1, 2, 5 and 10 A.dm-2. The films were then
studied by SEM (scanning electron microscope) and EBSD (electron backscatter diffraction) to observe the surface morphology, grain size and orientation. Potentiodynamic polarization and static immersion tests were used to determine the corrosion rate and to study the degradation behavior of iron films, respectively. The Current density was found to significantly influence the texture, the grain size and the grain shape of the electrodeposited iron. At current densities of 1, 5 and 10 A.dm-2, weak textures
corresponding to <1 0 1>, <1 1 1> and <1 1 2> in the normal (electrodeposition) direction were obtained, respectively. At these current densities, an average grain sizes smaller than 3 µm were also obtained. However, at 2 A.dm-2, a strong <1 1 1>//ND texture with density of 7.4 MUD was obtained with larger average grain size of 4.4 µm. The microstructure of iron samples changed after annealing at 550˚C because of the induced recrystallization. Different corrosion rates were obtained from potentiodynamic polarization curves of iron films deposited at different current densities because of their microstructures. Fe-2 showed the lowest corrosion rate due to its larger grains size and its texture. The corrosion rates of all iron samples decreased after annealing. Static degradation showed lower corrosion rates for iron because of the formation of a degradation layer on samples surface which reduced the degradation reaction rate. The degradation morphology was uniform for Fe-2 due to its strong texture. On the other hand, microscopic pits were found for Fe-1, Fe-5 and Fe-10.
3
1 Introduction
Coronary stents are mesh-like tubular scaffolds which are inserted on angioplasty balloon and expanded in blocked coronary arteries to keep them open [1]. Current stent technology is based on the use of permanent stents made from corrosion resistance materials such as 316L stainless steel. However, it has been shown that the role of stenting is temporary and limited to several months after implantation during which the artery is remodeled. After this period, the presence of stent in the artery could not provide any beneficial effects [2]. In this context, degradable metallic stents have been developed and evaluated during the last decade. These stents provide the required scaffolding to the artery and degrade gradually by physiological ways [3, 4]. Although corrosion is generally considered as a failure in metallurgy, for specific applications it might be useful, such as degradable stents. The stent is expected to degrade and corrode when implanted into the physiological site, and surrounded by physiological media, blood, and the surrounding cells and tissue. The corrosion products are expected to be removed by the body physiological pathways. Therefore, the candidate metals for this application should not induce toxic effects to the cells, tissues and the overall body [3, 5]. Magnesium and iron-based alloys are two candidates suitable for degradable stents. These are both essential elements for the body with higher daily intake levels compared to other metals [3, 6]. Uniform and moderate (around 12 months) degradation is also a requirement for degradable stents because localized corrosion could result in mechanical failure of the metallic implant and very fast corrosion (less than 6 months) may results in total dissolution of the implant in a short period of time, and therefore leads to clinical complications. [5].
We previously reported the fabrication and evaluation of electroformed pure iron aimed to degradable stents [7, 8]. Electrodeposition is a technique generally used to produce coatings which improve the surface conditions of the substrate metal [9]. However, we have shown that this technique can be used for production of iron films with targeted mechanical and degradation properties for a structural application as degradable stent. Metals with fine grain size, different microstructures and textures, different forms and thicknesses can be produced by electrodeposition [10, 11]. The microstructure and texture of electrodeposited metals is strongly affected by the deposition conditions and is particularly sensitive to parameters including current density, electrolyte composition, temperature, pH and substrate [11, 12]. The corrosion resistance of electrodeposits depends in particular on their chemical composition and also on their crystallographic orientation [13, 14]. It has been shown that when a metal is exposed to a corrosive environment, the corrosion resistance of each grain varies because of the
4
difference in the binding energy of atoms between the crystallographic planes [15]. Therefore, crystallographic orientation (texture) plays an important role on the corrosion rate and form of metals and it is essential to investigate the relation between texture and corrosion for degradable stent materials. In the case of electroformed iron, a strong (1 1 1) texture with grain size of 4 µm was obtained at current density of 2 Adm-2. This texture showed a uniform corrosion faster than that of Armco ® iron with 25 µm grains [7, 8]. However, the corrosion behavior of electroformed iron with other textures has not yet been studied. In this work, we report the effect of electrodeposition current density on microstructure, crystallographic orientation and thereby corrosion rate and form of iron. This information is mandatory in order to produce iron stents with targeted microstructure and targeted degradation.
2 Materials and Methods
The details on electrodeposition set-up and parameters including electrolyte, additives, temperature, pH, cathode and anode were presented elsewhere [7]. Different current densities of 1, 2, 5 and 10 Adm-2 were applied for 8, 4, 2 and 1h respectively to obtain ~100-µm thick foils with different microstructures. Based on the electrodeposition current density, iron samples will be named as Fe-1, Fe-2, Fe-5 and Fe-10 thereafter. Foil-shaped samples were used in this study mainly for the feasibility of further characterizations that require planar specimens. However, mini-cylindrical samples (diameter of 2-4 mm) can also be produced by this technique. The foils were removed mechanically from the substrate after the electrodeposition process. They were annealed at 550˚C for 1 h in high purity argon atmosphere. Annealing of as-laser-cut stents is an important step in stent fabrication in order to remove the stress from laser cutting and to induce recrystallization in as-drawn stent tube which is initially in cold-worked state. For 316L SS stents, the annealing is usually performed in a vacuum furnace at 1100-1200˚C to produce a recrystallized and fine microstructure [16, 17] . In case of electroformed iron, we have shown that annealing at 550˚C produces a recrystallized structure and highly increases the ductility [7]. Therefore, the microstructural observation and degradation testing were performed on electroformed iron on both as-deposited and annealed state.
The surface morphology of as-electroformed films was studies using Scanning Electron Microscope (SEM; JOEL JSM-840A). To investigate the texture of deposits, Orientation Imaging Microscopy (OIM) was performed using Backscatter Electron Microscope. For EBSD investigation, the cathodic surface of the specimens (electrodeposit-substrate interface) were mechanically ground with 1000 grit SiC paper
5
using water as lubricant, and then successively polished with 15, 9, 3 and 1 µm diamond pastes a few minutes each. The final step was a surface polishing with an alkaline colloidal silica solution (0.04 µm granulation) for 2 minutes. The samples were cleaned with warm water and dried with compressed air. EBSD measurements were performed using a Hitachi SU-70 FE-SEM equipped with an EBSD system from Oxford HKL. The microscope was operated with an accelerating voltage of 20 kV and a probe current of 3 nA. The automatic beam scanning used step sizes of 0.5-0.7 µm. A magnification of 700× was used to analyze the spe i e s’ surfaces. The magnification used to analysis the specimens cross section was chosen depending on their thickness. The SEM/EBSD data were acquired and processed by the Oxford HKL CHANNEL 5 software.
Corrosion form and rate of the samples were investigated i Ha k’s solutio whi h si ulated the io i composition of blood plasma. The solutio was prepared y dissol i g Ha k’s odified salt H1 , Sigma Aldrich, USA) in deionized water and its temperature and pH were adjusted to 37˚C and 7.4 respectively. The o positio of Ha k’s solutio was prese ted i Ref. [18]. Two different corrosion testing techniques including potentiodynamic polarization and static immersion were applied. Potentiodynamic polarization (ASTM G59) test was carried using a Princeton Applied Research Model 273 galvanostat/potentiostat. A platinum electrode with the surface area of 1 cm2 was used as counter
electrode while an Ag/AgCl saturated electrode was used as reference electrode. Iron foils were cut into pieces of 1 cm2 surface area each and mounted in acrylic resin. The surface was then polished with 2400 and 4000 grit SiC paper before the electrochemical testing. The corrosion current density was determined from Tafel extrapolation of the resulting potential-current curves and the corrosion rate was subsequently calculated based on the corrosion current density according to the following equation [19]: 3
3.27 10
i
corrEW
CR
x
(1)In this equation CR is the corrosion rate (mm year-1), icorr is the orrosio urre t de sity μA -2), EW is
the equivalent weight (28 g eq-1 for Fe a d ρ is the aterial de sity i g -3 (7.87 for Fe).
In static immersion test, based on ASTM G31 standard [20], iron specimens (20×10×0.1 mm3) were
polished by 4000 grit SiC paper, cleaned in ultrasonic bath by deionized water and ethanol, dried and weighted. They were the i ersed i Ha k’s solutio for h 1 days . After that period, the specimens were removed from the solution, rinsed by water and ethanol and dried. The degradation
6
layer was then removed by peeling. The specimens were subsequently rinsed with deionized water and ethanol, dried and stored in desiccator for 48 h before being weighted. Degradation rate was calculated based on the weight loss of specimens according to Equation 2,
4
8.76 10
. .
W
DR
x
A t
(2)where DR is the degradation rate in mm per year (mm y-1), W is the weight loss (g), A is the area (cm2), t is the time of exposure (h) and is the density (g cm-3). The surface of samples after the degradation
products were removed was studied using SEM to identify the form of corrosion in the surface.
3 Results
3.1 Microstructure
SEM images of the surface morphology of iron (electrodeposit-bath interface) deposited at different current densities are presented in Figure 1. In this Figure, electrodeposit-bath interface is shown as this surface can better show the effect of current density on crystalline growth of the iron foils. As the images show, the crystallite size appeared to decrease with the increase of current density from 1 to 10 A.dm-2. The shape of the crystallites also changed significantly with increasing of the current density as they appeared to be sharper at higher current densities.
Figure 1. Surface morphology of electroformed iron deposited at (a) 1, (b) 2, (c) 5 and (d) 10 Adm-2
Figure 2 shows the color key code inverse pole figure used for OIM imaging. Figure 3 presents the normal direction orientation EBSD maps in the color-key mode of the cathodic surfaces and cross-sections of electroformed iron. The cathodic surface was selected for microstructural studies and corrosion testing since this surface would be the one in contact with blood (more corrosive attack) if an electroformed iron stent is implanted. The grain size distribution charts showed in Figure 3 are related to the surface images. For the studied iron samples, the values of the average grain size and the maximum texture intensity as expressed in MUD (mean uniform distribution) are presented in Table 1.
7
Figure 3. Normal direction maps as shown with color key code inverse pole figure and grain size distribution of iron electrodeposited at : (a) 1, (b) 2, (c) 5 and (d) 10 Adm-2. Column 1 displays the surfaces while column 3 shows the
cross-sections of the electrodeposited samples.
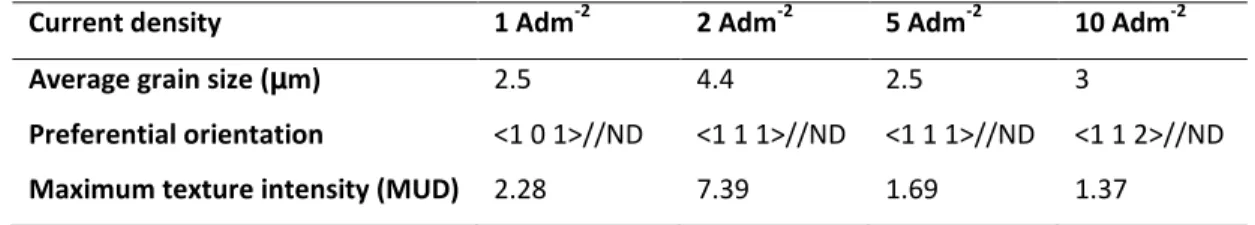
Table 1. Average grain size and preferential orientation information of electrodeposited iron as determined from Figure 3.
At current density of 1 Adm-2 a fine-grain microstructure was produced with the average grain size of ~
2.5 µm. Although strong fiber texture was not observed for iron deposited at this current density, there was a weak preferential orientation of grains with (1 0 1) planes parallel to the sheet surface (green grains). The maximum intensity of this <1 0 1> fiber texture was 2.28 MUD. According to the grain size distribution chart, most grains are smaller than 4 µm while few larger grains could be observed. The cross section image shows small equiaxed grains in the cathodic face of the layer which was formed on the substrate (the lower part of Figure 3.a-3). These equiaxed grains were seen in the first 20 µm of the layer thickness and later grew to columnar larger grains and as shown in Figure 3.a-3, the grains are larger in the center and upper part of the iron layer. As the current density increased to 2 A.dm-2, a strong texture in the normal direction (i.e <1 1 1> fiber texture) with a density of 7.39 MUD was found in the perpendicular direction to the surface of iron film (blue grains). It can also be seen that the grains were larger for the film deposited at 2 A.dm-2 compared to the 1 A.dm-2 (4.4 µm versus 2.5 µm). The
cross-section image (Figure 3.b-3) confirms also the preferential orientation of <1 1 1>//ND and shows the presence of columnar grains almost all over the thickness of iron film. An increase in the current density to 5 A.dm-2 resulted in grain refinement and a significant change in texture. The strong <1 1 1>
fiber texture cannot be found for the iron film deposited at this current density and the grain orientation is almost random and composed of two weak <1 1 1>//ND and <1 0 1>//ND textures. The average grain size also decreased to 2.5 µm. As Figure 3.c-3 demonstrates, no columnar growth could be seen for this current density and all grains were equiaxed in cross-section. However, at 10 A.dm-2, a slight grain growth was observed for iron films with strong columnar growth as shown in Figure 3.d-3, and a weak <1 1 2> texture in the normal direction was noted (pink grains).
Annealing of the electrodeposited iron at 550˚C significantly changed its microstructure and texture as illustrated in Figure 4. Annealing resulted in recrystallization in all iron films deposited at different current densities. After annealing, iron deposited at 1 A.dm-2 recrystallized with a slight grain growth as
the average grain size increased from 2.5 to 3.7 µm. The preferential orientation of <1 0 1>//ND also change to a stronger texture <1 0 1>//ND with the maximum intensity of 2.8 MUD. The cross-section
8
image (Figure 4.a-3) shows that the columnar grains changed after annealing to more equiaxed grains with different sizes depending on the layer thickness. Indeed, the initial grains formed on the substrate are still much finer than the ones on the outer layers which grew more significantly by annealing.
Figure 4. EBSD orientation images and grain size distribution of iron electrodeposited at (a) 1, (b) 2, (c) 5 and (d) 10 Adm-2 annealed at 550˚C for 1 h. Column 1 displays the surfaces while column 3 shows the cross-sections of the annealed samples.
Table 2. Average grain size and preferential orientation information of electrodeposited iron annealed at 550˚C for 1 h. Data were extracted from Figure 4.
For iron film deposited at 2 A.dm-2, annealing resulted also in both recrystallization and grain growth.
The intensity of <1 1 1> fiber texture component decreased from 7.4 to 3.5 MUD showing that annealing produced a more random distribution of grains while the average grain size nearly doubled by the annealing. After annealing, the presence of columnar grains is still visible although their shape and size has changed due to recrystallization and grain growth. A similar behavior was observed for iron deposited at 5 A.dm-2. Annealing increased the grain size from 2.5 to 6.1 µm which confirms the
significant grain growth induced by the thermal treatment. However, there was no change in texture after annealing. Iron film electrodeposited at 10 A.dm-2 recrystallized to a finer microstructure. The average grain size decreased from 2.5 to 1.9 µm. However, unlike the other iron films, the initial texture component increased after annealing as the intensity of <1 1 2> fiber increased to 2.31 MUD. The cross-section image of the annealed microstructure (Figure 4.d-3) shows that although the columnar grains are formed all over the thickness of the film, their diameter has noticeably decreased. Also, the few equiaxed grains seen in the microstructure before annealing could not be found in the annealed microstructure.
3.2 Corrosion testing
3.2.1 Potentiodynamic polarization
Potentiodynamic polarization curves of as-electrodeposited iron films are presented in Figure 5 and the resulting corrosion current density and corrosion potential related to the curves are summarized in Table 3. The corrosion current densities were determined from Tafel extrapolation of the curves
9
presented in Figure 5. The lowest corrosion current and the highest corrosion potential were observed for iron deposited at 2 A.dm-2 showing that it had the lowest corrosion rate and it is the least active
among the studied samples. The calculated corrosion rates based on the corrosion currents are shown in Figure 6. The highest corrosion current found for iron deposited at 5 Adm-2 while the corrosion potentials of Fe-5 and Fe-1 were almost the same. The corrosion rate (CR) of iron films can be ordered as follows: CR Fe-2 < CR Fe-10 < CR Fe-1 < CR Fe-5.
Figure 5. Potentiodynamic polarization curves of iron electrodeposited at different current densities.
Table 3. Corrosion current density and potential of iron electrodeposited at different current densities: the data were extracted from curves in Figure 5.
Figure 6. Corrosion rates of iron electrodeposited at different current densities: the rates were calculated from corrosion current density values presented in Table 3.
After annealing, the potentiodynamic polarization curves of iron electrodeposited films changed as shown in Figure 7. It can be seen that for all iron films deposited at different current densities the corrosion potential increased while the corrosion current decreased. This can confirm that annealing decreased the activity of all Fe samples and also decreased their corrosion rate. Among iron films, Fe-5 had the lowest corrosion potential and highest corrosion current. As shown in Table 4, Fe-2 showed a lower corrosion potential than that of Fe-1 and Fe-10. However, its corrosion current was also lower than Fe-1 and Fe-1 showing that it had a slower corrosion (Figure 8). Although the corrosion rate of electroformed iron decreased after annealing, the same order in corrosion rates was observed for iron films deposited at different current densities i.e. : CR Fe-2 < CR Fe-10 < CR Fe-1 < CR Fe-5.
Figure 7. Potentiodynamic polarization curves of iron electrodeposited at different current densities and annealed at 550˚C for 1 h.
Table 4. Corrosion current density and potential of iron electrodeposited at different current densities and annealed at 550˚C for 1 h: the data were extracted from curves in Figure 7.
10
Figure 8. Corrosion rates of iron electrodeposited at different current densities: the rates were calculated from corrosion current density values presented in Table 4.
3.2.2 Static degradation
The corrosion rates calculated from the weight loss of iron samples were different from the corrosion rates calculated by potentiodynamic polarization test (Figure 9 versus Figure 6). The DRs from static tests are much smaller than CRs from potentiodynamic polarization. Fe-5 had the highest DR rate and the order of degradation rates for iron films was almost the same as that of potentiodynamic polarization. However, very small difference in DR was observed for iron samples deposited at 1, 2 and 10 A.dm-2 and they had very similar degradation rates
Figure 9. Degradation rate of as-deposited iron calculated from static degradation test ased o spe i e ’s weight loss during the test.
The morphology of the degraded surfaces showed different corrosion forms for iron films. As Figure 10 illustrates, the degradation forms appeared to be uniform for all samples and there was no noticeable localized attack at macroscopic scale. However, in high magnification images shown at the top-left of each figure, microscopically localized degradation can be observed. Fe-1 showed microscopic pitting while the corrosion was more uniform for Fe-2 with a similar effect to etching as the grain boundaries were revealed (Figure 10-b). For Fe-5, the corrosion appeared to be more severe with more noticeable pits than other microstructures which is in accordance with its higher DR compared to other samples. The microstructure of Fe deposited at 10 A.dm-2 also showed microscopic pitting attack.
Figure 10. Surface morphology of iron deposited at different current densities after static degradation (after the corrosion products were removed). (a) 1, (b) 2, (c) 5 and (d) 10 Adm-2, Small images on top-left show the same surface at higher
magnification.
The static DRs of annealed samples were still lower than those of as-electrodeposited sample as was observed for potentiodynamic polarization test. As shown in Figure 11, the DR decreased to 0.23-0.28 mm y-1 after annealing and the values were in the same range for all the iron films.
11
Figure 11. Degradation rate of electroformed iron annealed at 550˚C calculated from static degradation test based on spe i e ’s weight loss duri g the test.
Figure 12. Surface morphology of iron deposited at different current densities and annealed at 550 ˚C after static degradation (after the corrosion products were removed). (a) 1, (b) 2, (c) 5 and (d) 10 Adm-2,Small images on top-left show the same
surface at higher magnification.
Despite the difference in degradation morphology of annealed Fe samples, no obvious localized attack was observed (Figure 12). The degradation morphology was similar to etching effect in Fe-1 and Fe-2 as the grain boundaries can be seen for these microstructures. The corrosion attack appeared to be more intense for Fe-5 and Fe-10 which can be confirmed by their slightly higher DR rate.
4 Discussions
4.1 Microstructure
Electrodeposition is a feasible method to produce metallic layers with different microstructures and properties. Many parameters are involved in the electrodeposition process including the type of electrolyte, the concentration of ions, pH, the bath temperature, the degree of agitation, the substrate overpotential and/or current density, the mode of deposition (d.c. versus pulse plating), and the presence of additives in the electrolyte. In this work we found that current density strongly influenced the microstructure of electrodeposited iron. As Figure 1 shows, at 5 and 10 A.dm-2 well-faceted grains
can be observed on the surface morphology of iron which are different from the morphology of Fe-1 and Fe-2. The appearance of faceted grains with pyramidal shapes at 5 and 10 A.dm-2 might be explained by the significant evolution rate of hydrogen gas bubbles which increases with current density [21]. It is also generally believed that increasing the current density results in a decrease in the crystallite size of electrodeposits by increasing the nucleation rate [22]. This hypothesis primarily seemed to be true in this study as the crystallites appeared to be smaller and sharper as the current density increased from 1 to 10 A.dm-2 (Figure 1). However, some believe that higher current densities result in the increase of crystallite size and surface roughness [23]. Jartych et al. [24] observed an increase in the crystallite size of iron layer electrodeposited from chloride solution when the current density increased from 0.8 to 1.6 A.dm-2 . Based on our results from EBSD, we found that there was no direct correlation
12
between the electrodeposition current density and crystallite size. At 1 A.dm-2 a fine microstructure with the average grain size of 2.5 µm and a weak <1 0 1>//ND texture was formed. The growth of columnar grains observed in the cross-section image (Figure 3. a-3) is a common property of electrodeposited metals in which the diameter of columnar grains increases with the deposit thickness. Li et al. [25] observed that at lower current densities i.e. 0.1 - 1 A.dm-2, <1 1 0> texture was obtained for iron electrodeposited from chloride solution at 70˚C and pH=1.7. Since (1 0 1) and (1 1 0) planes belong to the same family of planes in bcc structure, it can be speculated that our result was similar to those previously obtained. Yoshimura et al. [22] also observed by XRD that the orientation index of (1 1 0) planes in electrodeposited iron (in a ferrous chloride-calcium chloride solution at pH= 2 and T=40˚C) was at its maximum when the current density was in the range of 0.1 - 1 A.dm-2.
In this study, when the current density increased to 2 A.dm-2 a highly <1 1 1> oriented texture was formed and the grain size increased. The increase of the grain size can be related to the presence of the texture which results in the growth of previously formed grains with (1 1 1) planes parallel to the sheet surface and inhibits the formation of new grains in other directions. Different theories have been developed to explain the texture formation during electrodeposition. The most realistic is called the geometrical selection theory, which suggests that the texture formation is attributed to the difference in the advance rate between different planes, and also attributed to the deposit surface morphology. In case of iron, it has been demonstrated that the texture growth resulted from minimizing the free energy of the system, and that the surface energy anisotropy played an important role in the formation of fiber texture which changes by varying the current density and other deposition parameters [25]. The microstructure changed significantly when the current density was increased to 5 A.dm-2. The strong
(1 1 1) texture almost disappeared and the grain size decreased to ~ 2.5 µm. Unlike Fe-1 and Fe-2, in which columnar grains were formed, equiaxed grains were observed in the cross-section of Fe-5 without the presence of columnar grains. For electrodeposited metals, in order to obtain equiaxed grains, continuous nucleation of new grains should occur during the deposition. In general, factors that promote the formation of defects (e.g., dislocations and twins) tend to reduce the crystallite size of metallic deposits [23]. Fe film deposited at 5 A.dm-2 had a higher density of observable defects such as porosity compared to other Fe films. Generally, the increase of the current density leads to the formation of more defects in the microstructure. Therefore, the grain refinement and the formation of equiaxed grains can be attributed to the presence of more microstructural defects for Fe-5. Increasing the current density to 10 A.dm-2 resulted in a decrease in the texture intensity and a change into (1 1 2)
13
density of 10 A.dm-2 was already reported by Yoshimura et al [22]. The overall decrease in texture density is attributed to an increase of the nucleation rate when the current density increases; the increased nucleation does not favor the selective grain growth, and is, therefore, responsible for lowering the texture strength as the deposition rate increases [25]. Although a decrease in grain size was expected for Fe-10, it slightly increased to ~ 3 µm with the increase of current density and the columnar grains were observed. The increase in the grain size can again be related to the growth of columnar grains, though their formation at such a high current density is not clear. Jartych et al. [24] mentioned that at higher current densities, dendrite structures are formed leading to the formation of coarser and spongy electrodeposits. This could therefore be the reason for the slight grain coarsening in Fe-10. Generally, the changes in texture of electrodeposited Fe with the deposition condition could be attributed to the hydrogen co-deposition which may modify the surface-energy anisotropy of the deposit. When the hydrogen co-deposition takes place, it affects the surface energy of the deposit and the surface energy is lowered. Lowering the surface-energy is different for various crystallographic planes because of their different adsorption abilities. It is, therefore, expected that, as the hydrogen co-deposition increases, the texture will change from one type to another, due to the changes in the surface-energy anisotropy [25, 26].
The annealing of different electrodeposited metals even at low temperatures has been shown to change significantly their microstructure through recovery and recrystallization. It has been shown that the activation energy for recrystallization of electrodeposited copper is considerably less, by a factor of two to three, than that for recrystallization of the bulk wrought copper [27]. For Fe-1, the recrystallization of a new microstructure with larger grains and stronger texture after annealing confirms this hypothesis. Electrodeposited metals contain a large concentration of point (vacancies), linear (dislocations) and planar defects (twins). These defects originate intrinsically as a result of the electrodeposition process. They increase the stored energy of the metal which is the activation energy for recrystallization upon annealing. The defect movement is thermally activated and annealing of deposits produces large changes in the electron transport, mechanical, crystallographic texture, and microstructural characteristics. During annealing, the defects either merely rearrange themselves in a different configuration (recovery), or anneal out, reducing the defect concentration and causing corresponding microstructural changes (recrystallization) [28]. The probability of nucleation in each grain during recrystallization is related to the stored energy of that grain. Therefore, the nucleation of new grains is closely related to the initial orientation of each grain before annealing. The slight grain growth observed after the annealing of Fe-1 can be due to the fact that its recrystallization temperature was slightly lower
14
than the annealing temperature of 550˚C and therefore, grains growth occurred after recrystallization. For Fe-2, a more significant grain growth was observed after annealing. This can be explained possibly by the higher quantity of stored energy by electrodeposition at 2 A.dm-2 which had a strong <1 1 1>//ND
texture. It has been shown that in cold-rolled iron, <1 1 1> texture contains more stored energy than other textures [29]. This can lead to the initiation of recrystallization of iron at lower temperatures and consequently grain growth at 550˚C.
Although the intensity of <1 1 1>//ND texture in Fe-2 decreased by recrystallization and the formation of a more random orientation was observed, it retained a texture density of 3.54 MUD which relates to the higher stored energy of <1 1 1> texture. Hansen et al. [30] have reported that the electrodeposited silver microstructure consisted of nanocrystalline grains with strong preferred grain orientations transformed during room temperature storage into a self-annealed microstructure with considerably larger grains and altered preferred orientations. Since the nucleation factor for (1 1 1) grains is higher than other orientations due to their higher stored energy, the probability of formation of these grains is higher. The presence of (1 1 1) texture with a density of 3.54 MUD after the recrystallization of Fe-2 can be explained based on this theory.
Grain growth was also observed for Fe-5 after annealing without any noticeable changes in the texture. As the density of defects increases with current density, a higher stored energy could be expected for Fe-5 and therefore, recrystallization could occur at lower temperature. Hence, heating at 550˚C resulted in grain growth as observed in Figure 4. However, this behavior was not observed for Fe-10. The <1 1 2>//ND texture intensity increased and the grain size decreased with annealing. This observation might be due to a second recrystallization in microstructure. As the density of structural defects was supposed to be higher at 10 A.dm-2, first recrystallization could have happened at lower temperatures leading to the formation of a randomly oriented microstructure. A second re-crystallization started at higher temperatures which once again arranged the crystallites along the (1 1 2) planes parallel to the sheet surface and formed fine columnar grains during the annealing process. Such observation of two-step recrystallization during annealing has been reported by Qi et al. [31] and Enriquez et al [32, 33] for electrodeposited CdTi films.
15
4.2 Corrosion and degradation testing
Degradation of metallic implants in corrosive media such as physiological media is affected both by the properties of the materials (e.g. composition and microstructure) and the properties of the electrolyte (e.g. pH, temperature, ions, etc). As our aim was to develop and evaluate degradable electroformed iron for stents, this study focused on the effect of microstructure on degradation in a physiologically-si ulated ele trolyte Ha k’s solutio . For a y aterials, the sus epti ility of physiologically-si gle rystals to corrosion has been shown to be related to crystallographic orientation. Therefore, it is expected that electrodeposited iron films with different textures show different degradation rates and forms. Potentiodynamic polarization test showed different corrosion rates for iron films electrodeposited at different current densities. It is believed that in the case of bcc Fe single crystals, the close-packed planes be the most susceptible to pitting corrosion [34]. Schreiber et al. [35] studied the effect of grain orientation and grain boundaries on anodic dissolution rate of iron and found that grains with (1 1 1) planes parallel to the surface had the highest dissolution rate. They presented a geometrical model to explain the correlation between electrochemical behavior and atom density on (1 0 0), (1 0 1) and (1 1 1) planes in iron. They explained that although (1 1 1) has the largest atom density in the top layer, the distance to the next layer is larger and the surface atoms are less strongly bound. (1 0 1) has also large distance to the next atom layer and trenches in the surface, which mean a partial hydration of the surface atoms. Therefore, these planes are more susceptible to corrosion. However, (1 0 0) plane seems to be the most stable against active dissolution. The surface shows trenches, but the next iron layer is closer to the top layer compared with the other orientations. Hence, this stabilizes the surface atoms against corrosion [14]. We observed that the lowest corrosion rate was found for Fe-2 which had a strong <1 1 1>//ND texture. The reason for this contradiction can be attributed to the largest average grain size of Fe-2 compared to other iron foils. It can be seen from Figure 3-b that Fe-2 had the largest grains and therefore the lowest volume of grain boundaries. Since grain boundaries have a higher potential for corrosive attack than the grains, Fe-2 was less prone to corrosive attack and had therefore a slower corrosion. Fe-10 had a higher corrosion rate that Fe-2 but lower than that of Fe-1 and Fe-5. The microstructure of Fe-10 showed randomly-oriented grains (weak <1 1 2>//ND texture) with columnar grains smaller than those of Fe-2 but larger than those of Fe-1 and Fe-5. Its corrosion rate was therefore higher than Fe-2 because of its higher volume of grain boundaries and also higher density of microstructural defects. The highest corrosion rate was found for Fe-5. It had smallest average grain size with equiaxed grains which could provide it with the highest volume grain boundaries. Also, additional porosity was observed for Fe-5 than for other samples showing that it could have more structural
16
defects and hence, a faster corrosion attack. Fe-1 showed the second highest corrosion rate. Although Fe-1 deposited at the slowest rate, it has smaller grains than that of Fe-2 and a weak <1 0 1>//ND texture. Since (1 0 1) planes are considered to be close-packed in bcc structure, it could be considered more susceptible to corrosion attack than other planes [35]. The presence of (1 0 1) planes parallel to the surface can therefore play a role in the faster corrosion of Fe-1 compared to Fe-2 and Fe-10. Although it has already been shown that grains with (1 1 1) planes parallel to the surface are the most susceptible grains to corrosion attack in iron, the presence of other grains with different orientations and thereby corrosion susceptibilities could increase the overall corrosion rate as (1 1 1) can act as anodic sites in presence of more «cathodic» grains. This can explain the higher corrosion rate of Fe samples which had weaker textures compared to Fe-2.
Although the grain size and microstructure of Fe samples change after annealing, the same order in their corrosion rate was observed. Basically, the corrosion rate of all samples decreased significantly after annealing. This is due to the fact that annealing induces recrystallization in iron films which reduces the density of structural defects of as-deposited material also release the internal stress produced by electrodeposition. The decrease in the volume fraction of grain boundaries due to annealing can be another reason for the decrease in corrosion rate. The newly recrystallized grains are therefore less susceptible to corrosion and this can decrease the overall corrosion rate. Annealed Fe-2 had the lowest corrosion rate as its grains were the largest among all microstructures. Fe-5 showed the highest corrosion rate in spite of its grain growth. The presence of equiaxed grains could be the reason for this behavior. Elongated grains were still present after annealing of Fe-1 and Fe-10 which can reduce the total volume of grain boundaries. In Fe-10, small grains observed in the surface (Figure 4.a-1) were elongated all over the thickness of the film, shown in cross-section image, which reduced the grain boundary volume. Also, a <1 1 2> texture formed after annealing of Fe-10 which could slightly reduce its corrosion rate as (1 1 2) planes are less closely-packed and therefore less susceptible to corrosion. The values of degradation rates calculated from static immersion tests were lower than those determined from potentiodynamic polarization tests. This was due to the formation of a degradation layer on the surface of the samples after 24-48 h of immersion. This degradation layer was found to be composed of iron, oxygen, phosphorus, chlorine and calcium [8] and decreased the degradation rate of all samples. Since the degradation after the formation of this layer should continue by the diffusion of Fe ions through the layer, slower degradation rate is obtained compared to potentiodynamic polarization test which is a rapid corrosion testing in which the surface remains intact until the last stages of the test.
17
Potentiodynamic polarization of Fe-2 showed a decrease in the rate of its anodic reaction compared to other samples which can be related to the initial formation of corrosion products on its surface. The static degradation corrosion rates of iron samples determined from immersion tests were in the following order: Fe-2 < Fe-1 ≤ Fe-10 < Fe-5. This order is in accordance which that of corrosion rates determined from potentiodynamic polarization tests. However, the values of the degradation rates varied from 0.35 to 0.52 mm y-1 with a slight difference between the studied samples. This is obviously attributed to the formation of degradation layer on the surface of the samples which not only lowers the degradation rate but also reduces the effect of microstructure of each samples on its degradation rate since the surface would not be exposed directly to the electrolyte. However, the morphologies of the degraded surface of the samples were different after the degradation layer was removed. Fe-2 was the only microstructure in which microscopic pits were not observed. Since Fe-2 has a very strong <1 1 1> texture, its uniform degradation can be related to this texture. Microscopic pits observed for other microstructures including Fe-1, Fe-5 and Fe-10 could be caused by their more randomly distributed grains and textures. Because the susceptibility of different crystallographic planes are not the same for polycrystalline materials, the grains oriented in more susceptible directions could act as anodic sites and localized attack (pitting) occurs. Also, structural defects produced by electrodeposition including porosity, dislocations, grain boundaries, twins, etc. could play an important role in the formation of anodic sites and thereby micropits. These micropits showed to increase the total degradation rates compared to Fe-2 which had the more uniform degradation and therefore could be interesting for application as degradable stents. A more rapid corrosion is desired for pure iron as a degradable metal for stents since its in vivo degradation is slower than the value calculated in vitro. The reason for the slower in vivo degradation is that the stent material is covered firstly by blood and then by cells after the implantation [3]. The presence of micropits could be beneficial provided that they are shallow and uniformly distributed in order to avoid any deeper localized attack which could lead to the failure of implant.
After annealing the static degradation rates of the samples decreased to 0.23-0.27 mm y-1 which can be
related to the effect of heat treatment on microstructure. However, the DRs of all samples after annealing were nearly the same because the microstructural effects on degradation were reduced by the formation of degradation layer. The uniform degradation observed for all iron samples after annealing (Figure 12) can be attributed to the decrease in the density of structural defects and internal stress which are actually considered to increase the formation of localized corrosion.
18
5 Conclusions
Electroformed iron films with different texture and microstructure were effectively produced by varying the electrodeposition current density to 1, 2, 5 and 10 A.dm-2. Iron deposited at 2 A.dm-2 had a strong <1
1 1>//ND texture with the average grain size of ~ 4 µm while other films had more randomly oriented microstructures with smaller grain size and weak <1 0 1>//ND and <1 1 2>//ND textures. Annealing at 550˚C for 1 h was found to change the microstructure of electroformed iron by inducing recrystallization. In Fe-10, annealing resulted in recrystallization of new finer grains compared to as-electrodeposited iron while in Fe-1, Fe-2 and Fe-5, grains growth was observed after annealing. Recrystallization of electrodeposited iron after annealing can be attributed to the high amount of stored energy in the material due to the high density of structural defects produced by electrodeposition. The study of the corrosion of electroformed iron by potentiodynamic polarization revealed that texture and microstructure including grain boundaries volume fraction play an important role on the corrosion rates. The corrosion rate of iron samples increased by changing the current density in the following order: Fe-2 < Fe-10 < Fe-1 < Fe-5. In the case of the immersion tests, the effect of microstructure on degradation rate was less significant especially after annealing since in long-term degradation testing, a degradation layer is formed shortly after the test which inhibits the direct contact of the sample surface with the electrolyte. Different degradation morphologies were observed for iron samples deposited at different current densities after the static test. Fe-2 with strong <1 1 1>//ND texture showed the most uniform degradation form while other samples developed micropits caused by preferential corrosion attack on different grains. The formation of micropits could be interesting for the application of electroformed iron as degradable stent material since they can increase the overall degradation rate. The study of the distribution of pits and the long term degradation evaluation of iron samples deposited at different current densities is mandatory to ensure that the localized attack would not lead to mechanical failure of the implant.
19
6 Acknowledgements
The authors would like to acknowledge the collaboration of André Ferland, the technician of the Department of Mining, Metallurgy and Materials Eng. of Université Laval for the scanning electron microscopy studies. The collaboration of Helene Gregoire and Genevieve Simard from Aluminum Technology Centre, National Research Council Canada for sample preparation and EBSD studies is highly appreciated. This work was financially supported by the National Science and Engineering Research Council of Canada and M. Mora ej’s PhD gra t y Hydro Que e .
7 References
[1] J.E. Moore, G. Zouridakis, Biomedical technology and devices handbook, CRC Press, Boca Raton, 2004.
[2] A. Colombo, E. Karvouni, Biodegradable stents - "Fulfilling the mission and stepping away", Circ., 102 (2000) 371-373.
[3] M. Peuster, P. Wohlsein, M. Brugmann, M. Ehlerding, K. Seidler, C. Fink, H. Brauer, A. Fischer, G. Hausdorf, A novel approach to temporary stenting: degradable cardiovascular stents produced from corrodible metal - results 6-18 months after implantation into New Zealand white rabbits, Heart, 86 (2001) 563-569.
[4] H. Hermawan, D. Dube, D. Mantovani, Developments in metallic biodegradable stents, Acta Biomater., 6 (2009) 1693-1697
[5] P. Erne, M. Schier, T.J. Resink, The road to bioabsorbable stents: reaching clinical reality?, Cardiovasc. Intervent. Radiol., 29 (2006) 11-16.
[6] B. Heublein, R. Rohde, V. Kaese, M. Niemeyer, W. Hartung, A. Haverich, Biocorrosion of magnesium alloys: a new principle in cardiovascular implant technology?, Heart, 89 (2003) 651-656.
[7] M. Moravej, F. Prima, M. Fiset, D. Mantovani, Electroformed iron as new biomaterial for degradable stents: Development process and structure-properties relationship, Acta Biomater., 6 (2010) 1726-1735. [8] M. Moravej, A. Purnama, M. Fiset, J. Couet, D. Mantovani, Electroformed pure iron as a new biomaterial for degradable stents: In vitro degradation and preliminary cell viability studies, Acta Biomater., 6 (2010) 1843-1851.
[9] N. Kanani, Electroplating: Basic Principles, Processes and Practice, 1st edition ed., Elsevier Science, 2005.
20
[10] J.A. MacGeough, M.C. Leu, K.P. Rajurkar, A.K.M. De Silva, Q. Liu, Electroforming process and application to micro/macro manufacturing, Cirp Annals-Manuf. Technol., 50 (2001) 499-514.
[11] J.W. Dini, Electrodeposition : the materials science of coatings and substrates, Noyes Publications, Park Ridge, N.J., U.S.A., 1993.
[12] M. Schlesinger, M. Paunovic, Modern electroplating, 4th ed., Wiley, New York, 2000.
[13] R. Ramanauskas, P. Quintana, L. Maldonado, R. Pomes, M.A. PechCanul, Corrosion resistance and microstructure of electrodeposited Zn and Zn alloy coatings, Surf. Coat. Technol., 92 (1997) 16-21. [14] A. Schreiber, J.W. Schultze, M.M. Lohrengel, F. Karman, E. Kalman, Grain dependent electrochemical investigations on pure iron in acetate buffer pH 6.0, Electrochim. Acta, 51 (2006) 2625-2630.
[15] H. Asgari, M.R. Toroghinejad, M.A. Golozar, On texture, corrosion resistance and morphology of hot-dip galvanized zinc coatings, Appl. Surf. Sci., 253 (2007) 6769-6777.
[16] P. Poncin, J. Proft, Stent tubing: understanding the desired attributes, California: ASM International, 253 (2003).
[17] C. Meyer-Kobbe, B. Hinrichs, Why the annealing of 316LVM-Stents is so important,
http://www.meko.de/downloads/316LVM.pdf.
[18] J. Levesque, H. Hermawan, D. Dube, D. Mantovani, Design of a pseudo-physiological test bench specific to the development of biodegradable metallic biomaterials, Acta Biomater., 4 (2008) 284-295. [19] ASTM G59 - 97, Standard Test Method for Conducting Potentiodynamic Polarization Resistance Measurements, ASTM International, West Conshohocken, PA, 2009, DOI: 10.1520/G0059-97R09. [20] ASTM G31 - 72, Standard Practice for Laboratory Immersion Corrosion Testing of Metals, ASTM International, West Conshohocken, PA, 2004, DOI: 10.1520/G0031-72R04.
[21] H. Matsushima, A. Ispas, A. Bund, W. Plieth, Y. Fukunaka, Magnetic field effects on microstructural variation of electrodeposited cobalt films, J. Solid State Electrochem., 11 (2007) 737-743.
[22] S. Yoshimura, S. Yoshihara, T. Shirakashi, E. Sato, Preferred Orientation and Morphology of Electrodeposited Iron from Iron(Ii) Chloride Solution, Electrochim. Acta, 39 (1994) 589-595.
[23] F. Ebrahimi, Z. Ahmed, The effect of current density on properties of electrodeposited nanocrystalline nickel, J. Appl. Electrochem., 33 (2003) 733-739.
[24] E. Jartych, M. Jaochowski, M. Budzyski, Influence of the electrodeposition parameters on surface morphology and local magnetic properties of thin iron layers, Appl. Surf. Sci., 193 (2002) 210-216.
21
[25] D. Li, J. Szpunar, Textural evolution in electrodeposits under the influence of adsorbed foreign species: Part I Textural evolution in iron electrodeposits affected by hydrogen co-deposition, J. Mater. Sci., 32 (1997) 5513-5523.
[26] Y. Wang, R. Peng, J. Almer, M. Odén, Y. Liu, J. Deng, C. He, L. Chen, Q. Li, L. Zuo, Grain-to-grain stress interactions in an electrodeposited iron coating, Adv. Mater., 17 (2005) 1221-1226.
[27] H.D. Merchant, Thermal Response of Electrodeposited Copper, J. Electron. Mater., 24 (1995) 919-925.
[28] H.D. Merchant, Annealing Kinetics and Embrittlement of Electrodeposited Copper, J. Electron. Mater., 22 (1993) 631-638.
[29] W.B. Hutchinson, Recrystallisation textures in iron resulting from nucleation at grain boundaries, Acta Metall., 37 (1989) 1047-1056.
[30] K. Hansen, K. Pantleon, Microstructure stability of silver electrodeposits at room temperature, Scr. Mater., 58 (2008) 96-98.
[31] B. Qi, D. Kim, D. Williamson, J. Trefny, Effects of Postdeposition Heat Treatment on Morphology and Microstructure of CdTe Grown by Electrodeposition, J. Electrochem. Soc., 143 (1996) 517.
[32] J. Enriquez, X. Mathew, The effect of annealing on the structure of CdTe films electro-deposited on metallic substrates, J. Cryst. Growth, 259 (2003) 215-222.
[33] J. Enriquez, X. Mathew, Anneal induced recrystallization of CdTe films electrodeposited on stainless steel foil: The effect of CdCl 2, J. Mater. Sci.: Mater. Electron., 16 (2005) 617-621.
[34] M. Hill, J. Bingert, R. Lillard, The relationship between crystallographic orientation and the passivity and breakdown of beryllium, http://public.lanl.gov/MCEL/PDF-Publications/Be-OIM.pdf.
[35] A. Schreiber, C. Rosenkranz, M. Lohrengel, Grain-dependent anodic dissolution of iron, Electrochim. Acta, 52 (2007) 7738-7745.
List of Figures
Figure 1. Surface morphology of electroformed iron deposited at (a) 1, (b) 2, (c) 5 and (d) 10 Adm-2 Figure 2. Color key code inverse pole figure used for OIM imaging.
Figure 3. Normal direction maps as shown with color key code inverse pole figure and grain size distribution of iron electrodeposited at : (a) 1, (b) 2, (c) 5 and (d) 10 Adm-2. Column 1 displays the surfaces while column 3 shows the cross-sections of the electrodeposited samples.
Figure 4. EBSD orientation images and grain size distribution of iron electrodeposited at (a) 1, (b) 2, (c) 5 and (d) 10 Adm-2 annealed at 550˚C for 1 h. Column 1 displays the surfaces while column 3 shows the cross-sections of the annealed samples.
Figure 5. Potentiodynamic polarization curves of iron electrodeposited at different current densities. Figure 6. Corrosion rates of iron electrodeposited at different current densities: the rates were calculated from corrosion current density values presented in Table 3.
Figure 7. Potentiodynamic polarization curves of iron electrodeposited at different current densities and annealed at 550˚C for 1 h.
Figure 8. Corrosion rates of iron electrodeposited at different current densities: the rates were calculated from corrosion current density values presented in Table 4.
Figure 9. Degradation rate of as-deposited iron calculated from static degradation test based on spe i e ’s weight loss duri g the test.
Figure 10. Surface morphology of iron deposited at different current densities after static degradation (after the corrosion products were removed). (a) 1, (b) 2, (c) 5 and (d) 10 Adm-2, Small images on top-left show the same surface at higher magnification.
Figure 11. Degradation rate of electroformed iron annealed at 550˚C calculated from static degradation test ased o spe i e ’s weight loss duri g the test.
Figure 12. Surface morphology of iron deposited at different current densities and annealed at 550 ˚C after static degradation (after the corrosion products were removed). (a) 1, (b) 2, (c) 5 and (d) 10 Adm-2, Small images on top-left show the same surface at higher magnification.
Figure(s)
Figure(s)
Figure(s)
Figure(s)
Figure(s)
Figure(s)
Figure(s)
Figure(s)
Figure(s)
Figure(s)
Figure(s)
Figure(s)
Tables
Table 1. Average grain size and preferential orientation information of electrodeposited iron as determined from Figure 3.
Current density 1 Adm-2 2 Adm-2 5 Adm-2 10 Adm-2
Average grain size (µm) 2.5 4.4 2.5 3
Preferential orientation <1 0 1>//ND <1 1 1>//ND <1 1 1>//ND <1 1 2>//ND
Maximum texture intensity (MUD) 2.28 7.39 1.69 1.37
Table 2. Average grain size and preferential orientation information of electrodeposited iron annealed at 550˚C for 1 h. Data were extracted from Figure 4.
Current density 1 Adm-2 2 Adm-2 5 Adm-2 10 Adm-2
Average grain size (µm) 3.7 7.6 6.1 1.9
Preferential orientation <1 0 1>//ND <1 1 1>//ND <1 1 1>//ND <1 1 2>//ND
Maximum texture intensity (MUD) 2.8 3.54 1.64 2.31
Table 3. Corrosion current density and potential of iron electrodeposited at different current densities: the data were extracted from curves in Figure 5.
Electroforming current density (A dm-1) 1 2 5 10
Corrosion current density (µA cm-2) i corr (µA cm
-2
) 120 81 161 107
SD* (µA cm-2) 13 7 20 24
Corrosion potential (mV vs. Ref.) E corr (mV) 859 750 853 810
SD (mV) 9 30 17 16
*standard deviation
Table 4. Corrosion current density and potential of iron electrodeposited at different current densities and annealed at 550˚C for 1 h: the data were extracted from curves in Figure 7.
Electroforming current density (A dm-1) 1 2 5 10
Corrosion current density (µA cm-2) i corr (µA cm-2) 83 40 105 63
SD (µA cm-2) 13 8 16 5
Corrosion potential (mV vs. Ref.) E corr (mV) 642 693 747 602
SD (mV) 13 30 45 18