Publisher’s version / Version de l'éditeur:
Proceedings of the Thirty-third Annual Review of Progress in Quantitative
Nondestructive Evaluation, 2006., 2006-08-04
READ THESE TERMS AND CONDITIONS CAREFULLY BEFORE USING THIS WEBSITE.
https://nrc-publications.canada.ca/eng/copyright
Vous avez des questions? Nous pouvons vous aider. Pour communiquer directement avec un auteur, consultez la
première page de la revue dans laquelle son article a été publié afin de trouver ses coordonnées. Si vous n’arrivez pas à les repérer, communiquez avec nous à PublicationsArchive-ArchivesPublications@nrc-cnrc.gc.ca.
Questions? Contact the NRC Publications Archive team at
PublicationsArchive-ArchivesPublications@nrc-cnrc.gc.ca. If you wish to email the authors directly, please see the first page of the publication for their contact information.
NRC Publications Archive
Archives des publications du CNRC
This publication could be one of several versions: author’s original, accepted manuscript or the publisher’s version. / La version de cette publication peut être l’une des suivantes : la version prépublication de l’auteur, la version acceptée du manuscrit ou la version de l’éditeur.
Access and use of this website and the material on it are subject to the Terms and Conditions set forth at
ULTRASONIC WAVE GENERATION BY LASERS ON DIFFERENT METAL
SURFACES
Krüger, S. E.; Lord, M.
https://publications-cnrc.canada.ca/fra/droits
L’accès à ce site Web et l’utilisation de son contenu sont assujettis aux conditions présentées dans le site LISEZ CES CONDITIONS ATTENTIVEMENT AVANT D’UTILISER CE SITE WEB.
NRC Publications Record / Notice d'Archives des publications de CNRC:
https://nrc-publications.canada.ca/eng/view/object/?id=8e40b418-b777-4ccb-859f-e26daefcf4f5
https://publications-cnrc.canada.ca/fra/voir/objet/?id=8e40b418-b777-4ccb-859f-e26daefcf4f5
ULTRASONIC WAVE GENERATION BY LASERS ON DIFFERENT
METAL SURFACES
S. E. Kruger and M. Lord
Industrial Materials Institute, National Research Council of Canada, Boucherville, Quebec, J4B 6Y4, Canada
ABSTRACT. Ultrasonic wave generation by short pulsed laser is revisited in this paper with new experimental work. The generation laser pulse is fiber delivered and a virtually uniform intensity spot is obtained. Ultrasonic pulse strength versus laser pulse energy is obtained for various aluminum and steel surface conditions. To have a better reproducibility, the sample moves after each measurement in order to have a fresh surface for each laser shot. Results show a strong effect of the surface condition. Special attention is paid to the frequency dependence of the generated ultrasonic waves for different laser intensities. The problem of the optimum spot size for a given laser pulse energy is also discussed.
Keywords: Laser-ultrasonics, Laser Ablation PACS: 81.70.Cv, 42.87.-d
INTRODUCTION
The laser-ultrasonic technique has been widely used for inspection of metallic materials, both in laboratory [1-2] and on-line in industry [3]. The efficiency of lasers to generate ultrasonic waves in the thermoelastic regime on metal surfaces is very low due to the very shallow penetration of light. Consequently, many practical applications on metals operate in the ablation regime. Two key issues on the use of the ablation regime are the generation efficiency and surface damage. Ablation damage can be critical for some applications but fully acceptable for others and in this paper the later case is assumed. The generation efficiency is a complex issue that depends strongly on the laser wavelength, pulse duration and surface condition, among others. Quantitative studies on ultrasonic generation by lasers have shown a rapid amplitude increase of the generated ultrasonic displacement when the laser intensity reaches the ablation regime [4-8]. It is also observed in some studies, a saturation and even a decrease of the ultrasonic displacement for very high laser intensities [4-7]. Although, many papers have proposed models for the generation in the thermoelastic regime, theoretical studies on the ablation regime are less numerous, probably due the complex physics related to the plasma formation and expansion. Discrepancies found between theoretical and experimental results are larger for the ablation regime than for the thermoelastic regime.
In this paper, new experimental work on ultrasonic generation by lasers is presented. The aim of this experimental work was to determine quantitatively the optimal conditions for fiber-delivered laser generation in production line. Ultrasonic pulse strength versus laser pulse energy is presented for various aluminum and steel surface conditions. Special attention is paid to the frequency dependence of the generated ultrasonic waves for different laser intensities and the problem of the optimum spot size for a given laser pulse energy.
EXPERIMENTAL SETUP
Tests are performed on samples under five different surface conditions. Samples of steel about 11 mm thick are considered with as machined, grinded (# 320) and painted (sprayed dark blue) surface conditions. A steel sample 8 mm thick was heated to about 1000 °C in air to create a thin oxide layer on the surface. Also, a 12 mm thick sample of aluminum was mirror polished.
In order to have a uniform laser spot at the sample surface, a fiber delivered configuration was implemented. Figure 1 shows the experimental setup. A Q-switched Nd:YAG, 1064 nm, laser of pulse duration of 10 ns is used for the generation. An optical attenuator is introduced between the generation laser and the fiber injection, to allow the delivery of different laser intensities with the same pulse profile. The fiber is about 20 m long with a core diameter of 1 mm and a nominal numerical aperture of 0.16. The optical setup to image the fiber end in the sample consists of a simple two plano-convex lenses configuration. This configuration produces uniform generation spots as illustrated in Figure 2 by the ablated area on the sample surface. The generation laser spot diameter is of about 640 urn.
photodetector
FIGURE 1. Optical configuration of the experimental setup.
FIGURE 2. Ablation mark on a machined steel surface.
The sample moves during measurements as to provide a fresh surface for each laser shot and the reported results are averages of 20 measurements. The detection is done by a long pulse Nd:YAG laser on the opposite side of the sample. A confocal Fabry-Perot interferometer in the reflection configuration is used to demodulate the signals.
RESULTS
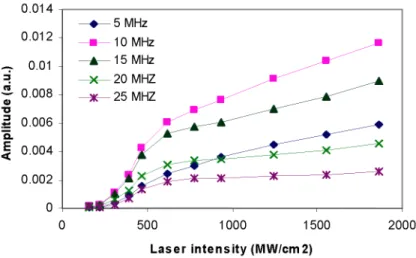
Figure 3 shows the detected ultrasonic pulses for various laser pulse energies in a machined steel sample. A rapid increase of the ultrasonic amplitude is observed, starting with a virtually not detectable signal for a 7 mJ laser pulse to a sizeable signal for a 10 mJ laser pulse. Figure 4 shows the peak-to-peak ultrasonic pulse amplitude dependence on laser intensity for two steel surfaces conditions. Although some differences in the low intensity regime are present, the responses to laser generation with machined and grinded surface conditions are very similar. There is a rapid increase of the detected ultrasonic amplitude for laser intensities above 200 MW/cm . Above about 600 MW/cm , this increase becomes less abrupt, but no saturation or decrease is observed up to the maximum tested intensity of about 1900 MW/cm . Figure 5 shows the evolution of generated ultrasonic frequency components for the case of the machined surface. It is noticeable that for low frequencies, there is a significant increase of the generated ultrasonic amplitude even for high laser intensities, while for high frequencies, the generated ultrasonic component tends to saturate above about 600 MW/cm . Notice that the detection system used, based on a confocal Fabry-Perot interferometer in the reflection configuration and coupled to the system electronics has a frequency dependent sensitivity, with a lower sensitivity for frequencies below 10 MHz. Therefore, the amplitude levels in Figure 5 rather reflect the particular detection system used. The relative evolution of the amplitude
Time (us)
FIGURE 3. Detected ultrasonic pulses for different generation energies for a 0.64 mm laser spot diameter. Pulses were delayed in time for sake of clarity.
| 7 6 -Steel machined •Steel grinded 500 1000 1500 Laser intensity (MW/cm2) 2000
FIGURE 4. Detected ultrasonic pulse peak-to-peak amplitude versus generation laser intensity for two steel surface conditions.
0.014 0.012 -r 0.01 \ 3 •2- 0.008 1 a •a | 0.006 1 a. | 0.004 1 5 MHz -10 MHz -15 MHz 20 MHZ 25 MHZ 500 1000 1500 Laser i n t e n s i t y (MW/cm2) 2000
FIGURE 5. Detected ultrasonic amplitude for different frequencies versus generation laser intensity, for a machined steel surface.
Figure 6 shows the effect of a thin coating on the evolution of the amplitude versus laser intensity. The painted surface shows much stronger generation efficiency over all intensities while the oxided surface shows a markedly high efficiency for low laser intensities. Compared to a machined surface, the onset of the high efficiency regime occurs at laser intensities about one order of magnitude lower than for coated surfaces.
500 1000 1500 Laser intensity (MW/cm2)
2000
FIGURE 6. Detected ultrasonic peak-to-peak amplitude versus generation laser intensity for different steel surface conditions.
25
0 500 1000 1500 2000 Laser intensity (MW/cm2)
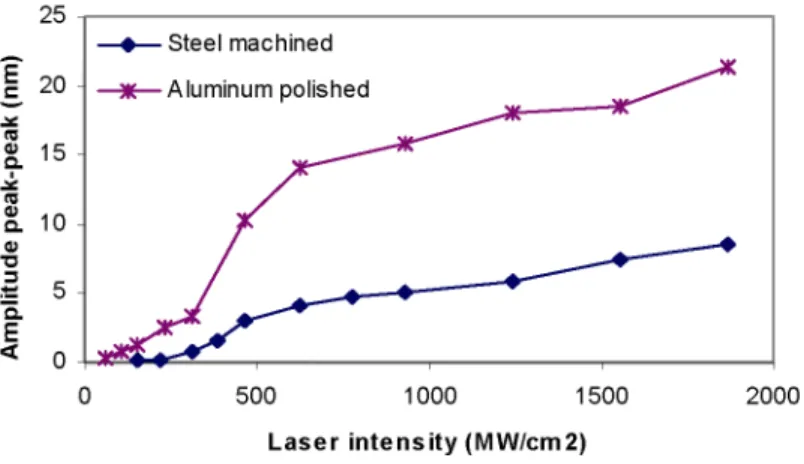
FIGURE 7. Detected ultrasonic peak-to-peak amplitude versus generation laser intensity for steel and aluminium samples.
Figure 7 shows the generation efficiency for aluminum and steel samples. The laser generation on aluminum is shown to be always more efficient in aluminum than in steel, but has a similar behavior as a function of laser intensity.
DISCUSSION
The main differences between the results presented in this paper and previous works from the literature are attributed to the use of a uniform intensity spot, a constant spot size and a fresh surface for each laser shot. Since direct laser beams do not have a uniform distribution of intensity and hot spots are a commonplace, it is difficult to obtain an accurate measure of generation efficiency with such a configuration. For example, the ablation threshold can be attained for low pulse energies in the hot spots, while other regions of the generation laser spot will only reach the threshold at much higher energies. The use of a fibered configuration, on the other side, can provide uniform spots and allows the determination of a generation efficiency curve that does not depend on the laser beam quality. Also, the constant spot size assures that the acoustic diffraction will be the same for all laser intensities.
Many previous studies have chosen to change the spot size to vary the laser intensity, but did not take into account the effect of the spot size on the generated acoustic field. For example, in the far field approximation, the detected acoustic amplitude is proportional to the area of a uniform generation spot. For the same energy of the laser pulse, a small spot size gives high laser intensity and consequently high generation efficiency, but the generated acoustic field has high divergence, resulting in a weak detected signal. In the other side, large spots provide low generation efficiency but the acoustic beam has low divergence. The effect of the spot size is probably one of the reasons why many previous studies have found a decrease of the generated ultrasonic amplitude for high laser intensities by reducing the spot size. This decrease has been often interpreted as the result of a shielding of the laser light by the formed plasma. Present work has not found significant decrease on the ultrasonic amplitude for high laser intensity but sometimes saturation, especially for high frequencies. The curves of laser generation efficiency
obtained by changing the spot sizes without further corrections for the acoustic field are not quantitatively correct. However, they are very easy to produce and have a very practical importance. These curves are a simple way to determine the spot size that for a given laser will provide maximum ultrasonic amplitude. But the curves obtained with a constant spot size, like those presented in this paper, can also be used to obtain the optimum spot size by introducing the acoustic diffraction correction. With the far field approximation, efficiency curves like those in Figure 4 can be used to plot the ultrasonic displacement for a given pulse energy as a function of the spot size, as shown in Figure 8. The optimum spot size could then be easily determined. This approach is preferred because the generation efficiency curves obtained for different surface conditions are more universal and can be used to evaluate various experimental configurations.
The surface condition after a high energy laser shot usually changes and subsequent shots in the same location could have a different response. For this reason, the present results are obtained while moving the sample in order to avoid superposition of consecutive shots. Consequently, these generation efficiency curves are especially useful for applications where test object is moving.
Results obtained show the major influence of the surface condition. While the surface roughness does not seem to be important (grinded or machined), an oxided or a painted surface will have a major impact. Also in aluminum, the generation efficiency is noticeably higher than in steel. The effect of the laser intensity in the frequency content of the generated ultrasonic pulse is also demonstrated. The physical origin of this effect is not clear but could be related to the shielding of the laser light by the plasma produced. After the formation of the plasma, much of the laser energy would be absorbed by the plasma. This additional heating would contribute to a supplementary ultrasonic generation during the expansion of the plasma, but this mechanism could favor only low ultrasonic frequencies. =3 20 10
1
1
1
o
o
o
o
1
1
O i o
— — 1.5 2 2.5 Spot size (mm)CONCLUSION
The experimental results presented in this paper for laser generation efficiency of ultrasound using a uniform intensity spot offer a significant contribution to the understanding of the problem as well as quantitative information for the design of a fiber delivered laser-ultrasonic system. It is shown that the optimization of the spot size should take into account of generation efficiency and acoustic factors. Also, material surface conditions are shown to be a key factor for generation efficiency. The frequency content of generated ultrasonic signals is shown to depend on the generation laser intensity.
REFERENCES
1. S. E. Kruger, A. Moreau, C. Bescond and J.-P. Monchalin 'Real-time sensing of metallurgical transformations by laser-ultrasound' In Proceedings of the 16 World
Conference on Nondestructive Testing, Montreal (2004).
2. E. Lindh-Ulmgren, D. Artymowicz and B. Hutchinson, In Proceedings of the First Joint
International Conference on Recrystallization and GrainGrowth, eds: G. Gottstein and
D. Molodov, Springer, (2001), pp. 577-582.
3. S. E. Kruger, G. Lamouche, J.-P. Monchalin, Robert Kolarik II, G. Jeskey and Marc Choquet, Iron and Steel Technology, 2 (10), pp. 25-31 (2005).
4. R. J. Dewhurst, D. A. Hutchings, S. B. Palmer and C. B. Scruby, J. Appl. Phys. 53, pp. 4064-4071 (1982).
5. T. W. Murray and J. Wagner, J. of Appl. Phys., 85, pp. 2031-2040 (1999). 6. A Hoffmann and W. Arnold, Appl. Surf. Sci. 96-98, pp. 71-75 (1996).
7. A Hoffmann and W. Arnold 'Modeling of the ablation source in laser-ultrasonics' In
Review of Progress in Quantitative NDE, Vol. 19, eds. D. O. Thompson and D. E.
Chimenti, AIP: New York, (2000), pp.279-286.
8. J. D. Aussel, A. Le Brun and J. C. Baboux, Ultrasonics 26, pp. 245-255 (1988).