Publisher’s version / Version de l'éditeur:
The Journal of Physical Chemistry B, 119, 5, pp. 1947-1956, 2015-02-05
READ THESE TERMS AND CONDITIONS CAREFULLY BEFORE USING THIS WEBSITE.
https://nrc-publications.canada.ca/eng/copyright
Vous avez des questions? Nous pouvons vous aider. Pour communiquer directement avec un auteur, consultez la
première page de la revue dans laquelle son article a été publié afin de trouver ses coordonnées. Si vous n’arrivez pas à les repérer, communiquez avec nous à PublicationsArchive-ArchivesPublications@nrc-cnrc.gc.ca.
Questions? Contact the NRC Publications Archive team at
PublicationsArchive-ArchivesPublications@nrc-cnrc.gc.ca. If you wish to email the authors directly, please see the first page of the publication for their contact information.
NRC Publications Archive
Archives des publications du CNRC
This publication could be one of several versions: author’s original, accepted manuscript or the publisher’s version. / La version de cette publication peut être l’une des suivantes : la version prépublication de l’auteur, la version acceptée du manuscrit ou la version de l’éditeur.
For the publisher’s version, please access the DOI link below./ Pour consulter la version de l’éditeur, utilisez le lien DOI ci-dessous.
https://doi.org/10.1021/jp511159q
Access and use of this website and the material on it are subject to the Terms and Conditions set forth at
Molecular structures of fluid phosphatidylethanolamine bilayers
obtained from simulation-to-experiment comparisons and experimental
scattering density profiles
Kučerka, Norbert; Van oosten, Brad; Pan, Jianjun; Heberle, Frederick A.;
Harroun, Thad A.; Katsaras, John
https://publications-cnrc.canada.ca/fra/droits
L’accès à ce site Web et l’utilisation de son contenu sont assujettis aux conditions présentées dans le site LISEZ CES CONDITIONS ATTENTIVEMENT AVANT D’UTILISER CE SITE WEB.
NRC Publications Record / Notice d'Archives des publications de CNRC:
https://nrc-publications.canada.ca/eng/view/object/?id=9f16af25-9d91-47f7-b19b-387fe4c4022b https://publications-cnrc.canada.ca/fra/voir/objet/?id=9f16af25-9d91-47f7-b19b-387fe4c4022bMolecular Structures of Fluid Phosphatidylethanolamine Bilayers
Obtained from Simulation-to-Experiment Comparisons and
Experimental Scattering Density Profiles
Norbert Kučerka,*
,†,‡,§Brad van Oosten,
∥Jianjun Pan,
⊥,#Frederick A. Heberle,
#Thad A. Harroun,
∥and John Katsaras*
,#,¶,▽†
Canadian Neutron Beam Centre, National Research Council, Chalk River, Ontario K0J 1J0, Canada
‡
Department of Physical Chemistry of Drugs, Faculty of Pharmacy, Comenius University, 832 32 Bratislava, Slovakia
§
Frank Laboratory of Neutron Physics, Joint Institute for Nuclear Research, 141980 Dubna, Moscow region, Russia
∥
Department of Physics, Brock University, St. Catharines, Ontario L2S 3A1, Canada
⊥
Department of Physics, University of South Florida, Tampa, Florida 33620, United States
#
Biology & Soft Matter Division, Oak Ridge National Laboratory, Oak Ridge, Tennessee 37831, United States
¶
Department of Physics and Astronomy, University of Tennessee, Knoxville, Tennessee 37996-1200, United States
▽
Joint Institute for Neutron Sciences, Oak Ridge National Laboratory, Oak Ridge, Tennessee 37831-6453, United States
*
S Supporting InformationABSTRACT: Following our previous efforts in determining the structures of commonly used PC, PG, and PS bilayers, we continue our studies of fully hydrated, fluid phase PE bilayers. The newly designed parsing scheme for PE bilayers was based on extensive MD simulations, and is utilized in the SDP analysis of both X-ray and neutron (contrast varied) scattering measurements. Obtained experimental scattering form factors are directly compared to our simulation results, and can serve as a benchmark for future developed force fields. Among the evaluated structural parameters, namely, area per lipid A, overall bilayer thickness DB, and hydrocarbon region thickness 2DC, the PE bilayer response to changing temperature is similar to previously studied bilayers with different headgroups. On the other hand, the reduced hydration of PE headgroups, as well as the strong hydrogen bonding between PE headgroups, dramatically affects lateral packing within the bilayer. Despite sharing the same glycerol backbone, a markedly smaller area per lipid distinguishes PE from other bilayers (i.e., PC, PG, and PS) studied to date. Overall, our
data are consistent with the notion that lipid headgroups govern bilayer packing, while hydrocarbon chains dominate the bilayer’s response to temperature changes.
■
INTRODUCTIONMembranes that surround cells and separate their contents from the external environment are ubiquitous in nature. Biological membranes consist mainly of lipids and proteins, where it is widely accepted that the membrane’s underlying structure is imparted by the lipid bilayer. As such, tremendous effort has been expended over the years in studying lipid bilayer structure and dynamics in hopes of understanding the functional mechanisms taking place at membrane interfaces.1 However, due to the compositional complexity of biological membranes, the physical properties and functional roles of individual lipid species have proven exceedingly difficult to determine. In order to gain insight into the roles of individual lipid components, it is necessary to study model membrane systems that contain the species of interest. For example, in eukaryotic cells the predominant lipid species are glycerol-based phospholipids such as phosphatidylcholine (PC),
phosphatidylethanolamine (PE), phosphatidylserine (PS), phosphatidylinositol, and cardiolipin.2
In general, the different organelle membranes have different lipid compositions, and consequently different structural and functional characteristics. As structure is thought to be coupled to function, the myriad specific functions occurring in these membranes are reflected in the lipidome's size and diversity.3 For example, the thermodynamic phase of multicomponent lipid mixtures plays a lead role in determining the membrane’s physicochemical properties. In the case of phospholipids, the bilayer’s phase is primarily determined by the chemical properties of their hydrocarbon chains and polar headgroups, including their capacity to associate with water. In PE bilayerswhich inherently interact with fewer water mole-culesthe main gel-to-liquid disordered phase transition Received: November 7, 2014
Published: December 1, 2014
Article
pubs.acs.org/JPCB
temperature increases by as much as 30 °C, compared to PC bilayers with the same chain composition.4Another important
parameter is the molecular geometry of the different lipids making up the membrane. For example, due to the relatively small size of the PE headgroupcompared to the cross section of its hydrocarbon chainsits presence in membranes imposes a curvature which may be necessary for accommodating certain proteins, and which may in turn modulate their function.5 Therefore, in order to better understand the complex assembly we call the membrane, there is a clear need for careful and precise characterization of its individual components.
As mentioned, a cell’s function is closely associated with the structure of its membranes. For most biological membranes, the underlying structure is a liquid disordered lamellar phase, in which individual lipids exhibit liquid-like conformational degrees of freedom. As a result, the transverse bilayer structure is best described by broad statistical distributions, rather than sharp delta functions typically used for the structural determination of data from 3D crystals. Due to this inherent disorderwhich is thought to be crucial for proper biological functionaveraged structural information is not easily obtained.6 Fortunately, a renewed interest in the study of lipid−water systems has led to recent advances in neutron and X-ray scattering techniques, which are extensively used to elucidate the structure of biologically relevant membranes.7 Access to such structural information is necessary in order to better understand the relationship between biomembrane structure and function. A recent example has been the unraveling of the so-called Gordian knot of type 2 diabetes mellitus, where the occurrences of gestational diabetes mellitus were correlated with a markedly lower PC and PE unsaturation index.8
PCs are the major lipid group in mammalian membranes, while PEs account for nearly 25% of total phospholipids (up to 45% of the brain’s total lipid content), and are the major constituent of bacterial membranes.9 PE was first isolated by Ludwig Thudichum in 1884, at which time the discovery’s impact was considered to be hardly commensurate with the expended time and cost“not unlike today’s sentiments applied to basic research” as noted by Vance and Tasseva.9 However, in recent years, this aminophospholipid has been identified in playing key roles in many biochemical and physiological processes taking place in mammalian cells.10For example, changes to the PC/PE ratio appear to be associated with liver disease11and heart myocytes.12Similarly, a decrease in mitochondrial PE impairs cell growth, respiratory capacity, and ATP production and profoundly alters mitochondrial morphology13 and function, which are implicated in neuro-degenerative disorders,14 cardiovascular disease/metabolic
syndrome,15 diabetes,16 and tumor development.17 While PE’s biological importance has been documented in numerous studies, its precise mechanistic role is still poorly understood.18 We recently developed a hybrid experimental/computational technique (reviewed by Heberle et al.19) for determining the bilayer’s scattering density profile (SDP), which addressed some of the difficulties associated with obtaining the area per lipid, and other structural information, from disordered membranes.20 The technique exploits the fact that neutron
and X-ray scattering are sensitive to different parts of the lipid bilayer. While X-ray scattering is sensitive to the position of the phospholipid headgroup, due to the large X-ray scattering length density (XSLD) contrast between the electron-rich phosphate and the hydrocarbon/aqueous medium, the large
difference in the neutron scattering length density (NSLD) between the protiated lipid and the deuterated water accurately defines the position of the bilayer/water interface. The complementarity of these structural techniques, when com-bined with independently obtained lipid volumes, results in a model that accurately describes the detailed lipid bilayer structure, and yields the all-important area per lipid. The initial step in SDP analysis involves the parsing of the lipid molecule into components whose volume probability distributions follow simple analytical functional forms. This is best accomplished by utilizing results from molecular dynamics (MD) simulations. It is imperative, however, to first verify such simulations with experimental results. Area per lipid is often used as the key parameter when assessing the validity of MD simulations. On the other hand, this parameter results from data analysis based on modeling and other simplifications, and is therefore not without problems. More appropriately, it is a direct comparison of simulations with raw experimental datarepresented by scattering form factorswhich can be accomplished using the SIMtoEXP software,21as shown in recent publications.22−31
Following our previous efforts to determine the structures of PC,32ether lipid,33PG,34,35and PS36bilayers, we continue our
studies of fully hydrated, fluid phase PE bilayers. MD simulations were performed using the updated CHARMM36 and the recently developed SLIPIDS (Stockholm lipids) force-fields, both of which have shown promising agreements between simulation and experiment for a number of lipid systems.25,31 A newly developed parsing scheme was used for
SDP analysis of PE bilayers. From this model, we present the probability distribution profiles along the bilayer normal (bilayer thickness), and in the lateral direction (area per lipid). Finally, obtained experimental scattering form factors are made available for comparison with simulations, so that they can serve as a benchmark for future force-field developments.
■
MATERIALS AND METHODSSynthetic PEs with saturated acyl chains, 1,2-dilauroyl-sn-glycero-3-phosphatidylethanolamine (diC12:0PE, DLPE), and those with mixed acyl chains, palmitoyl-2-oleoyl-sn-glycero-3-phosphatidylethanolamine (C16:0−18:1PE, POPE) and 1-stearoyl-2-oleoyl-sn-glycero-3-phosphatidylethanolamine (C18:0−18:1PE, SOPE), were purchased from Avanti Polar Lipids (Alabaster, AL) and used as received. The main phase transition temperatures for multilamellar vesicle suspensions were obtained from differential scanning calorimetry, and are as follows: TM(DLPE) = 30.9 °C, TM(POPE) = 25.2 °C, and TM(SOPE) = 30.9 °C, and agree with published values4within 1 °C.
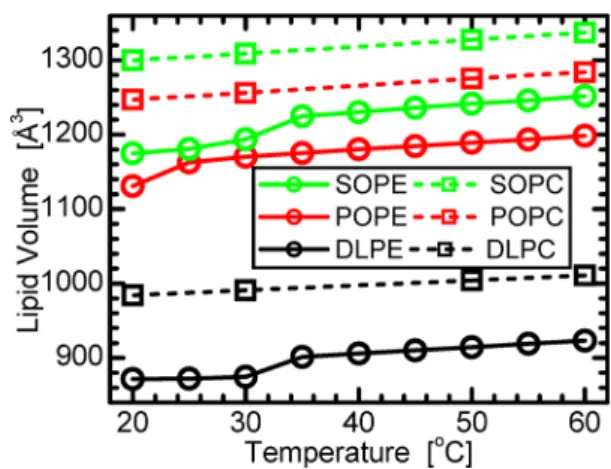
Lipid dispersions for density measurements were obtained by hydrating ∼20 mg of lipid powder with ∼1.5 mL of 18 MΩ cm H2O (Milipore), followed by temperature cycling (five times) between −80 and 60 °C, accompanied by vigorous vortexing. Lipid dispersions were then loaded into an Anton-Paar DMA5000 (Graz, Austria) vibrating tube density meter, and average PE lipid volumes (Figure 1) were derived from the measured densities as described previously.34
Samples for small-angle scattering experiments were prepared by mixing lyophilized lipid powder with D2O or 18 MΩ cm H2O (Millipore) at concentrations not exceeding 40− 50 mg/mL, followed by temperature cycling through the lipid’s main phase transition until a uniform lipid dispersion was obtained. Unilamellar vesicles (ULVs) were prepared from lipid dispersions at a temperature above each lipid’s main phase
transition using an Avanti mini-extruder fitted with two 0.25 mL airtight syringes. Lipid dispersions were extruded through a 500 Å pore diameter polycarbonate filter (∼33 total passes), resulting in ∼600 Å diameter ULVs.37 Finally, samples were diluted with D2O, or H2O, to the desired external contrast condition (i.e., 100%, 75%, and 50% D2O in the case of neutron contrast variation experiments, and 100% H2O in the case of X-ray scattering experiments). The total lipid concentration of the final ULV samples was ∼20 mg/mL, which guarantees sufficient water between ULVs to eliminate the possibility of interparticle interactions.37
Small-Angle Neutron Scattering.Neutron scattering data were taken at the CG-3 Bio-SANS instrument located at Oak Ridge National Laboratory (ORNL).38 Neutrons of 6 Å wavelength (∼12% fwhm) were selected using a mechanical velocity selector, and a sample-to-detector distance of 1.4 m was used to cover a scattering vector [q = 4π/λ sin(θ), where λ is the wavelength and 2θ is the scattering angle] range of 0.03 to 0.3 Å−1. Data were collected using a 1 × 1 m2 two-dimensional3He position-sensitive detector with a 5 × 5 mm2 resolution. Samples were loaded into standard 2 mm path length quartz cells and placed in a temperature controlled sample rack for measurements. Finally, neutron form factors used in data analysis were calculated from corrected experimental intensities following the well-established proce-dure, where |F(q)| = I(q)/|I(q)| q sqrt(|I(q)|).39
Small-Angle X-ray Scattering.X-ray scattering data were collected at the Cornell High Energy Synchrotron Source (CHESS) G-1 station. A tightly collimated (0.21 × 0.21 mm2) beam of 1.17 Å wavelength X-rays was detected using a 1024 × 1024 pixel array FLICAM charge coupled device with 71 μm linear dimension pixels. The sample-to-detector distance was 426.7 mm, as determined using a powder sample of silver behenate procured from The Gem Dugout (State College, PA).40Samples were loaded in 1.5 mm quartz capillaries and
placed in a temperature controlled sample rack for measure-ments. The X-ray scattering form factors were calculated from corrected experimental intensities using the same relationship as for neutrons (shown above). An additional fourth order polynomial was used to correct for an unaccountable rise in background scattering with increasing q.
Molecular Dynamics Simulations. Simulations were performed using the GROMACS software (version 4.6.1)41
with the CHARMM3642 and SLIPIDS25 force fields. The recently updated GROMACS version 5.0.243was also used to
evaluate the effect of running simulations under NPT conditions with force-based cut-offs, as opposed to potential energy cut-offs, an option that became available only recently in this version of the software. Initial coordinates for a bilayer containing 128 POPE molecules (8 × 8 × 2 configuration) with 30 TIP 3p (tips3p.itp) waters per lipid were obtained through the CHARMM GUI membrane builder.44 The simulations were performed in an orthorhombic box with periodic boundary conditions. The CHARMM POPE topology was created using the GROMACS software package pdb2gmx and the CHARMM36 force field,42,45 while the SLIPIDS POPE topology file was obtained from the Stockholm lipids (SLIPIDS) download page.46Each system was first equilibrated with a 100 ps NVT ensemble followed by a 1 ns NPT ensemble. The final equilibrated systems were then used as the starting point for subsequent free-area and constant area per lipid simulations over the time of 50 ns.
Simulation run parameters differed for each force field in order to best simulate the lipids, as outlined in previous publications.26,47 Briefly, CHARMM36 simulations used a
Nose-Hoover thermostat with a 0.5 ps coupling constant, keeping the system’s temperature at a constant 308 K. The POPE bilayer and water were coupled separately. In the constant area simulations, the area was fixed using the Parrinello−Rahman barostat with a coupling constant of 2 ps, while the isothermal compressibility was set to zero in the x−y direction, and 4.5 × 10⁻⁵ bar−1in the z direction at 1 bar of pressure. The constraint-free simulation used an isothermal compressibility of 4.5 × 10⁻⁵bar−1, and 1 bar of pressure in the x−y and z directions, respectively. Finally, a time step of 2 fs was used with a Leapfrog integrator, and long-range electro-static interactions were evaluated using a partial-mesh Ewald scheme with 0.16 nm Fourier spacing and fourth order interpolation. A 1.2 nm cutoff was utilized in GROMACS 4.6.1 for the short-range electrostatic and van der Waals interactions, and the pair list was updated every 10 fs. The updated version 5.0.2 of the software employed the force based switch function for the van der Waals interactions (0.8 to 1.2 nm), while maintaining the 1.2 nm cutoff for short-ranged electrostatics, as well as updating the pair list every 10 fs.
In the case of SLIPIDS simulations, the system temperature was fixed at 308 K using a Nose-Hoover thermostat with a 1 ps coupling constant. The POPE bilayer and water were coupled separately. The area was held constant using the Parrinello− Rahman barostat with a coupling constant of 1 ps, while the isothermal compressibility was set to zero in the x−y direction and 4.5 × 10⁻⁵bar−1in the z direction at a pressure of 1.013 bar. The constraint-free simulation used an isothermal compressibility of 4.5 × 10⁻⁵bar−1and 1.013 bar of pressure in the x−y and z directions, respectively. A time step of 2 fs was used with a Leapfrog integrator, and long-range electrostatic interactions were evaluated using a partial-mesh Ewald scheme with a 0.12 nm Fourier spacing and fourth order interpolation. The Verlet list scheme was used for nonbonded interactions, which were updated every 40 fs to utilize the GPU’s unique architecture for increased speeds. Finally, a 1.4 nm cutoff was used for the short-range electrostatic and van der Waals interactions.
Figure 1. Temperature dependence of PE volumes, compared to equivalent PC32 lipids. In the fluid phase, the volume difference
between PC and PE lipids with the same hydrocarbon chains is about 86 Å3.
The Journal of Physical Chemistry B Article
dx.doi.org/10.1021/jp511159q | J. Phys. Chem. B 2015, 119, 1947−1956
■
RESULTS AND DISCUSSIONMD simulations of a fluid phase POPE bilayer at 35 °C were first performed using the updated CHARMM3642 force field under NPT conditions, i.e., lateral area was unconstrained. However, our simulations yielded an average PE area per lipid of 53.2 Å2and displayed lipid chain order characteristic of a gel phase. At first, this appears to be in contrast to the 59.2 Å2 (although still decreasing after 40 ns) reported by Klauda et al. for T = 310.15 K.42 However, subsequent publications from Klauda and Pastor,28 and posts on simulation community forums,48 suggested a fix to the problem through force-based cut-offs, as was the case in the original simulations performed using the NAMD and CHARMM software. Our results of such simulations equilibrated at an area per lipid of 55.4 Å2, and showed no signs of gelation. This then justifies the use of the recently developed CHARMM36 force field with forced-based cut-offs under NPT conditions, while further analysis suggests that the two cutoff schemes are equally successful in the case of constrained area simulations. For an additional comparison, we also utilized the recently developed SLIPIDS force field.25NPT conditions in our simulations produced the expected fluid phase structure with an area per lipid of about 58.0 Å2. All three NPT simulation results are compared to the experimental scattering form factors in the Supporting Information.
The approach of unconstrained lateral area, or surface tension γ, has previously been found to considerably under-estimate the area per lipid in simulations using the previous versions of the CHARMM force fields,49−51
although less so in the case of the recently updated CHARMM3642and Berger lipids force fields.52,53 Various theoretical explanations for this deficiency have been offered, as well as suggested modifications for improving the agreement with experiment.54−61 Here, we employ a model-free method where the lateral area is fixed at a series of values,62 an approach which overcomes the issue of imperfectly balanced force fields that are needed for simulations of absolute areas at zero surface tension,63and takes advantage of simulation results being fine-tuned by comparing to experiment.39,49,64
SIMtoEXP Analysis. We performed constrained area per lipid MD simulations over a range of values. Each simulation was analyzed separately and its success was evaluated in terms of simulation-to-experiment (SIMtoEXP) comparisons.21
Briefly, real space simulated bilayer structures were converted to reciprocal space scattering form factors via Fourier transform, avoiding assumptions associated with models. Calculated scattering form factors were then plotted on an absolute scale and compared to experimentally obtained form factors. The latter were scaled by a factor kethat minimized χ2, which is defined as the square of residuals between the experimental Fe(q) and simulated Fs(q) form factors, and normalized by the estimated experimental uncertainty ΔFe(q). Reduced χ2were calculated by further normalization using the number of experimental data points Nq as shown below
∑
χ = − | | − | | Δ = ⎛ ⎝ ⎜⎜ ⎞ ⎠ ⎟⎟ N F q k F q F q 1 1 ( ) ( ) ( ) q i N i i i 2 1 s e e e 2 q (1)and plotted as a function of simulation fixed area. Figure 2 shows plots for CHARMM36 (A) and SLIPIDS (B) calculated form factors.
The model-free area per lipid method of evaluation was suggested almost a decade ago for a direct comparison of simulated and X-ray scattering data,62 which allowed experimental scattering data to play a prominent role in the development of new MD force fields. Historically, only X-ray data were used,42,65 but neutron scattering data are now also
used to validate MD simulations.23,26,36,66 As the two experimental techniques are sensitive to different features of the bilayer (electron dense lipid headgroups in the case of X-rays, and overall bilayer thickness, and consequently lipid area, in the case of neutrons), the end result is a more robust validation of the simulation data. On the other hand, evaluated lipid areas utilizing only one data set (i.e., X-ray form factors, or 100% D2O, or 75% D2O, or 50% D2O neutron form factors) vary by as much as 5.8 Å2in the case of CHARMM36, and 4.3 Å2in the case of SLIPIDS simulationsthough this variation is Figure 2. Model-free determination of area per lipid made by comparing simulated and experimental scattering form factors. Open symbols represent reduced χ2calculated for X-ray scattering data of bilayers dispersed in H
2O, and neutron scattering data of bilayers dispersed in 100%, 75%,
and 50% D2O solution, compared to simulated form factors (eq 1). Solid lines are quadratic fits to the data used to determine the model-free area
per lipid based on the CHARMM36 (A) and SLIPIDS (B) force fields, with the most probable value (the χ2minimum) indicated by the dashed
reduced to 3.6 Å2 and 2.1 Å2, respectively, when only 100% D2O neutron data is considered. A similar disparity was recently reported for DOPC simulations with the GROMOS 43A1-S3 force field.23Since the ideal MD force field must be capable of describing all experimental data simultaneously, the unsat-isfactory performance using the primary testing criterion proposed by Nagle29 clearly indicates that there is room for
improvement of all three force fields discussed (i.e., CHARMM36, SLIPIDS, and GROMOS 43A1-S3). It should be mentioned that recent POPS simulations using CHARMM36 resulted in only a 1 Å2difference between the areas per lipid obtained by evaluating standalone X-ray and neutron data.36
Analyses using standalone data sets provide an estimate of the systematic error inherent to simulations. On the other hand, simultaneous evaluation of all available data results in the most probable model-free area per lipid. Despite significant differences in the original NPT simulations (see above), the fact that the results of the two cutoff schemes employed in CHARMM36 fit on the same curve together with further NPAT results (Figure 2A), emphasizes the notion of the model-free method being able to overcome imperfectly balanced force fields. In addition, lipid areas calculated based on the model-free approach are encouragingly similar for both the CHARMM36 (58.1 Å2) and SLIPIDS (57.4 Å2) force fields. We have discussed disagreements between simulation and experimental results that have been found through direct comparison of the two.21As was mentioned, such a comparison is superior to other verification approaches, because it makes use of unrefined raw data.62However, this method can provide
only a limited understanding about the sources of deficiencies. In order to understand these sources, information must be further deconstructed. For example, various properties of simulated bilayers are often reduced to an area per lipid that can be compared to the experimentally obtained value. On the other hand, most of the experimental techniquesincluding X-ray and neutron scattering used hereextract this parameter via various model approaches only. This then introduces assumptions, which are themselves a potential source for errors.24,31
Having said this, it is still more practical to perform comparisons in real space, where the total bilayer profile can be decomposed in a consistent manner. Utilizing models then offers the advantage of combining information from different experiments, including simulations.62It is worth noting that the large discrepancies observed previously when standalone X-ray and neutron scattering data were evaluated separately20could be attributed to the fact that X-ray scattering is sensitive to the position of the phospholipid headgroup, while neutron scattering data accurately reflect the location of the bilayer/ water interface. These two results then lead to disparate structural parameters when used in conjunction with less than perfect models of the bilayer. In order to improve the robustness of membrane structural parameters, we proposed to combine the simultaneous analysis of X-ray and neutron scattering data, the use of independently obtained volumetric data, and a bilayer parsing scheme, determined, in part, through simulation.20
SDP Model for PEs. Data analysis is carried out using a single structural model which underlies all of the various scattering density profiles, or the so-called SDP model. The original model developed for PC20 lipids has been extended recently for PG,67PS,36and ether33 lipids. We continue this
development by extending the SDP model to PE bilayers. First, MD simulations were evaluated to find a “characteristic” parsing scheme that minimizes differences (to within a scale factor) between X-ray and contrast varied neutron scattering length density distributions (described in detail below). Since the PE hydrocarbon chain region shares the same functional forms as those used to evaluate other bilayers, we focus our discussion on the headgroup region.
While the small PE headgroup suggests the possibility of a parsing scheme different from that used in previous studies, this turns out not to be the case. Similar to glycerophospholipids, we describe the PE carbonyl and glycerol moieties with a single Gaussian (CG). This comes about because the carbonyl groups give rise to similar distributions for both X-ray and neutron SDPs, while the glycerol moiety has only a small contribution to the X-ray SDP and practically no contribution to the neutron SDP. As a result, the SDPs for the combined CG component are shifted by only ∼0.5 Å (Figure 3), and do not require the
use of additional parameters. What must be carefully considered, however, is the headgroup’s primary amine, which is generally protonated at biologically relevant pH. It has recently been pointed out that the amine hydrogens of the PS headgroup exchange rapidly with deuterium when exposed to D2O.36Failing to account for this H/D exchange impacts the neutron SDP (Figure 3), yielding a larger apparent bilayer thickness, and a larger area per lipid; an overestimation of area per lipid was reported recently for PG bilayers,34 and
subsequently rectified by taking into account the exchangeable hydrogens.35 Therefore, the ethanolamine moiety is best
represented by a separate Gaussian (ENX − with emphasis on exchangeable protons) that depends on percent D2O. In the case of pure H2O (i.e., 0% D2O), its contribution to the total neutron SDP is nearly zero, while in the case of 100% D2O, its distribution overlaps with the equivalent X-ray SDP. Finally, the phosphate group is well described by a separate Gaussian (P) for both X-ray and neutron SDPs, as shown in Figure 3.
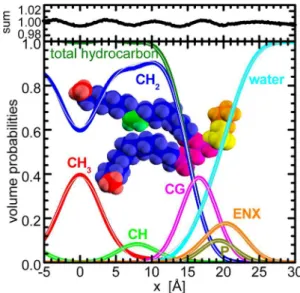
Figure 4 shows the volume probabilities of the full SDP model for PE lipids, including the hydrocarbon region. The example was calculated utilizing results from SLIPIDS simulations performed at NPT. The parsing scheme and selection of functional forms are justified by the excellent
Figure 3.Distribution functions of PE headgroup components plotted in X-ray scattering length density (left-hand axis in green) and neutron scattering length density (right-hand axis in blue). Note the factor of 4 between the values of the two axes. The effect of PE amine’s exchangeable hydrogens is shown for ULVs in 100% (blue dotted line) and 0% (purple dotted line) D2O.
The Journal of Physical Chemistry B Article
dx.doi.org/10.1021/jp511159q | J. Phys. Chem. B 2015, 119, 1947−1956
agreement between component distributions and their associated fits. The small deviation from unity in the sum of all component probabilities at each point along the bilayer normal further stresses this agreement.
PE Structures from SDP.We applied the proposed SDP model (Figure 4) to high resolution X-ray scattering data (q > 0.6 Å−1) obtained from ULVs in H
2O, and lower resolution neutron scattering data (q ∼ 0.3 Å−1) from ULVs in 100%, 75%, and 50% D2O. The best SDP model fits agree very well with experimental data (see Supporting Information for detailed results). As expected, compared to X-ray data, neutron scattering data does not extend to high q values, due in part to the inherently featureless neutron SDP. It is worth noting the presence of a second lobe in the 100% D2O experimental data (Figure 5). Although this lobe is typically not observed for fully protiated PC lipids, it is observed for POPE and SOPE owing
to their relatively thick bilayers, along with concomitant shift of the first scattering minimum toward smaller q (further from the onset of incoherent background scattering that eventually overtakes the coherent scattering signal at high q). Still, the overall structural parameters (i.e., area per lipid A and bilayer thickness DB) are determined mostly from the first lobe of 100% D2O neutron scattering data, due to the large contrast between the bilayer and water phase.
The most robust SDP parameter is the bilayer thickness DB obtained from the Gibbs dividing surface for the water distribution.20Area per lipid A is then calculated directly from
=
A 2 /V DL B (2)
using an independently measured lipid volume VL(Figure 1). In addition, the hydrocarbon chain thickness 2DCis evaluated as
= −
D V V A
2 C 2( L HL)/ (3)
assuming a PE headgroup volume VHL. From the comparison of volumetric measurements of various PC32 and PE lipids, we estimate VHLto be 245 Å3for PE (see Figure 1). Since the data were measured at several different temperatures within the liquid-crystalline phase (above 35 °C for all lipids studied), the obtained structural parameters allow for the determination of thermal coefficients from slopes of linear functions used to fit the temperature dependent data. In particular, we calculate area thermal expansivity αAT = (1/A)(∂A/∂T)Π and thickness thermal contractivity αDT = −(1/D)(∂D/∂T)Π, where Π indicates constant pressure. Table 1 summarizes the most relevant structural parameters.
As expected, PE bilayer structural parameters depend strongly on chain composition and temperature. However, similar to previous findings, and despite the larger PE bilayer thickness when compared to PC32 and PG bilayers,34,35 the values for αAT, αDBT , and αDCT show only a marginal temperature dependence. Moreover, differences in thermal expansivities/ contractivties seem to depend on chain saturation level, a phenomenon also observed in PC and PG lipids. The largest values are observed for the PE lipid with two saturated chains (i.e., DLPE), as a result of its smaller A and D. The absolute changes of A and DB (though not 2DC) are, however, very similar for all three PEs studied. In addition, DBdecreases more rapidly with temperature than 2DC. This can be reconciled by the simple relation assumed by space-filling models like SDP, whereby A is the parameter that links DB and 2DC through corresponding volumetric data in eqs 2 and 3. These parameters then vary in unison. The bilayers become thinner at higher temperature, most likely due to increased trans− gauche rotational isomerization events that expand the bilayer in the lateral direction. Similar responses are observed for all four lipid headgroups (i.e., PC, PG, PS, and PE), reinforcing the notion that the effect of increasing temperature on A (see Figure 6) is, for the most part, due to the disordering of the hydrocarbon chains, at the same time delicately balancing the changes in entropy and enthalpy taking place within the bilayer.34
While all bilayers show a similar response to temperature change, the differences in bilayers with chemically different headgroups manifest themselves through the offsets of their structural parameters. For example, the larger thickness of PE bilayers can be attributed to the headgroup’s much smaller cross-sectional area, also reported by some previous studies. As already mentioned, the CHARMM36 simulations of Klauda et
Figure 4.Complete SDP model of PE lipids in volume probability representation. Thin gray lines are the best fits utilizing Gaussians for CH3, CH, CG, P, and ENX components, while a pair of error
functions is used to describe the distributions of the total hydrocarbon region. The water distribution function is calculated as the complementarity of all fits to unity. The top panel shows the sum of all component probabilities deviating little from unity, thus lending credence to the chosen parsing scheme.
Figure 5.Experimental neutron scattering form factors measured for POPE and SOPE bilayers dispersed in 100% D2O at three
temperatures. The data reveal a clear second lobe centered around q ∼0.25 Å−1. POPE data are shifted by 1 × 10⁻⁴Å−1for viewing clarity.
al.42predicted an area per POPE of 59.2 ± 0.3 Å2at 37 °C, and Jämbeck et al.25 reported 56.3 ± 0.4 Å2 at 30 °C using the SLIPIDS force field. Other examples of yet different simulation approaches reported a value of 62.3 ± 0.4 Å2for POPE at 30 °C based on transferable potentials for phase equilibria,22and 55.5 ± 0.2 Å2at 37 °C using Lipid14 of the AMBER lipid force field.24Among experimental studies, Pabst et al.68 derived an area of 52 ± 1 Å2for DPPE at 75 °C. However, this value is low compared to our estimated area of 60.3 Å2for DLPE bilayers extrapolated to the same temperature (see Figure 6). Our value is in much better agreement with that (60.5 Å2) obtained at 69 °C by Petrache et al.69Our result of 51.7 ± 1 Å2also compares well with the 49.1 ± 1.2 Å2value determined experimentally by McIntosh and Simon70 for DLPE bilayers at 35 °C. More
importantly, each of the above-mentioned studies arrived at a low number of water molecules hydrating PE headgroups (between only 4 and 7, compared to ∼12 for a typical fluid PC bilayer71). In fact, the steric exclusion interactions and strong
hydrogen bonding between PE headgroups72 that are responsible for such low hydration and volumes are unique among the glycerophospholipids. Unlike the strong repulsive interactions between gel phase PC headgroups below areas per
lipid of ∼48 Å2, which prevent optimal (minimal) packing of the hydrocarbon chains,73PE headgroups appear to allow such
packing. The minimal area of an all-trans chain is ∼20 Å2of area,74while total area for DLPE in gel bilayers is ∼41 Å2.70
The fluid phase PE area per lipid then likely represents the packing limit for fluid chains, as pointed out by Petrache et al.69
■
CONCLUSIONSTo fully understand the complex interplay between membrane biomolecules, reliable information on the interactions taking place in the underlying lipid matrix is essential. Here, we have extended our previous studies of bilayer structural parameters of different headgroup type lipids to PE bilayers. The results are obtained from the combined analysis of experimental X-ray and neutron scattering data with a newly developed PE SDP model based on extensive MD simulations using the CHARMM3642 and SLIPIDS25 force fields. Using a model-free approach,62
which directly compares simulated and experimental data,21we conclude that there are ongoing inconsistencies23between MD and experiment when X-ray and neutron scattering data are evaluated separately. Both force fields, however, suggest a similar most probable (i.e., resulting from the simultaneous analysis of X-ray and neutron scattering data) area per lipid for POPE of ∼58 Å2. This value is similar to results from unconstrained SLIPIDS simulations, and importantly, is consistent with results from SDP analysis of experimental data. We obtained bilayer structural parameters for three commonly used PE lipids (i.e., DLPE, POPE, and SOPE) in their fully hydrated fluid phase as a function of temperature. All three lipids exhibit a similar thermal response of their area per lipid A, overall bilayer thickness DB, and hydrocarbon region thickness 2DC. Specifically, bilayers become thinner in the transverse direction and expand laterally with increasing temperature. This behavior was compared to previously studied lipids with different headgroups (i.e., PC, PG, and PS). All bilayers exhibit a similar thermal response, which reinforces the notion that the temperature effect on A is, for the most part, due to the disordering of the hydrocarbon chains.
While our results reveal a common thermal response for the different glycerophospholipids, the chemical nature of the PE headgroup has a dramatic effect on the lateral packing of lipids, which is distinct from that of PC, PG, and PS. Specifically, compared to their PC, PG, or PS counterparts, PEs with mixed fatty acid chains have areas per lipid which are smaller by more than 5 Å2, and PEs with saturated acyl chains have areas per lipid which are smaller by more than 10 Å2. These differences in area per lipid are most likely the result of reduced hydration Table 1. Area per Lipid A [Å2], Overall Bilayer Thickness D
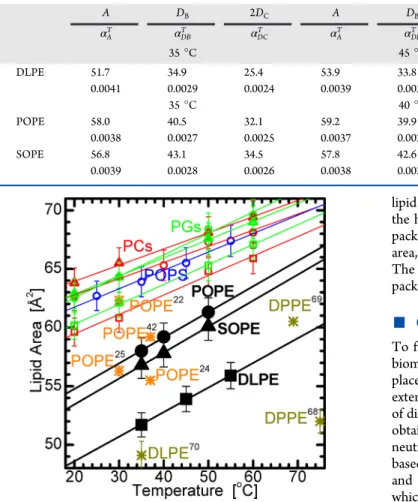
B[Å], and Hydrocarbon Thickness 2DC[Å] Obtained from SDP Analysis of DLPE, POPE, and SOPE Bilayers at Various Temperatures, Together with Their Calculated Thermal Coefficients αT[deg−1] A DB 2DC A DB 2DC A DB 2DC αAT αDBT αDCT αAT αDBT αDCT αAT αDBT αDCT 35 °C 45 °C 55 °C DLPE 51.7 34.9 25.4 53.9 33.8 24.7 55.9 32.9 24.1 0.0041 0.0029 0.0024 0.0039 0.0030 0.0024 0.0038 0.0030 0.0025 35 °C 40 °C 50 °C POPE 58.0 40.5 32.1 59.2 39.9 31.6 61.3 38.8 30.8 0.0038 0.0027 0.0025 0.0037 0.0028 0.0025 0.0036 0.0028 0.0026 SOPE 56.8 43.1 34.5 57.8 42.6 34.1 60.1 41.3 33.2 0.0039 0.0028 0.0026 0.0038 0.0028 0.0026 0.0037 0.0029 0.0027
Figure 6.Lipid area as a function of temperature. The solid symbols are the current PE results determined from SDP analysis, while open symbols show previous SDP results for corresponding PC,32PG,35and
POPS bilayers.36 Asterisks denote literature values discussed in the
text. Simulated data are shown in orange and experimental data in dark yellow.
The Journal of Physical Chemistry B Article
dx.doi.org/10.1021/jp511159q | J. Phys. Chem. B 2015, 119, 1947−1956
and stronger hydrogen bonding inherent to PE headgroups. Our results, then, are consistent with the notion that headgroups govern lipid bilayer packing, while hydrocarbon chains dominate the bilayer’s response to changes in temper-ature. Evidently, the cell has many tools at its disposal for producing environments suitable for the specific requirements of its various membranes, with PE lipids playing their own special role.
■
ASSOCIATED CONTENT*
S Supporting InformationGraphical comparison of NPT simulation results and experimental scattering form factors, detailed structural results of SDP analysis, and SDP analysis results compared to MD simulations. This material is available free of charge via the Internet at http://pubs.acs.org.
■
AUTHOR INFORMATION Corresponding Authors *E-mail: Kucerka@nf.jinr.ru. *E-mail: KatsarasJ@ornl.gov. NotesThe authors declare no competing financial interest.
■
ACKNOWLEDGMENTSJ. K. is supported through the Department of Energy (DOE) Scientific User Facilities Division, Office of Basic Energy Sciences. This work acknowledges additional support from the DOE Office of Biological and Environmental Research, for the BioSANS instrument at the ORNL Center for Structural Molecular Biology. The facility is managed for DOE by UT-Battelle, LLC under contract no. DEAC05-00OR2275. SAXS data were collected at the Cornell High Energy Synchrotron Source (CHESS), which is supported by the National Science Foundation and the National Institutes of Health/National Institute of General Medical Sciences under NSF award DMR-0936384. The MD simulations in this work were made possible by the facilities of the Shared Hierarchical Academic Research Computing Network (SHARCNET: www.sharcnet.ca) and Compute/Calcul Canada.
■
REFERENCES(1) Harroun, T. A.; Kučerka, N.; Nieh, M. P.; Katsaras, J. Neutron and X-Ray Scattering for Biophysics and Biotechnology: Examples of Self-Assembled Lipid Systems. Soft Matter 2009, 5, 2694−2703.
(2) Cullis, P. R.; Hope, M. J. Biochemistry of Lipids and Membranes; The Benjamin/Cumings Publishing Company, Inc.: Menlo Park, CA, 1985; Chapter 2, pp 25−72.
(3) van Meer, G.; Voelker, D. R.; Feigenson, G. W. Membrane Lipids: Where They Are and How They Behave. Nat. Rev. Mol. Cell Biol. 2008, 9, 112−124.
(4) Marsh, D. Handbook of Lipid Bilayers, 2nd ed.; CRC Press: Boca Raton, 2013.
(5) Marsh, D. Lateral Pressure Profile, Spontaneous Curvature Frustration, and the Incorporation and Conformation of Proteins in Membranes. Biophys. J. 2007, 93, 3884−3899.
(6) Pabst, G.; Kučerka, N.; Nieh, M. P.; Rheinstädter, M. C.; Katsaras, J. Applications of Neutron and X-Ray Scattering to the Study of Biologically Relevant Model Membranes. Chem. Phys. Lipids 2010, 163, 460−479.
(7) Kučerka, N.; Nieh, M. P.; Pencer, J.; Harroun, T. A.; Katsaras, J. The Study of Liposomes, Lamellae and Membranes Using Neutrons and X-Rays. Curr. Opin. Colloid Interface Sci. 2007, 12, 17−22.
(8) Weijers, R. N. Lipid Composition of Cell Membranes and Its Relevance in Type 2 Diabetes Mellitus. Curr. Diabetes Rev. 2012, 8, 390−400.
(9) Vance, J. E.; Tasseva, G. Formation and Function of Phosphatidylserine and Phosphatidylethanolamine in Mammalian Cells. Biochim. Biophys. Acta 2013, 1831, 543−554.
(10) Vance, J. E. Thematic Review Series: Glycerolipids. Phosphatidylserine and Phosphatidylethanolamine in Mammalian Cells: Two Metabolically Related Aminophospholipids. J. Lipid Res. 2008, 49, 1377−1387.
(11) Li, Z.; Agellon, L. B.; Allen, T. M.; Umeda, M.; Jewell, L.; Mason, A.; Vance, D. E. The Ratio of Phosphatidylcholine to Phosphatidylethanolamine Influences Membrane Integrity and Steatohepatitis. Cell Metab. 2006, 3, 321−331.
(12) Post, J. A.; Bijvelt, J. J.; Verkleij, A. J. Phosphatidylethanolamine and Sarcolemmal Damage During Ischemia or Metabolic Inhibition of Heart Myocytes. Am. J. Physiol. 1995, 268, H773−H780.
(13) Tasseva, G.; Bai, H. D.; Davidescu, M.; Haromy, A.; Michelakis, E.; Vance, J. E. Phosphatidylethanolamine Deficiency in Mammalian Mitochondria Impairs Oxidative Phosphorylation and Alters Mito-chondrial Morphology. J. Biol. Chem. 2013, 288, 4158−4173.
(14) Johri, A.; Beal, M. F. Mitochondrial Dysfunction in Neuro-degenerative Diseases. J. Pharmacol. Exp. Therapeutics 2012, 342, 619− 630.
(15) Ren, J.; Pulakat, L.; Whaley-Connell, A.; Sowers, J. R. Mitochondrial Biogenesis in the Metabolic Syndrome and Cardiovas-cular Disease. J. Mol. Med. (Berlin) 2010, 88, 993−1001.
(16) Supale, S.; Li, N.; Brun, T.; Maechler, P. Mitochondrial Dysfunction in Pancreatic Beta Cells. Trends Endocrinol. Metab. 2012, 23, 477−487.
(17) Baysal, B. E.; Ferrell, R. E.; Willett-Brozick, J. E.; Lawrence, E. C.; Myssiorek, D.; Bosch, A.; van der, M. A.; Taschner, P. E.; Rubinstein, W. S.; Myers, E. N.; Richard, C. W., III; Cornelisse, C. J.; Devilee, P.; Devlin, B. Mutations in SDHD, a Mitochondrial Complex II Gene, in Hereditary Paraganglioma. Science 2000, 287, 848−851.
(18) Goldfine, H. Lipid Chemistry and Metabolism. Annu. Rev. Biochem. 1968, 37, 303−330.
(19) Heberle, F. A.; Pan, J.; Standaert, R. F.; Drazba, P.; Kučerka, N.; Katsaras, J. Model-Based Approaches for the Determination of Lipid Bilayer Structure From Small-Angle Neutron and X-Ray Scattering Data. Eur. Biophys. J. 2012, 41, 875−890.
(20) Kučerka, N.; Nagle, J. F.; Sachs, J. N.; Feller, S. E.; Pencer, J.; Jackson, A.; Katsaras, J. Lipid Bilayer Structure Determined by the Simultaneous Analysis of Neutron and X-Ray Scattering Data. Biophys. J. 2008, 95, 2356−2367.
(21) Kučerka, N.; Katsaras, J.; Nagle, J. F. Comparing Membrane Simulations to Scattering Experiments: Introducing the SIMtoEXP Software. J. Membr. Biol. 2010, 235, 43−50.
(22) Bhatnagar, N.; Kamath, G.; Potoff, J. J. Biomolecular Simulations With the Transferable Potentials for Phase Equilibria: Extension to Phospholipids. J. Phys. Chem. B 2013, 117, 9910−9921. (23) Braun, A. R.; Sachs, J. N.; Nagle, J. F. Comparing Simulations of Lipid Bilayers to Scattering Data: the GROMOS 43A1-S3 Force Field. J. Phys. Chem. B 2013, 117, 5065−5072.
(24) Dickson, C. J.; Madej, B. D.; Skjevik, A. A.; Betz, R. M.; Teigen, K.; Gould, I. R.; Walker, R. C. Lipid14: The Amber Lipid Force Field. J. Chem. Theory Comput. 2014, 10, 865−879.
(25) Jämbeck, J. P. M.; Lyubartsev, A. P. An Extension and Further Validation of an All-Atomistic Force Field for Biological Membranes. J. Chem. Theory Comput. 2012, 8, 2938−2948.
(26) Jämbeck, J. P. M.; Lyubartsev, A. P. Derivation and Systematic Validation of a Refined All-Atom Force Field for Phosphatidylcholine Lipids. J. Phys. Chem. B 2012, 116, 3164−3179.
(27) Jämbeck, J. P. M.; Lyubartsev, A. P. Another Piece of the Membrane Puzzle: Extending Slipids Further. J. Chem. Theory Comput. 2012, 9, 774−784.
(28) Lee, S.; Tran, A.; Allsopp, M.; Lim, J. B.; Henin, J.; Klauda, J. B. CHARMM36 United Atom Chain Model for Lipids and Surfactants. J. Phys. Chem. B 2014, 118, 547−556.
(29) Nagle, J. F. Introductory Lecture: Basic Quantities in Model Biomembranes. Faraday Discuss. 2013, 161, 11−29.
(30) Raghunathan, M.; Zubovski, Y.; Venable, R. M.; Pastor, R. W.; Nagle, J. F.; Tristram-Nagle, S. Structure and Elasticity of Lipid Membranes With Genistein and Daidzein Bioflavinoids Using X-Ray Scattering and MD Simulations. J. Phys. Chem. B 2012, 116, 3918− 3927.
(31) Zhuang, X.; Makover, J. R.; Im, W.; Klauda, J. B. A Systematic Molecular Dynamics Simulation Study of Temperature Dependent Bilayer Structural Properties. Biochim. Biophys. Acta 2014, 1838, 2520−2529.
(32) Kučerka, N.; Nieh, M. P.; Katsaras, J. Fluid Phase Lipid Areas and Bilayer Thicknesses of Commonly Used Phosphatidylcholines As a Function of Temperature. Biochim. Biophys. Acta 2011, 1808, 2761− 2771.
(33) Pan, J.; Cheng, X.; Heberle, F. A.; Mostofian, B.; Kučerka, N.; Drazba, P.; Katsaras, J. Interactions Between Ether Phospholipids and Cholesterol As Determined by Scattering and Molecular Dynamics Simulations. J. Phys. Chem. B 2012, 116, 14829−14838.
(34) Pan, J.; Heberle, F. A.; Tristram-Nagle, S.; Szymanski, M.; Koepfinger, M.; Katsaras, J.; Kučerka, N. Molecular Structures of Fluid Phase Phosphatidylglycerol Bilayers As Determined by Small Angle Neutron and X-Ray Scattering. Biochim. Biophys. Acta 2012, 1818, 2135−2148.
(35) Pan, J.; Marquardt, D.; Heberle, F. A.; Kučerka, N.; Katsaras, J. Revisiting the Bilayer Structures of Fluid Phase Phosphatidylglycerol Lipids: Accounting for Exchangeable Hydrogens. Biochim. Biophys. Acta 2014, 1838, 2966−2969.
(36) Pan, J.; Cheng, X.; Monticelli, L.; Heberle, F. A.; Kučerka, N.; Tieleman, D. P.; Katsaras, J. The Molecular Structure of a Phosphatidylserine Bilayer Determined by Scattering and Molecular Dynamics Simulations. Soft Matter 2014, 10, 3716−3725.
(37) Kučerka, N.; Pencer, J.; Sachs, J. N.; Nagle, J. F.; Katsaras, J. Curvature Effect on the Structure of Phospholipid Bilayers. Langmuir 2007, 23, 1292−1299.
(38) Heller, W. T.; Lynn, G. W.; Urban, V. S.; Weiss, K.; Myles, D. A. A. The Bio-SANS Small-Angle Neutron Scattering Instrument at Oak Ridge National Laboratory. Neutron News 2008, 19, 22−23.
(39) Kučerka, N.; Liu, Y.; Chu, N.; Petrache, H. I.; Tristram-Nagle, S.; Nagle, J. F. Structure of Fully Hydrated Fluid Phase DMPC and DLPC Lipid Bilayers Using X-Ray Scattering From Oriented Multilamellar Arrays and From Unilamellar Vesicles. Biophys. J. 2005, 88, 2626−2637.
(40) Blanton, T. N.; Huang, T. C.; Toraya, H.; Hubbard, C. R.; Robie, S. B.; Louër, D.; Göbel, H. E.; Will, G.; Gilles, R.; Raftery, T. JCPDS - International Centre for Diffraction Data Round Robin Study of Silver Behenate. A Possible Low-Angle X-Ray Diffraction Calibration Standard. Powder Diffraction 1995, 10, 91−95.
(41) Van Der Spoel, D.; Lindahl, E.; Hess, B.; Groenhof, G.; Mark, A. E.; Berendsen, H. J. GROMACS: Fast, Flexible, and Free. J. Comput. Chem. 2005, 26, 1701−1718.
(42) Klauda, J. B.; Venable, R. M.; Freites, J. A.; O’Connor, J. W.; Tobias, D. J.; Mondragon-Ramirez, C.; Vorobyov, I.; MacKerell, A. D., Jr.; Pastor, R. W. Update of the CHARMM All-Atom Additive Force Field for Lipids: Validation on Six Lipid Types. J. Phys. Chem. B 2010, 114, 7830−7843.
(43) Abraham, M. J.; Van Der Spoel, D.; Lindahl, E.; Hess, B.; the GROMACS development team. GROMACS User Manual Version 5.0.2; www.gromacs.org, 2014.
(44) Jo, S.; Kim, T.; Iyer, V. G.; Im, W. CHARMM-GUI: a Web-Based Graphical User Interface for CHARMM. J. Comput. Chem. 2008, 29, 1859−1865.
(45) Bjelkmar, P.; Larsson, P.; Cuendet, M. A.; Hess, B.; Lindahl, E. Implementation of the CHARMM Force Field in GROMACS: Analysis of Protein Stability Effects From Correction Maps, Virtual Interaction Sites, and Water Models. J. Chem. Theory Comput. 2010, 6, 459−466.
(46) Jämbeck, J. Downloads, Stockholm Lipids;http://people.su.se/ ~jjm/Stockholm_Lipids/Downloads.html, June 2013.
(47) Piggot, T. J.; Pineiro, A.; Khalid, S. Molecular Dynamics Simulations of Phosphatidylcholine Membranes: A Comparative Force Field Study. J. Chem. Theory Comput. 2012, 8, 4593−4609.
(48) Piggot, T. CHARMM36 Smaller Area Per Lipid for POPE -Why?http://permalink.gmane.org/gmane.science.biology.gromacs. user/53633, 2014.
(49) Benz, R. W.; Castro-Roman, F.; Tobias, D. J.; White, S. H. Experimental Validation of Molecular Dynamics Simulations of Lipid Bilayers: a New Approach. Biophys. J. 2005, 88, 805−817.
(50) Jensen, M. O.; Mouritsen, O. G.; Peters, G. H. Simulations of a Membrane-Anchored Peptide: Structure, Dynamics, and Influence on Bilayer Properties. Biophys. J. 2004, 86, 3556−3575.
(51) Klauda, J. B.; Brooks, B. R.; MacKerell, A. D., Jr.; Venable, R. M.; Pastor, R. W. An Ab Initio Study on the Torsional Surface of Alkanes and Its Effect on Molecular Simulations of Alkanes and a DPPC Bilayer. J. Phys. Chem. B 2005, 109, 5300−5311.
(52) Berger, O.; Edholm, O.; Jahnig, F. Molecular Dynamics Simulations of a Fluid Bilayer of Dipalmitoylphosphatidylcholine at Full Hydration, Constant Pressure, and Constant Temperature. Biophys. J. 1997, 72, 2002−2013.
(53) Sapay, N.; Tieleman, D. P. Combination of the CHARMM27 Force Field With United-Atom Lipid Force Fields. J. Comput. Chem. 2011, 32, 1400−1410.
(54) Feller, S. E.; Pastor, R. W. On Simulating Lipid Bilayers With an Applied Surface Tension: Periodic Boundary Conditions and Undulations. Biophys. J. 1996, 71, 1350−1355.
(55) Feller, S. E.; Feller, S. E.; Zhang, Y.; Zhang, Y.; Pastor, R. W.; Pastor, R. W. Computer Simulation of Liquid/Liquid Interfaces. II. Surface Tension-Area Dependence of a Bilayer and Monolayer. J. Chem. Phys. 1995, 103, 10267−10276.
(56) Jahnig, F. What Is the Surface Tension of a Lipid Bilayer Membrane? Biophys. J. 1996, 71, 1348−1349.
(57) Lindahl, E.; Edholm, O. Mesoscopic Undulations and Thickness Fluctuations in Lipid Bilayers From Molecular Dynamics Simulations. Biophys. J. 2000, 79, 426−433.
(58) Marrink, S. J.; Mark, A. E. Effect of Undulations on Surface Tension in Simulated Bilayers. J. Phys. Chem. B 2001, 105, 6122−6127. (59) Marsh, D. Renormalization of the Tension and Area Expansion Modulus in Fluid Membranes. Biophys. J. 1997, 73, 865−869.
(60) Skibinsky, A.; Venable, R. M.; Pastor, R. W. A Molecular Dynamics Study of the Response of Lipid Bilayers and Monolayers to Trehalose. Biophys. J. 2005, 89, 4111−4121.
(61) Zhang, Y.; Zhang, Y.; Feller, S. E.; Feller, S. E.; Brooks, B. R.; Brooks, B. R.; Pastor, R. W.; Pastor, R. W. Computer Simulation of Liquid/Liquid Interfaces. I. Theory and Application to Octane/Water. J. Chem. Phys. 1995, 103, 10252−10266.
(62) Klauda, J. B.; Kučerka, N.; Brooks, B. R.; Pastor, R. W.; Nagle, J. F. Simulation-Based Methods for Interpreting X-Ray Data From Lipid Bilayers. Biophys. J. 2006, 90, 2796−2807.
(63) Anézo, C.; de Vries, A. H.; Holtje, H. D.; Tieleman, D. P.; Marrink, S. J. Methodological Issues in Lipid Bilayer Simulations. J. Phys. Chem. B 2003, 107, 9424−9433.
(64) Sachs, J. N.; Petrache, H. I.; Woolf, T. B. Interpretation of Small Angle X-Ray Measurements Guided by Molecular Dynamics Simulations of Lipid Bilayers. Chem. Phys. Lipids 2003, 126, 211−223. (65) Klauda, J. B.; Monje, V.; Kim, T.; Im, W. Improving the CHARMM Force Field for Polyunsaturated Fatty Acid Chains. J. Phys. Chem. B 2012, 116, 9424−9431.
(66) Kang, H.; Klauda, J. B. Molecular Dynamics Simulations of Palmitoyloleoylphosphatidylglycerol Bilayers. Mol. Simul. 2014, 1−7.
(67) Kučerka, N.; Holland, B. W.; Gray, C. G.; Tomberli, B.; Katsaras, J. Scattering Density Profile Model of POPG Bilayers As Determined by Molecular Dynamics Simulations and Small-Angle Neutron and X-Ray Scattering Experiments. J. Phys. Chem. B 2012, 116, 232−239.
(68) Pabst, G.; Rappolt, M.; Amenitsch, H.; Laggner, P. Structural Information From Multilamellar Liposomes at Full Hydration: Full Q-Range Fitting With High Quality X-Ray Data. Phys. Rev. E 2000, 62, 4000−4009.
The Journal of Physical Chemistry B Article
dx.doi.org/10.1021/jp511159q | J. Phys. Chem. B 2015, 119, 1947−1956
(69) Petrache, H. I.; Dodd, S. W.; Brown, M. F. Area Per Lipid and Acyl Length Distributions in Fluid Phosphatidylcholines Determined by2H NMR Spectroscopy. Biophys. J. 2000, 79, 3172−3192.
(70) McIntosh, T. J.; Simon, S. A. Area Per Molecule and Distribution of Water in Fully Hydrated Dilauroylphosphatidyletha-nolamine Bilayers. Biochemistry 1986, 25, 4948−4952.
(71) Small, D. M. Phase Equilibria and Structure of Dry and Hydrated Egg Lecithin. J. Lipid Res. 1967, 8, 551−557.
(72) Pink, D. A.; McNeil, S.; Quinn, B.; Zuckermann, M. J. A Model of Hydrogen Bond Formation in Phosphatidylethanolamine Bilayers. Biochim. Biophys. Acta 1998, 1368, 289−305.
(73) Tristram-Nagle, S.; Zhang, R.; Suter, R. M.; Worthington, C. R.; Sun, W. J.; Nagle, J. F. Measurement of Chain Tilt Angle in Fully Hydrated Bilayers of Gel Phase Lecithins. Biophys. J. 1993, 64, 1097− 1109.
(74) Sun, W. J.; Tristram-Nagle, S.; Suter, R. M.; Nagle, J. F. Structure of Gel Phase Saturated Lecithin Bilayers: Temperature and Chain Length Dependence. Biophys. J. 1996, 71, 885−891.