Effect of equilibrated hydration changes on total body water
estimates by bioelectrical impedance analysis
Vincent Pialoux
1, Isabelle Mischler
1, Remi Mounier
1, Pierre Gachon
2, Patrick Ritz
2,
Jean Coudert
1and Nicole Fellmann
1*
1
Laboratoire de Physiologie-Biologie du Sport, Faculte´ de Me´decine, Universite´ d’Auvergne, 28 place Henri Dunant, Clermont-Ferrand 63000, France
2
Unite´ Prote´ino-Me´tabolique, Laboratoire de Nutrition Humaine, Clermont-Ferrand, France (Received 24 April 2003 – Revised 9 September 2003 – Accepted 24 September 2003)
The present study was performed to determine how equilibrated fluctuations in hydration affected the validity of bioelectrical impedance analysis (BIA) for body composition assessment. Total body water (TBW) expansion was induced by a 4 d endurance trial and the sub-sequent water loss was obtained over the recovery period. Twelve healthy men exercised on a cycle and treadmill alternately for 5 h/d over 4 d at moderate intensity. TBW, fat mass (FM) and fat-free mass (FFM) were assessed 3 d before the trial (control), and on the first and eighth day of recovery (R1 and R8 respectively). TBW was evaluated by2H dilution (TBW2H) as a reference method and by BIA
(TBWBIA) at 100 kHz at the same time. TBW2H increased significantly between the control day and R1 by 1·87 (SD 1·11) litres
(P¼ 0·005) and TBWBIAby 1·38 (SD 1·56) litres (P¼ 0·009). Both values returned to the control level on R8. For each period, TBW2H
and TBWBIAdid not differ significantly and were correlated (r20·85, P¼ 0·0004 for the control day; r20·63, P¼ 0·03 for R1; r20·75,
P¼ 0·02 for R8). Plasma Na concentration and osmolality did not differ between the control day, R1 and R8. FFM gain (1208 (SD
1983) g) and FM loss (2 1168 (SD 906) g) between the control day and R1 were followed by a FFM decrease (2 624 (SD 1281) g) and a FM increase (860 (SD 1212) g) between R1 and R8. As expected, these FFM and FM changes were significantly correlated with TBW variations. The present results provide evidence that BIA may be a useful method for estimating TBW when fluid shifts are equi-librated and electrolyte concentrations are unchanged. However, it is not a valid technique for assessing FM and FFM under these conditions.
2
H dilution: Hyperhydration: Dehydration: Fat-free-mass hydration: Fat mass Ultra-endurance exercises prolonged over several days or
weeks may induce body composition changes mainly due to a loss of fat mass (FM) and to a lesser degree a loss of protein and carbohydrate mass (Ballor, 1996). A simple measurement of body mass (BM) cannot adequately quantify the FM loss. Total body water (TBW) is, in fact, known to increase transiently during such ultra-endurance events (Williams et al. 1979; Milledge et al. 1982; Fellmann et al. 1999) and could counterbalance FM loss, resulting in a lack of BM decrease and even, in some cases, in a BM increase.
Bioelectrical impedance analysis (BIA) has gained much attention because it is a rapid, inexpensive and non-inva-sive method of estimating TBW and body composition. Fat-free mass (FFM) assessed by BIA is dependent on the measurement of TBW and the use of a percentage of theoretical FFM hydration which is considered constant and equal to 0·732 (Baumgartner et al. 1990). The FM is subsequently calculated by subtracting FFM from BM. Consequently, body composition assessment using BIA
could be affected by two cumulative types of error. First, the TBW measurement is sensitive to confounding factors relative to the measurement conditions (time of recumb-ence before measurement, electrode placement, limb pos-ition) (Baumgartner et al. 1990). The TBW measurement is sensitive to factors dependent on the physiological state of the subject (body and skin temperatures, plasma osmolality and electrolyte concentrations) (Caton et al. 1988; Roos et al. 1992; Gudivaka et al. 1996; Rees et al. 1999). Second, since the BIA principle assumes a constant FFM hydration, the calculation of FFM from TBW is affected by body-water changes (Lukaski et al. 1985; Kushner et al. 1986). A TBW increase is thus perceived by BIA as an additional FFM resulting in an underestima-tion of FM values; conversely for a TBW decrease, FM will be overestimated.
It is now well documented that current BIA method-ology may not provide valid estimates of TBW and conse-quently percentage fat measurement when acute alterations in hydration (for example, hypohydration after diuretic
* Corresponding author: Dr N. Fellmann, fax þ 33 4 73 44 83 19, email Physio.sport@u-clermont1.fr
Abbreviations:BM, body mass; BIA, bioelectrical impedance analysis; DXA, dual-energy X-ray absorptiometry; FFM, fat-free mass; FM, fat mass; V˙ O2max, maximal O2 uptake; R1, first day of recovery; R8, eighth day of recovery; TBW, total body water; TBWBIA, total body water as measured by bioelectrical impedance analysis.
qThe Authors 2004
. IP address:
118.70.52.165
, on
24 Jun 2021 at 19:26:48
, subject to the Cambridge Core terms of use, available at
https://www.cambridge.org/core/terms
.
treatment, heat exposure and exercise, or hyperhydration using rehydration solutions) occur (O’Brien et al. 2002). These transient situations do not correspond to what has been observed after a 7 d endurance race (Fellmann et al. 1999). TBW expansion (þ 4·2 litres) and the subsequent water loss over the following 8 d were evaluated by BIA several hours after the cessation of the last exercise bout (more than 12 h) after the equilibrium between intra- and extracellular compartments through the membranes had
occurred. Plasma osmolality and Na+ concentration
remained unchanged at each measurement period. To the authors’ knowledge, no studies have investigated the effect of hydration changes on measurements of body com-position using BIA when fluid shifts are stabilised without concomitant changes in electrolyte concentrations.
Therefore, the aim of the present study was to evaluate the effect of equilibrated fluid shifts on BIA measurements of TBW. The method used to induce this fluctuation in hydration was a 4 d period of endurance exercises which has been demonstrated to increase TBW and the subsequent water loss over the recovery period without concomitant plasma osmolality and electrolyte concentration changes (Fellmann et al. 1999). The amount of body water retention
was evaluated by2H dilution, which was used as the
refer-ence method (Schoeller et al. 1980), and by BIA. The hypothesis was that BIA well tracks exercise-induced water retention changes under these conditions and, thus, is prone to errors in the estimation of FFM and FM.
Materials and methods Subjects and study design
Twelve healthy men participated in the study, which was approved by the Ethics Committee on Human Research for Medical Sciences. The subjects were 28·3^ 2·7 years old and weighed 73·4^ 7·6 kg. All of them had received a medical examination and gave informed written consent. Two of them were well-trained triathletes and one was a cyclist (13 h training/week), and the others were recreation-ally active (2 to 4 h exercising/week).
The protocol was divided into three periods:
(1) the control period undergone during the week before the endurance trial which included measurements of bioenergetics parameters, body composition and TBW; (2) the 4 d of exercise;
(3) the first and the eighth day of recovery (R1 and R8 respectively) from the trial during which the same measurements as in the control period were performed with the exception of the bioenergetics measurements. During the recovery period between R1 and R8, the subjects were asked to refrain from heavy exercise. Bioenergetics measurements
At 4 d before beginning the trial, an infra-maximal test was performed on a treadmill (Super 2500; Gymrol, Roche La Molie`re, France). For the 5 min warming-up, the speed was 8·1 ^ 0·2 km/h. Every 3 min, the speed was increased by 1·5 km/h until the heart rate was close to 80 % of the age-predicted maximal value. On the same day, 2 h later,
maximal O2uptake (V˙ O2max) was determined on a cycle
ergometer (Ergomeca, La Bayett, France). During this test, the pedalling velocity of 70 rpm was controlled using a revolution counter. For the 5 min warming-up, the workload was 102·1^ 5·2 W. Every 3 min, the load was increased by 30 W. The exercise was stopped when the subjects were no longer able to sustain the work rate
at the required pedalling. The highest V˙ O2value obtained
was defined as the V˙ O2max. During the two tests, an
elec-trocardiogram was continuously recorded (Schiller, Wis-sembourg, France). The expired air volume was collected into a Douglas bag for 30 s at the end of each stage and
was measured with a Tissot spirometer. CO2and O2
frac-tions in the expired air were measured by CO2and O2
ana-lysers (CPX I D; Medical Graphics, St Paul, MA, USA).
The running V˙ O2max was extrapolated from the
relation-ship between V˙ O2 and heart rate of the submaximal test
and the heart rate reached during the cycling maximal
test. The relationships between V˙ O2 and power output,
and V˙ O2and running speed were also derived from these
tests and used to adapt the exercise intensity on the cycle ergometer and treadmill during the exercise procedure. Exercise trial
The exercise period was performed in the laboratory at a moderate air temperature (22^ 28C). It consisted of 5 h daily exercise over 4 d, i.e. 50 min bouts three times in the morning and three times in the afternoon with a 15 min rest period in sitting position between each bout. A 2 h 15 min break was allowed for lunch. The 50 min bouts were made alternately on a cycle ergometer and a running treadmill. The cycle load and the treadmill speed, which were calculated from the data obtained during the control period, corresponded to a moderate mean exercise intensity which has been sustained in the field in a previous study and has been demonstrated to expand TBW (Fellmann et al. 1999). After cessation of the last exercise bout, subjects took a shower and their activities during the rest of the day consisted mainly of seated activities (reading, watching television).
Diet
During the exercise period, food and beverages were avail-able ad libitum but strictly measured. The quantity of fluid intake during meals and snacks was the sum of beverage drunk and the water content of food for 4 d.
Na mass was determined from dietary recording using GENI software with (MICRO6, Villers les Nancy, France) French (REGAL) and German (SOUCI) tables for food composition.
During the recovery period, diet was not monitored. Measurement conditions
The body composition measurements and the blood with-drawals were performed after an overnight fast of at least 12 h, in the same order as for the control period, R1 and R8. After voiding their bladders, subjects were weighed naked to ^ 0·001 kg on a precision scale (ID1; Mettler Toledo, Columbus, OH, USA). Then a catheter was inserted
. IP address:
118.70.52.165
, on
24 Jun 2021 at 19:26:48
, subject to the Cambridge Core terms of use, available at
https://www.cambridge.org/core/terms
.
in an antecubital vein to obtain blood samples (5 ml) for
bio-chemical analysis. Finally, TBW was measured by 2H
dilution and by BIA (TBWBIA), and FM and FFM were
assessed by BIA.
Body composition: total body water
2H dilution. After collection of a baseline urine sample,
accurately weighed amount (0·15 g/kg BM) of 2H2O
(99·9 % enriched; Sigma Chemicals, Poole, UK) was taken orally by the volunteers (Ritz et al. 1994). Urine samples were collected again at 4, 5 and 6 h post-dose. Subjects remained fasted during the 6 h. Urine samples were kept at 2 208C until analysis. Before isotopic anal-ysis, the samples were purified by vacuum sublimation and then were reduced to hydrogen at 6008C using the
Zn technique reduction (Wong et al. 1987). The 2H:H
ratio was measured on a dual-inlet mass spectrometer (GC – C – IRMS: MICROMASS, Manchester, UK). The mean enrichment (4 – 6 h post-dose) was used to calculate
2H dilution space with a 4 % correction for exchanges
with non-aqueous compounds (Culebras & Moore, 1977). Bioelectrical impedance analysis
Body impedance (resistance and reactance) were measured
with an Analycor 3w
impedancemeter with four electrodes at two frequencies (Euge´dia, Paris, France). The last exercise period had occurred at least 15 h before the measurements. The subjects were dressed in underwear and had been in a relaxed supine position for 1 h in a tem-perature-controlled room (228C) when the measurements were made on the limbs abducted from the body. The injector electrodes were placed just below the phalan-geal-metacarpal joint in the middle of the dorsal side of the right hand and just below the transverse (metatarsal) arch on the upper side of the right foot. Detector electrodes were placed on the posterior side of the right wrist, midline with the prominent pisiform bone on the medial (fifth pha-langeal) side and ventrally across the medial anklebone of the right ankle. The precision of the measurements was assessed on fifty healthy volunteers on whom the resistance was measured 8 h apart; the CV was shown to be 0·6 % (Vache´ et al. 1998). The resistance and reactance were
measured at 100 kHz three times. TBWBIA was calculated
using the specific Analycor equation (3S version 03-96, copyright A. BOULIER). The values reported in the results were the means of the three measurements.
Body composition: fat mass and fat-free mass
FM and FFM were calculated from the same resistance and
reactance as obtained for TBWBIA measurement using the
Analycor equation (3S version 03-96, copyright
A. BOULIER).
Biochemical parameters
Plasma osmolality was determined by means of the freez-ing-point depression method (The Advancede Osmometer 3D3; Advanced Instruments Inc., Norwood, MA, USA).
Automatic analysers were used for the measurements
of plasma Na+, and urea concentrations (Hitachi 911;
Boehringer Mannheim, France). Statistical analysis
All values were expressed as means and standard devi-ations. Statistical analyses (Statview software 5.0; SAS Institute, Inc.q, Norwood, MA, USA) were performed with a one-way repeated measurement ANOVA and when an overall difference was found, individual values were compared using a paired Student’s t test. Values of the two groups were analysed with a Bonferroni test in order to compare the three well-trained subjects with the other moderately trained subjects. Z-Fischer test corre-lations were also calculated. The level of statistical signifi-cance was set at P, 0·05 for all analyses.
Results
The subjects had a mean V˙ O2max of 52·1 (SD7·2) ml/min
per kg BM (range 45·4 – 65·7 ml/min per kg BM) for
cycling and a mean V˙ O2max of 54·1 (SD 7·6) ml/min per
kg BM (range 45·1 – 67·7 ml/min per kg BM) for running. All the subjects achieved the 20 h of exercise expected
during the 4 d. They ran at a mean speed of 8·8 (SD 0·1)
km/h (corresponding to 62·5 (SD4·5) % running V˙ O2max)
and cycled at a mean external mechanical power of 132
(SD 2) W (corresponding to 57·3 (SD 4·7) % cycling
V˙ O2max).
Because no significant differences were found between the well-trained subjects (two triathletes and one cyclist) and the other moderately trained subjects for the TBW and body composition values, all the subjects were included in the same group for statistical analyses. Diet
Mean water and Na+ intakes (food and beverage) were of
7·36 (SD 1·61) litres and 8·49 (SD 0·93) g/d over the 4 d
exercise.
Biochemical parameters
The biochemical parameters are displayed in Table 1.
The plasma osmolality and Na+ concentration did not
significantly change between the control period, R1 and R8. The plasma urea concentration was significantly
increased between the control day and R1 (þ 21·7 (SD
5·0) %) and returned to its basal value in R8. Body composition: total body water
Mean TBW measured by 2H dilution increased by 1·87
(SD 1·11) litres (4·4 (SD 2·6) %) (P¼ 0·005) between the
control day and R1, and returned to its basal value with
a decrease of 1·13 (SD 0·83) litres (P¼ 0·01) between R1
and R8 (Table 2).
The resistance and reactance at 100 kHz used in the
specific equation for TBWBIA calculation are reported
in Table 2. TBWBIA increased significantly by 1·38 (SD
1·56) litres (i.e. þ 3·2 (SD 3·4) %; P¼ 0·009 ) between the
. IP address:
118.70.52.165
, on
24 Jun 2021 at 19:26:48
, subject to the Cambridge Core terms of use, available at
https://www.cambridge.org/core/terms
.
control period and R1 and then decreased between R1 and
R8 (2 0·70 (SD 0·46) litres). The R8 value was not
significantly different from the control value.
The mean TBW values calculated using the two techniques did not differ significantly and were highly
correlated for the control day (r2 0·85; P¼ 0·0004 ), R1
(r20·63; P¼ 0·03 ) and R8 (r20·75; P¼ 0·016 ).
A normal power calculation was performed assuming a
normal distribution two-sample equal variance for
TBWBIA. It was found that for a sample size of twelve
sub-jects, the probability that the null hypothesis would be true is 0·1321.
Body composition: fat mass and fat-free mass
BM did not change significantly between the control period, R1 and R8 (ANOVA; P. 0·05 ) (Table 3).
FFM increased significantly between the control day and
R1 (þ 1208 (SD 1983) g, i.e. 2·0 (SD 2·4) %; P¼ 0·02) and
decreased significantly between R1 and R8 (2 624
(SD1281) g, i.e. 2 1·0 (SD2·0) %; P¼ 0·01). The R8 value
was not significantly different from the control value. FM decreased significantly between the control day and R1
(2 1168 (SD 906) g, i.e. 2 19·8 (SD 24·7) %; P, 0·001).
Between R1 and R8, FM increased significantly (860 (SD
1212) g, i.e. þ 11·6 (SD 13·8) %; P¼ 0·04). FM measured
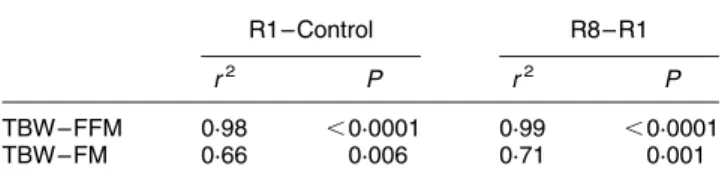
on R8 was not significantly different from the control value. As expected, the FFM and FM changes were highly
correlated with the variations of TBWBIA between the
control day and R1 and between R1 and R8 (Table 4).
Discussion
BIA remains a useful method for estimating TBW if both the stabilisation of hydration status after fluctuations have been reached, and plasma osmolality and electrolyte con-centrations are unchanged. However, BIA assuming a Table 1. Plasma osmolality, sodium and urea on the control day and on the first (R1) and the
eighth (R8) day of recovery†
(Mean values and standard deviations)
Control R1 R8
Mean SD Mean SD Mean SD ANOVA
Osmolality (mosmol/kg water) 287·6 1·6 288·7 3·7 289·3 5·4 NS
Na (mmol/l) 139·9 1·6 139·0 1·3 140·0 1·6 NS
Urea (mmol/l) 6·0 0·2 7·3* 0·3 6·8 0·5 P, 0.05
* Mean value is significantly different from that for the control day (P, 0·05). † For details of procedures, see pp. 154 – 155.
Table 2. Reactance at 100 kHz (Xc 100), resistance at 100 kHz (R 100) and total body water assessed by 2H dilution (TBW2H) and bioimpedance analysis (TBWBIA) on the control day and on the first day (R1) and eighth day (R8) of recovery‡
(Mean values and standard deviations)
Xc 100 (V) R 100 (V) TBWBIA(litres) TBW2H(litres)
Mean SD Mean SD Mean SD Mean SD
Control 36 7 462 69 46·64 6·14 47·31 1·02
R1 32** 5 447* 55 48·02** 5·55 49·18* 1·07
R8 37†† 8 456† 66 47·30† 5·54 48·05† 1·71
Mean value is significantly different from that for the control day: *P, 0·05, **P, 0·01. Mean value is significantly different from that for R1: †P, 0·05, ††P, 0·01. ‡ For details of procedures, see p. 155.
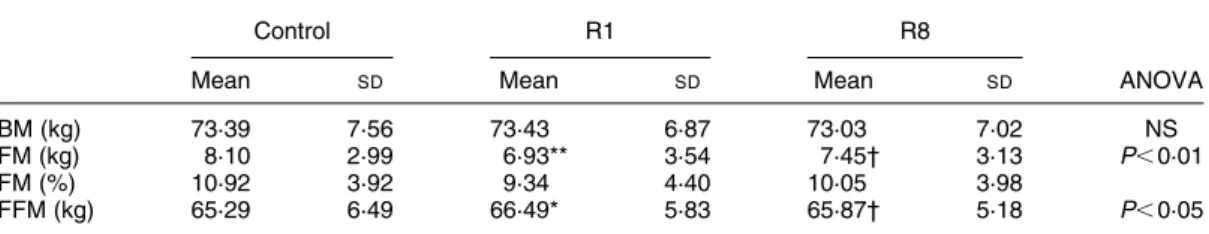
Table 3. Body mass (BM), fat mass (FM) and fat-free mass (FFM) assessed by bioimpedance analysis on the control day and on the first (R1) and the eighth (R8) day of recovery‡
(Mean values and standard deviations)
Control R1 R8
Mean SD Mean SD Mean SD ANOVA
BM (kg) 73·39 7·56 73·43 6·87 73·03 7·02 NS
FM (kg) 8·10 2·99 6·93** 3·54 7·45† 3·13 P, 0·01
FM (%) 10·92 3·92 9·34 4·40 10·05 3·98
FFM (kg) 65·29 6·49 66·49* 5·83 65·87† 5·18 P, 0·05
Mean value is significantly different from that for the control day: *P, 0·05, **P, 0·01. Mean value is significantly different form that for R1: †P, 0·05.
‡ For details of procedures, see p. 155.
. IP address:
118.70.52.165
, on
24 Jun 2021 at 19:26:48
, subject to the Cambridge Core terms of use, available at
https://www.cambridge.org/core/terms
.
constant FFM hydration was inappropriate for body com-position estimates under these experimental conditions.
As expected, our experimental design induced a TBW expansion assessed by BIA immediately after the 4 d endur-ance trial (þ 1·38 litres) and a subsequent water loss over the 8 d of the recovery period (2 0·70 litres). The reference
method (2H dilution) also provided similar results.
In theory, hyperhydration would induce a decrease in resistance compared with euhydration because relatively more fluid is available to conduct the current and, conver-sely, hypohydration should increase resistance. Our data are consistent with the expected results in both situations; the resistance decreased at the end of the endurance trial and increased during the recovery period (Table 2). Because a great variety of methodological and physiologi-cal factors, other than body composition, may affect the validity of BIA to assess TBW, the present study complied with optimal test conditions. Measurements were made at rest, 15 h after the last bout of exercise, on fasted subjects lying for 1 h, lightly dressed, in a room with controlled ambient temperature (228C). Additionally, body and skin temperature drifts generally observed after exercise could represent other factors for BIA measurement errors since a decrease in resistance and FM values has been described after intense elevation of body and skin temperatures (Caton et al. 1988; Gudivaka et al. 1996). In the present study, despite the lack of such measurements, it is reason-able to postulate that skin and body temperatures had returned to their basal level 15 h after the cessation of the last exercise bout.
Conflicting results on the BIA variability when
hydration status varies are reported in the literature and have been recently examined by O’Brien et al. (2002). Regardless of the methods used for inducing either hyperhydration and rehydration, or hypohydration, alteration of resistance either did not fit with the theory or did not correlate with change in body weight. In clusion, these authors emphasised the importance of a con-stant electrolyte concentration associated with stabilised fluid shifts to accurately detect changes in water volume by BIA. These both conditions rarely exist when hydration status is altered. The main discrepancy between the present study and the previous ones would probably be explained by the difference in the hydration change procedures. In the present study, the hyperhydration (between the control day and R1) was the result of an ultra-endurance exercise while the most common strategies consist in infusion or ingestion of fluids of various compositions (O’Brien et al.
2002). Conversely, the loss of water (between R1 and R8) occurred over the recovery period following the exercise event whereas hypohydration status has usually been obtained after heat exposure, exercise or their combination, after dialysis or diuretic treatment (O’Brien et al. 2002). Since the BIA measurements were made in both situations at least 15 h after the last exercise bout, it can be hypoth-esised that water flux between the intra- and extracellular pools were balanced. The lack of changes in plasma
osmol-ality and Naþconcentration gives evidence that electrolyte
concentrations were stabilised.
Therefore, when changes in body water are well equilibrated and optimal measurements conditions are respected, the BIA method provides an accurate estimate of TBW. This is supported by the lack of significant differ-ence between the mean TBW values obtained by BIA and
the reference method (2H dilution), and their significant
relationships on the control day, R1 and R8.
As a consequence, during endurance events prolonged over several days which may simultaneously induce water retention and fat loss, and in some cases protein loss, BIA may not be a reliable estimator for FM. Because BIA assumes a fixed hydration constant, the changes in hydration induce errors in the estimated FFM and hence FM which is evaluated by difference between BM and FFM. Indeed, the FFM gain evaluated by BIA at the end of the 4 d of exercise (þ 1208 g) questions the validity of BIA because a highly catabolic hormonal environment has often been described during such endurance events (Lemon & Proctor, 1991). During a similar trial (Fellmann et al. 1992), it has previously been shown that plasma cortisol concentration was continuously maintained at high levels. This favours the breakdown of protein. In the present study, the significant increase of plasma urea (þ 22 %) (Table 1) provides indirect evidence for proteol-ysis. Furthermore, a decrease in protein synthesis has also been described during endurance events (Dohm et al. 1987; Lemon & Proctor, 1991). Therefore a FFM gain at the end of the 4 d of exercise estimated by BIA may mainly be the consequence of water retention but did not allow information on protein mass changes. This is supported by the highly significant correlations found between TBW and FFM gains during the exercise trial and loss during the recovery period (Table 4). Consequently, BIA is also prone to errors in estimating FM. The TBW vari-ation explained 66 % of FM varivari-ation assessed by BIA between the control day and R1 and 71 % between R1 and R8. Similarly, the FFM loss over the 7 d of recovery (2 624 g) seems unlikely.
At present, only a few methods are sufficiently accurate and validated for quantifying body components in the research laboratory when the hydration status varies conco-mitantly with fat and protein mass as occurs during endur-ance events prolonged over several days. The chemical analysis of carcasses is limited for most studies, and multi-compartment models are costly, laborious and require active subject involvement. Among other available body composition methods, a relatively new method, the dual-energy X-ray absorptiometry (DXA) method has been rapidly adopted for the assessment of whole-body composition. DXA has the advantage of being a three-com-Table 4. Correlations between variations of total body water
(TBW), and fat mass (FM) and fat-free mass (FFM) changes assessed by bioimpedance analysis between the control day and the first day of recovery (R1 – Control), and between the first and the eighth day of recovery (R8 – R1)*
R1 – Control R8 – R1
r2 P r2 P
TBW – FFM 0·98 ,0·0001 0·99 ,0·0001
TBW – FM 0·66 0·006 0·71 0·001
* For details of procedures see p. 155.
. IP address:
118.70.52.165
, on
24 Jun 2021 at 19:26:48
, subject to the Cambridge Core terms of use, available at
https://www.cambridge.org/core/terms
.
partment model that quantifies fat, soft lean tissue and bone mineral. However, recent validation studies (Tylavsky et al. 2003; Van der Ploeg et al. 2003) underline that FFM and FM deviate from the criterion four-component model. Moreover there are still important concerns about the influence of FFM hydration variation on DXA soft tissue components estimates. Some reports consider the DXA method to be unaffected by fluid-balance changes (Going et al. 1993; Pietrobelli et al. 1996; De Lorenzo et al. 1998; Ritz, 1998) whereas other studies suggest the opposite (Horber et al. 1992; Formica et al. 1993; Pietro-belli et al. 1998; Speakman et al. 2001). In this context, FM and FFM for the subjects in the present study have also been estimated by DXA using a Hologic QDR 4500 A (whole body 5.55 software version; Hologic, Inc., Zaventem, Belgium). Unlike for BIA, no correlation could be found between TBW and FM changes. These findings are consistent with previous in vitro and in vivo studies. Going et al. (1993) also reported that, in human subjects, FM results assessed by DXA did not change significantly after both oral water ingestion and dehy-dration of 1·5 litres while 98 % of FFM variation was explained by water change. For the same magnitude of TBW variation as in the present study, Pietrobelli et al. (1996) did not find a significant change of FM results in subtracting 1 kg of extracellular fluid to the phantom (refer-ence man). Our results are also in line with a previous study using a DXA hydration model (Pietrobelli et al. 1998). These authors demonstrated that the magnitude of DXA fat errors was small (, 1 %) with hydration changes of 1 – 5 % which are similar to the present experimental conditions (the range of water variation observed was 2 2·5 to þ 6·5 %). These preliminary results indicate that DXA could be less influenced by hydration status changes than BIA for FFM and FM assessment. However this hypothesis needs further investigation using comparison with the criterion four-compartment model before validat-ing this method for body composition assessment under these conditions.
In conclusion, the present study has practical impli-cations because the results demonstrate that BIA may be
a useful method for estimating TBW variation if
equilibrium between the fluid compartments has been reached and electrolyte concentrations are unchanged. However BIA is not a valid technique for assessing body composition when hydration status, FFM and FM do sim-ultaneously vary.
Acknowledgements
The authors thank the subjects for their contribution. They would also like to thank Michel Vermorel (INRA, Theix Clermont-Ferrand, France), and Bruno Melin and Nathalie Koulmann (CRSSA) for their critical review of the manu-script. The authors are grateful to Philip P. Foster for his critical reading of the manuscript and advising on some statistical aspects. The present study was supported by a grant from ‘La socie´te´ des eaux d’Evian-Volvic’.
References
Ballor DB (1996) Exercice training and body composition
changes. In Human Body Composition, pp. 287 – 304
[AF Roche, SB Heymsfield and TM Lohman, editors]. Cham-paign, IL: US Human Kinetics.
Baumgartner RN, Chulmea WC & Roche AF (1990) Bioelectric impedance for body composition. Exerc Sport Sci Rev 18, 193 – 224.
Caton JR, Mole´ PA, Adams WC & Heustis DS (1988) Body com-position analysis by biolectrical impedance: effect of skin tem-perature. Med Sci Sports Exerc 20, 489 – 491.
Culebras JM & Moore FD (1977) Total body water and the exchangeable hydrogen. I. Theoretical calculation of nonaqu-eous exchangeable hydrogen in man. Am J Physiol 232, 54 – 59. De Lorenzo A, Sorge SP, Iacopino L, Andreoli A, de Luca PP & Sasso GF (1998) Fat-free mass by bioelectrical impedance versus dual-energy X-ray absorptiometry. Appl Radiat Isot 49, 739 – 741.
Dohm GL, Tapescott EB & Kasperek GJ (1987) Protein degra-dation during endurance exercise and recovery. Med Sci Sports Exerc 19, 166 – 171.
Fellmann N, Bedu M, Boudet G, et al. (1992) Inter-relationships between pituitary-adrenal hormones and catecholamines during a 6-day Nordic ski race. Eur J Appl Physiol 64, 258 – 265. Fellmann N, Ritz P, Ribeyre J, Beaufre`re B, Delaıˆtre M & Coudert J (1999) Intracellular hyperhydration induced by a 7-day endurance race. Eur J Appl Physiol 80, 353 – 359. Formica C, Atkinson MG, Nyulasi I, McKay J, Heale W &
Seeman E (1993) Body composition following hemodialysis: studies using dual-energy X-ray absorptiometry and bioelectri-cal impedance analysis. Osteoporosis 3, 192 – 197.
Going SB, Masset MP, Hall MC, et al. (1993) Detection of small changes in body composition by dual-energy X-ray absorptio-metry. Am J Clin Nutr 57, 845 – 850.
Gudivaka R, Schoeller D & Kushner RF (1996) Effect of skin temperature on multifrequency bioelectrical impedance anal-ysis. J Appl Physiol 87, 1087 – 1096.
Horber FF, Thomi F, Casez JP, Fonteille J & Jager P (1992) Impact of hydration status on body composition as measured by dual energy X-ray absorptiometry in normal volunteers and patients on haemodialysis. Br J Radiol 65, 895 – 900. Kushner RF & Schoeller DA (1986) Estimation of total body
water by biolectrical impedance analysis. Am J Clin Nutr 44, 417 – 424.
Lemon PWR & Proctor DN (1991) Protein intake and athletic performance. Sports Med 12, 313 – 325.
Lukaski HC, Johnson PE, Bolonchuk WW & Lykken GI (1985) Assessment of fat-free mass using bioelectrical impedance measurements of the human body. Am J Clin Nutr 41, 810 – 817. Milledge JS, Bryson EI, Catley DM, et al. (1982) Sodium bal-ance, fluid homeostasis and the renin-aldosterone system during the prolonged exercise of hill walking. Clin Sci 62, 595 – 604.
O’Brien C, Young AJ & Sawka MN (2002) Bioelectrical impe-dance to estimate changes in hydration status. Int J Sports Med 23, 361 – 366.
Pietrobelli A, Formica C, Wang Z & Heymsfield SB (1996) Dual-energy X-ray absorptiometry body composition model: review of physical concept. Am J Physiol 271, 941 – 951.
Pietrobelli A, Wang Z, Formica C & Heymsfield SB (1998) Dual-energy X-ray absorptiometry: fat estimation errors due to variation in soft tissue hydration. Am J Physiol 274, 808 – 816.
Rees AE, Ward LC, Cornish BH & Thomas BJ (1999) Sensitivity of multiple frequency bioelectrical impedance analysis to changes in ion status. Physiol Meas 20, 349 – 362.
. IP address:
118.70.52.165
, on
24 Jun 2021 at 19:26:48
, subject to the Cambridge Core terms of use, available at
https://www.cambridge.org/core/terms
.
Ritz P (1998) Methods of assessing body water and body compo-sition. In Hydration Throughout Life, pp. 63 – 74 [MJ Arnaud, editor]. Montrouge, France: John Libbey Eutotext.
Ritz P, Johnson PG & Coward WA (1994) Measurements of2H
and 18O in body water: analytical considerations and physio-logical implications. Br J Nutr 72, 1 – 10.
Roos AN, Westendorp RGJ, Fro¨lich M & Meinders AE (1992) Tetrapolar body impedance is influenced by body posture and plasma sodium concentration. Eur J Clin Nutr 46, 53 – 60. Schoeller DA, Van Santen E & Peterson DW (1980) Total body
water measurement in humans with18O and2H labeled water. Am J Clin Nutr 33, 2688 – 2693.
Speakman JR, Booles D & Butterwick R (2001) Validation of dual
energy X-ray absorptiometry (DXA) by comparison
with chemical analysis of dogs and cats. Int J Obes 25, 439 – 447. Tylavsky F, Lohman T, Blunt BA, et al. (2003) QDR 4500A
DXA overestimates fat-free mass compared with criterion methods. J Appl Physiol 94, 959 – 965.
Vache´ C, Rousset P, Gachon P, et al. (1998) Bioelectrical impe-dance analysis measurements of total body water and extra-cellular water in healthy elderly subjects. Int J Obes 22, 537 – 543.
Van der Ploeg GE, Withers RT & Laforgia J (2003) Percent body fat via DEXA: comparison with a four-compartment model. J Appl Physiol 94, 499 – 506.
Williams ES, Ward MP, Milledge JS, Withey WR & Older M (1979) Effect of the exercise of seven consecutive days hill-walking on fluid homeostasis. Clin Sci 56, 305 – 316.
Wong WW, Lee LS & Klein PD (1987) Oxygen isotope ratio measurements on carbon dioxide generated by reaction of microliter quantities of biological fluids with guanidine hydro-chloride. Anal Chem 59, 690 – 693.
. IP address:
118.70.52.165
, on
24 Jun 2021 at 19:26:48
, subject to the Cambridge Core terms of use, available at
https://www.cambridge.org/core/terms
.