CLINICAL INVESTIGATION
Multimodal imaging in macular diagnostics: combined
OCT-SLO improves therapeutical monitoring
Christian Karl Brinkmann&Sebastian Wolf&
Ute Ellen Kathrin Wolf-Schnurrbusch
Received: 12 December 2006 / Revised: 26 June 2007 / Accepted: 2 July 2007 / Published online: 3 August 2007 # Springer-Verlag 2007
Abstract
Background Digital imaging methods are a centrepiece for diagnosis and management of macular disease. A recently developed imaging device is composed of simultaneous confocal scanning laser ophthalmoscopy (SLO) and optical coherence tomography (OCT). By means of clinical samples the benefit of this technique concerning diagnostic and therapeutic follow-up will be assessed.
Methods The combined OCT-SLO-System (Ophthalmic Technologies Inc., Toronto, Canada) allows for confocal en-face fundus imaging and high resolution OCT scanning at the same time. OCT images are obtained from transversal line scans. One light source and the identical scanning rate yield a pixel-to-pixel correspondence of images. Three-dimensional thickness maps are derived from C-scan stacking.
Results We followed-up patients with cystoid macular edema, pigment epithelium detachment, macular hole, venous branch occlusion, and vitreoretinal tractions during their course of therapy. The new imaging method illustrates the reduction of cystoid volume, e.g. after intravitreal injections of either angiostatic drugs or steroids. C-scans are used for appreciation of lesion diameters, visualisation of pathologies involving the vitreoretinal interface, and quantification of retinal thickness change.
Conclusion The combined OCT-SLO system creates both topographic and tomographic images of the retina. New therapeutic options can be followed-up closely by observ-ing changes in lesion thickness and cyst volumes. For clinical use further studies are needed.
Keywords Combined OCT-SLO . En-face imaging . C-scan OCT . Pixel-to-pixel correspondence . 3D retinal maps
Introduction
In complex retinal disease more than one imaging method is often employed [1]. Combination and fusion of different imaging modalities leads to an increase in comprehensive diagnostics. A device that features both tomographic and topographic imaging seems useful for therapy monitoring in retinal disease.
Tomographic retinal imaging is provided by optical coherence tomography (OCT). It is a noninvasive method to assess the posterior pole of the human eye. It was first introduced to the clinical routine during the 1990s [9]. OCT is derived from the optical interference between a sample light beam (the patient’s eye) and a reference beam of light. From the interference of both beams a reflectivity pattern along the sagittal axis is calculated (A-scan). From subsequent A-scans a two-dimensional B-scan is generated depicting a virtual cross section of the human retina. The utilisation of super-luminescent diodes allows for a depth resolution of 10–15 microns [2]. OCT renders possible the analysis of the morphology and the assessment of structural change within the retina.
DOI 10.1007/s00417-007-0655-9
Contents of this article were presented at DOG 2006 in Berlin. The authors do not have any proprietary interest in this study. C. K. Brinkmann
:
S. Wolf (*):
U. E. K. Wolf-Schnurrbusch Klinik und Poliklinik für Augenheilkunde,Inselspital, Universität Bern, Freiburgstrasse,
3010 Bern, Switzerland e-mail: [email protected]
Topographic retinal imaging is provided by scanning laser ophthalmoscopy (SLO), which was described in ophthalmologic use in the 1980s [10]. The retinal surface is rastered by a laser beam in a grid pattern. Reflected beams pass through a confocal aperture system bound to reach a photodetector; this way light scattering is reduced to minimal amounts. The detected beams are used for generating high resolution en-face images of the fundus [14]. These images are used for assessment of topographic detail and tracking of pathological change.
Both imaging modalities have been considered comple-mentary thus far [11]. However, it is the combination of both devices (OCT and SLO) that seems to offer profound insights and may be valuable for therapeutical follow-up. We will herein demonstrate a selection of images obtained with a novel combined OCT-SLO system. The system offers unconventional imaging angles, overlaying techni-ques, and quantitative analysis options. This may increase our knowledge of the structure and function of the macular area in health and disease.
Material and methods
The newly combined OCT-SLO system (Ophthalmic Tech-nologies Inc., Toronto, Canada) makes use of a partially coherent superluminescent diode with a wavelength of 820 nm. The method was developed by Podoleanu et al. [7,
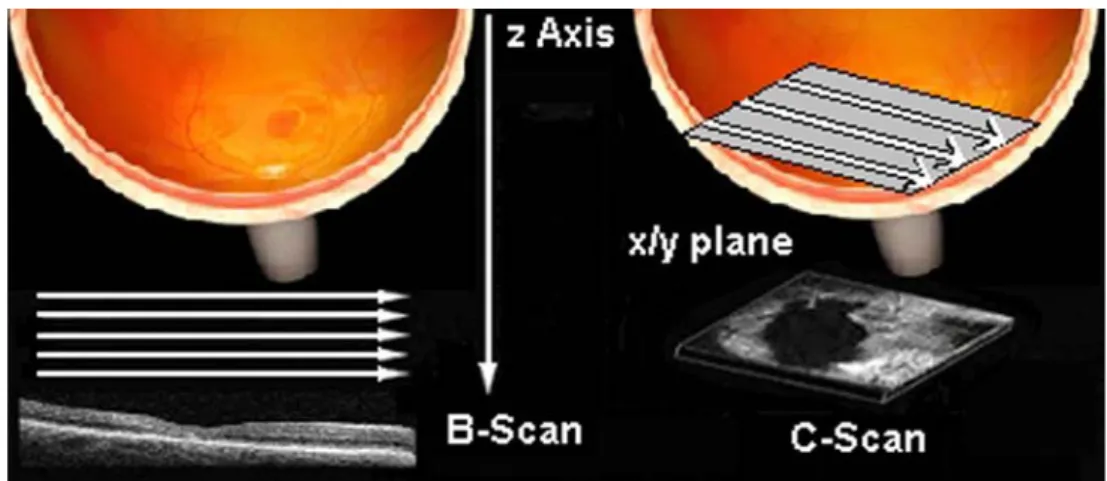
8] and has been described in prototype use [13]. A portion of the sample light beam (the patient’s eye) from OCT is conveyed via a confocal aperture system to a photodetector. The photodetector then generates an SLO image. The OCT-SLO system produces B-scans with a frequency of 2 Hz by transversal line scanning. The scanning depth is modified along the sagittal axis (z axis). Transversal raster shaped scanning at a fixed sagittal axis (z axis) yields an OCT scan in the coronal plane (x,y plane). The resulting images show coronal cross sections of the posterior pole, so-called C-scans (Fig.1). As the same light source is employed for both modalities, there is a pixel-to-pixel correspondence between both imaging channels [6]. This combination enables integrative assessment of the retina concerning topography
Fig. 1 Transversal line scanning in different scanning depths along the sagittal axis (z axis) yields B-scan OCT. Transversal raster-shaped scanning at a fixed sagittal axis (z axis) in the x,y plane yields coronal C-scan OCT
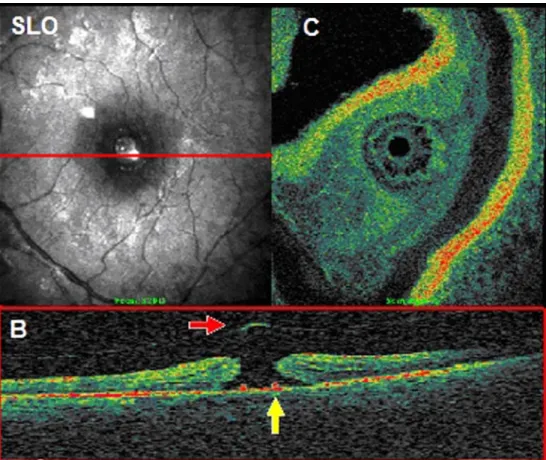
Fig. 2 Multiplanar imaging by combining optical coherence tomog-raphy (OCT) and scanning laser ophthalmoscopy (SLO). The en-face confocal SLO image (SLO) corresponds pixel-to-pixel (indicated by
asterisk) to each C-scan OCT (OCT-C). The red line indicates the orientation of the B-scan OCT (OCT-B) on the simultaneously acquired SLO image
and morphology. The imaging method is multiplanar, i.e. scanning of more than one plane can be obtained from a single examination (Fig. 2). OCT scans become directly allocatable on the retinal surface. The en-face superficial view of the SLO channel can also be used for tracking small lesions or assessment of lesion extent. In cases of gross alterations, e.g. resulting from retinal vein occlusion, the major vascular arcades seen on the SLO may still serve as reference points for OCT rescanning.
C-scanning is rather new and not yet widely used by OCT examiners. The coronal cross-sections depict each retinal layer, and two hyperreflective layers are the inner limiting membrane on the inside and the pigment epithe-lium on the outside. As the imaging proceeds at a few seconds into the depth of the posterior pole the retina has a fragmented appearance [8]. Sagittal (z axis) resolution of the system is≤10 μm, and transversal (x or y) resolution is approximately 20 μm; therefore, resolution is similar to conventional and commercially available OCT systems (e.g. Zeiss Stratus OCT 3). However, by preserving lateral cohesion, transversal scanning results in a subjectively higher resolution. This enables search for small pathologies, especially on C-scans. The depth resolution also allows for thorough evaluation of the vitreo-retinal interface. This is
important for learning about the pathogenesis of pucker membranes, tractional force, and macular holes. The maximum energy immission on the corneal level is less than 750μW. This is less than the energy commonly used in fundus photography. The patient does not require any special preparation for the measurement, and the machine setup is similar to other OCT devices. One complete measurement session takes approximately 10 minutes. The patients’ informed consent was a prerequisite to all our OCT-SLO measurements.
Measurement of retinal thickness is of high priority in the management of macular diseases such as age-related macular degeneration or cystoid macular edema in dia-betics. Thus far, retinal thickness maps have mostly been obtained from interpolation of six radial B-scan OCTs [4]. Conventional methods do not provide a channel for allocation of such radial scans. The OCT-SLO computes thickness maps from 240 stacks of subsequently aligned C-scans in a 10°×10° macular area subfield. The fast stacking mode takes approximately 2 seconds. The stacks are overlain by guidance of the SLO image. This allows for construction of 3D retinal profiles [6]. Retinal thickness is calculated as the space between the delineated retinal surface and the pigment epithelium.
Fig. 3 Full thickness macular hole lesion extent is displayed on the en-face confocal image (SLO); the C-scan (C) reveals a rosette of cystoid spaces sur-rounding the defect. Note that the hypodense space (upper right corner, C) accounts for the vitreous and results from the bulbar curvature and tilts in the C-scan plane. High resolution B-scan (B) depicts the opercu-lum (red arrow) suspended from posterior vitreous detachment and irregularities of the pigment epithelium on the ground of the hole (yellow arrow)
Results
We surveyed 300 patients with the new device between March and August 2006. All patients were seen during regular clinical routine. The following cases show samples of macular disease as assessed by OCT-SLO.
Macular hole
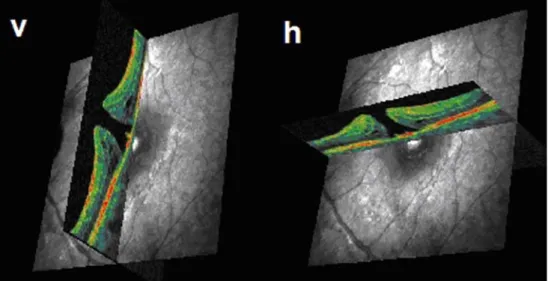
We examined a 54-year-old female patient complaining of visual loss and metamorphopsia due to macular hole. The en-face SLO image and the corresponding C- and B-scan images are shown in Fig. 3. The confocal en-face view resembles the familiar ophthalmoscopic aspect of a macular hole. The C-scan image clearly depicts a rosette-shaped gathering of cysts around the hole and its extent in full diameter. The B-scan image shows a cross section of a full-thickness macular hole and pigment epithelium irregulari-ties on the bottom of the hole. An operculum is also
depicted. The exact allocatability of each scan is demon-strated in Fig.4, where two perpendicular B-scans are taken from the hole by selectively placing them on each simultaneously produced SLO image (Fig. 4).
Cystoid macular edema
The C-scan of a 67-year-old patient with cystoid macular edema due to diabetic retinopathy is shown in Fig. 5. The en-face image indicates the extent of the retinal lesion. The corresponding C-scan offers an insight into the underlying structure: the edema seems to buckle part of the fovea for-ward and contains multiple cystoid spaces within the struc-tural context. Perifoveally the retina is not buckled forward; here, the hypodensity displays a cross section of the vitreous. C-scan OCT provides an estimate of the number and the size of the cavities. B-scan OCT following the commonly used cross-hair protocol (i.e. two B-scans intersecting on the fovea), would not necessarily render this information.
Fig. 4 Exact allocation of each B-scan optical coherence to-mography (OCT) to the retinal surface displayed on the scan-ning laser ophthalmoscopy (SLO) channel. Two perpendic-ular B-scans (v, h) intersect in the centre of a full thickness macular hole
Fig. 5 C-scan optical coherence tomography (OCT) (C) adds a 3D aspect to the lesion seen on the confocal scanning laser ophthalmoscopy (SLO) image (SLO). The macular edema buckles part of the retina for-ward. The coronal cross-section (C) also displays the amount of cystoid cavities
Therapeutical follow-up after intravitreal injections
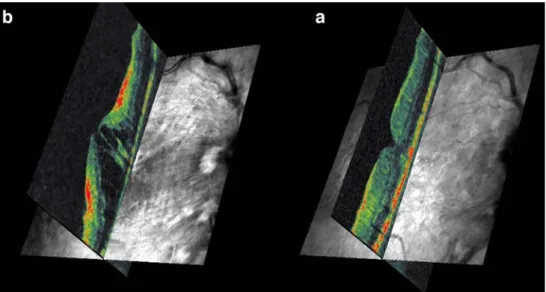
The above-mentioned patient with cystoid macular edema was treated with two consequent intravitreal injections of bevacizumab (Avastin, 1.25 mg). Figure 6 depicts the restitution of the foveal contour and vanishing of the cystoid lesions after two injections. As on regular B-scans, the retinal structure can be analysed. The position of the two scans is highly reproducible between two sessions due to the SLO image serving as a reference.
The efficacy of the intravitreal injective therapy can be assessed by observing changes in retinal thickness before and after the therapy. Figure 7 shows the 3D-retinal maps with different thickness values encoded in false colour. The red area elucidates macular edema (Fig. 7b) due to underlying cystoid spaces, whereas the blue and greenish tinge of the map shows restoration of normative thickness (Fig. 7a). The net change in thickness is obtained from digitally subtracting the two maps (Fig. 7a,b), which is
visualised in an analytical map. The efficacy of therapy is clearly shown in different shades of blue, here indicating the main change at the foveal centre. The efficacy is moreover directly quantified by calculating an average change in retinal thickness. In this case thickness is reduced by 234 μm. The retinal thickness maps presented here do not use any interpolative data. Each pixel accounts for one measuring point. Thickness maps encode retinal thickness values as the space between the delineated retinal surface and the pigment epithelium. For precise measurements the right positioning of the 10° × 10° measuring area is important. Therefore, the SLO channel can be of aid. Side shifts show up as edge overlaps on the net change map (Fig. 7a,b).
Pigment epithelium detachment
This is a case of a 73-year-old male suffering from sudden onset of exudative age-related macular degeneration. In
Fig. 6 Follow-up on cystoid macular edema before (b) and after (a) two intravitreal injec-tions of bevacizumab (Avastin, 1.25 mg). Considerable inter-session scanning reproducibility results from exact positioning of each B-scan optical coherence tomography (OCT) led by the scanning laser ophthalmoscopy (SLO) channel
Fig. 7 200 subsequent C-scan optical coherence tomography (OCT) stacks produce actual retinal thickness maps without data interpola-tion. False colour 3D thickness maps illustrate the size of the macular
edema before therapy (b) and its resolution afterwards (a). The analytical thickness map results from subtraction (a–b)
Fig.8 we demonstrate how different scanning depths alter the aspect of C-scans: the coloured lines on the B-scan correspond to the matching C-scans above. The first scan (red) reveals minute cystoid spaces within the retinal layers, which lie on top of an ample pigment epithelium detachment. The spacious hypodensity indicating serous fluid causes the epithelium to detach. This can clearly be seen on the following C-scans (blue, green). There is also an accumulation of subretinal fluid adjacent to the detachment, probably resulting from stretching of the retina.
Venous branch occlusion
This 76-year-old male patient was treated with one intra-vitreal injection of triamcinolone (Kenacort, 4 mg) because of venous branch occlusion. We monitored the reduction of edematous thickening and cystoid intraretinal lesions after therapy, as seen on the C-scan. At baseline the SLO image (Fig. 9, SLO b) depicted enough landmarking vasculature to almost precisely rescan the same area after therapy. While intraretinal edema resolved, the retinal blood vessels once again became clearly visible on the confocal fundus image (Fig.9, SLO a). Both images, C-scan OCT and SLO, display the restorative effect of the triamcinolone therapy.
Vitreomacular traction syndrome
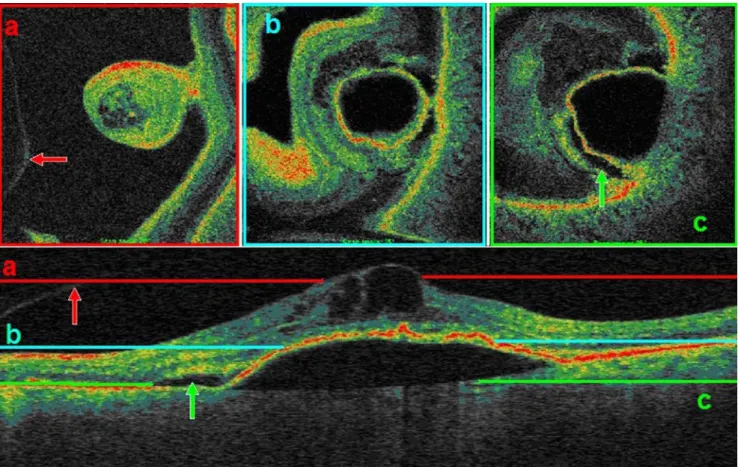
The scans shown in Fig.10were obtained from a 65-year-old female suffering from vitreomacular traction syndrome. The display of tractional force seen on the B-scan (green arrow) can also be traced on the corresponding C-scan. The C-scan reveals the circular insertion of the traction on the macula. The retinal surface consequently has acquired a rippled or“sulcate” appearance (red arrow).
Discussion
The novel SLO-OCT system offers multimodal imaging: we have shown the versatility in picking up and tracing a wide range of retinal disorders including cystoid macular edema, pigment epithelium detachment, macular hole, venous branch occlusion, and macular pucker, among many others [3, 5, 12]. The OCT-SLO system is pixel-to-pixel correspondent: the macular area can be assessed regarding topography and tomography at the same time. The high resolution of the corresponding imaging modalities allows for allocation of B-scan images in any desired position on the confocal en-face image [6]. The transversal line
Fig. 8 Different scanning depths of C-scan OCT reveal different lesion features. a Cystoid cavities and bordering vitreous (red arrow). b Tip of the pigment epithelium detachment. c Near to base diameter of the detachment and adjacent subretinal fluid accumulation (green arrow)
scanning preserves the lateral connections between the points better than combined sagittal scanning used for conventional B-scan OCT. In today’s clinical routine OCT has become a widely used device (e.g. Zeiss Stratus OCT 3). However, it is difficult to accurately rescan the same
anatomical location of the retina from one session to another. Reproducibility is thus limited to patients with good central fixation capabilities. Conventional OCT is therefore useful in already confirmed disease and its follow-up [1]. Large cystoid spaces, e.g. those which can be
Fig. 9 Venous branch occlusion causing diffuse edema (SLO b) with cystoid components (corresponding C-scan OCT, C b). Clear visibility of retinal vessels (SLO a) after one intra-vitreal injection of triamcinolone (Kenacort, 4 mg), the C-scan (C a) indicates retinal smoothing
Fig. 10 Vitreomacular traction syndrome. Green arrows point at the vitreous adhesions to the fovea on the B- and C-scan (B, C). The red arrow shows the rippled retinal surface seen on both scan types. The lower left corner image (B) indicates the B-scan allocation
spotted on B-scans as hyporeflective zones, for small structural changes en-face imaging, as in the combined OCT-SLO system, seem to offer more detective opportunity [13]. The SLO image resembles the“map to a treasure”, on which the“treasure” (small lesion seen on OCT) can easily be found and analyzed. Also, the expanse of the lesion can be assessed once an en-face image is provided. The example of a macular hole (Fig. 3) unveils that there are large amounts of cystoid lesions encircling the defect. Van Velthoven et al. postulate that imaging techniques depend largely on pattern recognition [13]. For future use of C-scanning it will be necessary to describe and establish certain characteristic features of macular disorders such as the cystoid rosette around a full thickness hole or the wrinkling pattern in vitreoretinal tractions (Fig.10). As C-scanning does not compensate for the curvature of the eye, different retinal layers are imaged at each coronal slice. Each frame can be taken for a virtual histologic section through the posterior pole perpendicular to the optical axis. When interpreting C-scans it is important to look at the whole amount of scanning made into depth. This process however is facilitated by the adherent“sister” SLO image that provides orientation due to retinal blood vessels and other distinct landmarks [3,13]. Concerning retinal thick-ness measurements, 3D maps derived from C-scanning seem to be more precise than interpolative maps from six radial B-scans because each pixel on the map accounts for a certain thickness value [4, 13]. Correlation studies to estimate systemic measurement differences between the OCT 3 and the SLO-OCT are yet to be performed. The 3D maps offer a new aspect to therapeutical follow-up of mac-ular disease, i.e. by digitally subtracting two three-dimen-sional thickness maps one can quantify the amount of retinal thickness change. This seems a useful tool, for example, in the management of cystoid macular edema when treated with intravitreal antiangiogenetic drugs or steroids. However, the currently used stacking protocol of 240 subsequent C-scans is not free from error. First, the 10°×10° macular subfield may not cover the whole extent of a lesion. Second, the acquisition speed of 2 second may lead to motion artefacts. Third, misalignment between the two images may lead to error. Further development, e.g. spectral domain scanning introduced to the combined OCT-SLO, could solve this problem by propelling imaging speed. Like in many samples of multimodal imaging [1] the novel OCT-SLO system appears to offer unique
perspec-tives and insights that are expected to contribute to improved diagnosis and better understanding of macular disease. Reproducibility and interchangeability with the commonplace employed OCT 3 devices should be evalu-ated. For broad clinical use, further studies need to be performed.
References
1. Bernardes R, Lobo C, Cunha-Vaz JG (2002) Multimodal macula mapping—a new approach to study diseases of the macula. Surv Ophthalmol 6:580–589
2. Drexler W (2004) Ultrahigh-resolution optical coherence tomog-raphy. J Biomed Opt 1:47–74
3. Forte R, Pascotto F, de Crecchio G (2006) Visualization of vitreomacular tractions with en face optical coherence tomogra-phy. Eye DOI10.1038/sj.eye.6702448
4. Hee MR, Puliafito CA, Duker JS, Reichel E, Coker JG, Wilkins JR, Schuman JS, Swanson EA, Fujimoto JG (1998) Topography of diabetic macular edema with optical coherence tomography. Ophthalmology 2:360–370
5. Koizumi H, Iida T, Maruko I (2006) Morphologic features of group 2A idiopathic juxtafoveolar retinal telangiectasis in three-dimensional optical coherence tomography. Am J Ophthalmol 2:340–343
6. Podoleanu AG, Dobre GM, Cucu RG, Rosen R, Garcia P, Nieto J, Will D, Gentile R, Muldoon T, Walsh J, Yannuzzi LA, Fisher Y, Orlock D, Weitz R, Rogers JA, Dunne S, Boxer A (2004) Combined multiplanar optical coherence tomography and confo-cal scanning ophthalmoscopy. J Biomed Opt 1:86–93
7. Podoleanu AG, Dobre GM, Cucu RG, Rosen RB (2004) Sequential optical coherence tomography and confocal imaging. Opt Lett 4:364–366
8. Podoleanu AG, Rogers JA, Jackson DA (1999) OCT en face images from the retina with adjustable depth resolution in real time. J Sel Top Quantum Electron 4:1176–1184
9. Puliafito CA, Hee MR, Lin CP, Reichel E, Schuman JS, Duker JS, Izatt JA, Swanson EA, Fujimoto JG (1995) Imaging of macular diseases with optical coherence tomography. Ophthalmology 2:217–229
10. Sharp PF, Manivannan A (1997) The scanning laser ophthalmo-scope. Phys Med Biol 5:951–966
11. Sharp PF, Manivannan A, Xu H, Forrester JV (2004) The scanning laser ophthalmoscope—a review of its role in bioscience and medicine. Phys Med Biol 7:1085–1096
12. van Velthoven ME, Verbraak FD, Garcia PM, Schlingemann RO, Rosen RB, de Smet MD (2005) Evaluation of central serous retinopathy with en face optical coherence tomography. Br J Ophthalmol 11:1483–1488
13. van Velthoven ME, Verbraak FD, Yannuzzi LA, Rosen RB, Podoleanu AG, de Smet MD (2006) Imaging the retina by en face optical coherence tomography. Retina 2:129–136
14. Webb RH, Hughes GW, Delori FC (1987) Confocal scanning laser ophthalmoscope. Appl Opt 26:1492–1499