HAL Id: hal-02947741
https://hal.archives-ouvertes.fr/hal-02947741
Submitted on 24 Sep 2020
HAL is a multi-disciplinary open access
archive for the deposit and dissemination of
sci-entific research documents, whether they are
pub-lished or not. The documents may come from
teaching and research institutions in France or
abroad, or from public or private research centers.
L’archive ouverte pluridisciplinaire HAL, est
destinée au dépôt et à la diffusion de documents
scientifiques de niveau recherche, publiés ou non,
émanant des établissements d’enseignement et de
recherche français ou étrangers, des laboratoires
publics ou privés.
Pulse pressure and end-tidal carbon dioxide for
monitoring low native cardiac output during
veno-arterial ECLS: a prospective observational study
Marc Mourad, Jacob Eliet, Norddine Zeroual, Marine Saour, Pierre Sentenac,
Federico Manna, Nicolas Molinari, Thomas Gandet, Pascal Colson, Philippe
Gaudard
To cite this version:
Marc Mourad, Jacob Eliet, Norddine Zeroual, Marine Saour, Pierre Sentenac, et al.. Pulse pressure
and end-tidal carbon dioxide for monitoring low native cardiac output during veno-arterial ECLS: a
prospective observational study. Critical Care, BioMed Central, 2020, 24 (1), pp.569.
�10.1186/s13054-020-03280-z�. �hal-02947741�
R E S E A R C H
Open Access
Pulse pressure and end-tidal carbon
dioxide for monitoring low native cardiac
output during veno-arterial ECLS: a
prospective observational study
Marc Mourad
1*, Jacob Eliet
1, Norddine Zeroual
1, Marine Saour
1, Pierre Sentenac
1, Federico Manna
2,
Nicolas Molinari
2, Thomas Gandet
3, Pascal H. Colson
1,4†and Philippe Gaudard
1,5†Abstract
Background: Veno-arterial extracorporeal life support (VA-ECLS) results in cardiopulmonary shunting with reduced native cardiac output (NCO). Low NCO occurrence is common and associated with risk of thromboembolic and pulmonary complications. Practical tools for monitoring NCO during VA-ECLS would therefore be valuable. Pulse pressure (PP) and end-tidal carbon dioxide (EtCO2) are known to be related to cardiac output. We have designed a
study to test whether PP and EtCO2were efficient for the monitoring of NCO during VA-ECLS.
Methods: In this prospective single-center observational study, patients who underwent a VA-ECLS for cardiogenic shock from January 2016 to October 2017 were included, provided low NCO was suspected by a PP < 20 mmHg. NCO was measured with pulmonary artery catheter or echocardiography and compared to PP and EtCO2. The
ability of PP and EtCO2to predict NCO < 1 L/min was evaluated with receiver operating characteristics (ROC) curves.
Results: Among the 106 patients treated with VA-ECLS for cardiogenic shock during the study period, 26 were studied, allowing the collection of 196 study points. PP and EtCO2relationships with NCO were nonlinear and
showed strong correlations for NCO < 2 L/min (r = 0.69 and r = 0.78 respectively). A PP < 15 mmHg and EtCO2< 14
mmHg had good predictive values for detecting NCO < 1 L/min (area under ROC curve 0.93 [95% CI 0.89–0.96] and 0.97 [95% CI 0.94–0.99] respectively, p = 0.058).
Conclusions: PP and EtCO2may offer an accurate real-time monitoring of low NCO events during VA-ECLS
support. Further studies are needed to show if their utilization may help to implement therapeutic strategies in order to prevent thromboembolic and respiratory complications associated with VA-ECLS, and to improve patients’ prognosis.
Trial registration:NCT03323268, July 12, 2016
Keywords: Cardiogenic shock, VA-ECLS support, EtCO2, Pulse pressure
© The Author(s). 2020 Open Access This article is licensed under a Creative Commons Attribution 4.0 International License, which permits use, sharing, adaptation, distribution and reproduction in any medium or format, as long as you give appropriate credit to the original author(s) and the source, provide a link to the Creative Commons licence, and indicate if changes were made. The images or other third party material in this article are included in the article's Creative Commons licence, unless indicated otherwise in a credit line to the material. If material is not included in the article's Creative Commons licence and your intended use is not permitted by statutory regulation or exceeds the permitted use, you will need to obtain permission directly from the copyright holder. To view a copy of this licence, visithttp://creativecommons.org/licenses/by/4.0/. The Creative Commons Public Domain Dedication waiver (http://creativecommons.org/publicdomain/zero/1.0/) applies to the data made available in this article, unless otherwise stated in a credit line to the data.
* Correspondence:m-mourad@chu-montpellier.fr
†Pascal H. Colson and Philippe Gaudard contributed equally to this work. 1Department of Anesthesiology and Critical Care Medicine, Arnaud de
Villeneuve Hospital, CHU Montpellier, Univ Montpellier, Montpellier, France Full list of author information is available at the end of the article
Introduction
Peripheral veno-arterial extracorporeal life support (VA-ECLS) for severe acute cardiac failure is increasingly used in patients with refractory cardiogenic shock (CS) or persistent cardiac arrest, either as a bridge to myocar-dial recovery, or to cardiac transplantation, or to long-term mechanical circulatory support [1–3]. However, although it provides good circulatory assistance, VA-ECLS has anti-physiological hemodynamic conse-quences, mainly, bypass of pulmonary circulation and backflow into the aorta. Indeed, VA-ECLS diverts venous return from the right atrium, reducing right ventricle pre-load, and returns blood into the aorta, in-creasing left ventricle (LV) afterload. It results in a proportional reduction of the pulmonary blood flow generated by the right and left ventricles (so-called, na-tive cardiac output, NCO). Many adverse hemodynamic effects of VA-ECLS are related to these anti-physiological effects such as LV distension, pulmonary edema, and blood stasis in the pulmonary artery, cardiac chambers, or aortic root with high risk of thrombosis [4–6]. Moreover, low NCO during ECLS can induce sig-nificant pulmonary lesions and may be prevented by maintaining 25% of the systemic cardiac output through the pulmonary artery [7].
To overcome these drawbacks, current practices con-sist in tracking pulmonary edema, LV distension with spontaneous echo contrast (SEC), and aortic valve open-ing, mainly with repeated echocardiography exams [8]. Patients may then benefit from LV venting techniques to avoid the most serious complications [9–13]. The pri-mary aim of venting techniques is LV discharge and pre-vention of pulmonary edema. Various techniques are proposed, with small differences in efficacy [14]. They differ in their ability to maintain or regulate NCO, but comparative data are not currently available. Therefore, monitoring NCO during VA-ECLS seems desirable to prevent the related complications. NCO is usually assessed by pulmonary artery catheter (PAC) with ther-modilution measurement of right ventricle output, as-suming the coupling of right and left ventricles results in the same output for both sides, and provided there is no left/right shunt. However, the technique is invasive and less reliable when cardiac output is low [15, 16]. Echocardiography is the alternative technique, either by directly measuring pulmonary artery flow (but this needs direct access to the pulmonary valve which is better viewed by trans-esophageal echocardiography) or by evaluating LV outflow by Doppler through the aortic valve (which can be obtained by transthoracic echocardi-ography). Nevertheless, whatever the echography tech-nique, it cannot be considered as a monitoring technique. Often, the pulse pressure (PP) measured from the arterial line is used as a surrogate to assess NCO,
but no study has yet addressed the issue of how much PP is sufficient. Similarly, end-tidal carbon dioxide (EtCO2) follows changes in cardiac output, provided
CO2production and removal are stable [17, 18]. In this
respect, we recently observed a good correlation between EtCO2and NCO in patients on VA-ECLS submitted to
gradual increases of left-sided Impella assistance. The EtCO2increase correlated quite well with the increased
NCO assessed by echocardiography Doppler [19]. Based on these observations, we designed this study in order to assess the performance of PP and EtCO2 in
evaluating NCO, and their accuracy to detect NCO below 1 L/min during VA-ECLS.
Materials and methods Study design
This is a prospective, observational, cohort study, ap-proved by our institutional review board (CPP Sud Mediterranée 1; ID RCB: 2015-A02006-43). Informed consent was obtained from all patients or their surrogates. The trial was retrospectively registered on
Clinicaltrials.govon July 12, 2016 (NCT03323268).
Settings
The study was conducted in our tertiary hospital inten-sive care unit (ICU) from January 2016 to October 2017. Observations were recorded within the first 48 h after VA-ECLS implantation and up to 5 days after.
Participants
All consecutive VA-ECLS patients admitted to our ICU during the study period were prescreened. Only the pa-tients who experienced a PP < 20 mmHg were eligible, assuming the fact that PP < 20 mmHg could be consid-ered, a priori, as a marker of low NCO. Patients were in-cluded if PAC was available. All inin-cluded patients were followed afterwards over a maximum of 5 days, during which monitoring allowed several study points (see below) at various levels of NCO. Exclusion criteria in-cluded non-invasive ventilation at the time of screening, age less than 18 years, pulmonary disorders (obstructive pulmonary disease; acute respiratory distress syndrome, CS due to massive pulmonary embolism); intra-cardiac shunt (atrial or ventricular communication), and signifi-cant tricuspid or pulmonary valve disease. Left ventricu-lar assist device (VAD) was not considered as exclusion criteria whenever VAD outflow was < 1.5 L/min.
VA-ECLS consisted of polyvinyl chloride tubing with a membrane oxygenator (PH.I.S.I.O and EOS; Sorin Group, Clamart, France), a centrifugal pump (Stockert; Sorin Group), and percutaneous or surgically inserted arterial and venous femoral cannulas (Fem-Flex and Fem-Track, Edwards Lifesciences, Guyancourt, France) with an additional 7F cannula inserted distally into the
femoral artery to prevent lower limb ischemia. An oxygen-air blender (Sechrist Industries, Anaheim, CA) ventilated the membrane oxygenator. Unfractionated heparin was administrated to maintain an anti-factor-Xa activity of between 0.2 and 0.3 IU/mL.
In the initial phase of the circulatory assistance, VA-ECLS flow was set to provide adequate tissue perfusion (mixed venous oxygen saturation measured from the distal lumen of the PAC, SVO2 ≥ 65%) and
to obtain correction of metabolic acidosis (serum lac-tate clearance). Thereafter, the VA-ECLS flow was set at the lowest rate necessary to ensure adequate tissue perfusion, while the highest NCO was wanted. Lung ventilation was managed with low levels of respiratory rate (10–14 breaths/min) and tidal volume (4–6 mL/ kg), and with a modest level of positive end-expiratory pressure (8–10 cmH2O) to ensure
protect-ive ventilation [20]. Respiratory minute ventilation and ECLS sweep gas flow were adjusted to maintain baseline PaCO2 in a normal range, of around 40
mmHg.
In the case of severe LV distension, defined by pul-monary edema and/or threatening SEC on echocardiog-raphy, LV decompression (LV venting) was realized using transient left VAD (CP or 5.0 Impella devices, Abiomed Europe GmbH, Aachen, Germany).
Outcome variables: native cardiac output, pulse pressure, and EtCO2
NCO was assessed by continuous (heated filament) ther-modilution PAC (Swan-Ganz CCOmbo® CCO/SvO2,
Edwards Lifesciences) inserted through the superior vena cava with placement confirmed by chest radiog-raphy. When NCO estimated by PAC was not possible (i.e., when the PAC monitor displayed“cardiac output < 1 L/min”), an evaluation of aortic and/or pulmonary out-flow using Doppler echocardiography (transthoracic or trans-esophageal) was performed. An NCO threshold of 1 L/min was used to define threatening NCO (Th-NCO), considering NCO < 1 L/min at the higher risk of complications.
Continuous blood pressure was monitored via a radial arterial catheter. PP was defined as systolic arterial pressure-diastolic arterial pressure and studied only in the absence of concomitant left VAD.
EtCO2 was measured noninvasively from exhaled
breath on a ventilator circuit and monitored using a ventilator CO2 analyzer (Maquet servo U, Drager Evita
Infinity V500). Moreover, the arterial-to-end-tidal car-bon dioxide (PaCO2-EtCO2) gradient was calculated as
PaCO2 − EtCO2, PaCO2 being measured from arterial
blood gas analysis (GEM4000premier®, Instrumentation Laboratory).
Data collection
The following parameters were recorded: demographic characteristics, etiology of cardiac failure, context and patient severity at VA-ECLS implantation, hemodynamic variables and circulatory support at inclusion, and clinical course during VA-ECLS and follow-up.
Concomitant measurements of NCO, PP, and EtCO2
were realized in stable condition (no change in VA-ECLS and ventilator settings, patients’ treatment includ-ing hemodynamic supports and level of sedation). These study points were aimed first at ensuring that the VA-ECLS setting was optimal and also for catching Th-NCO events. The measurements were thus repeated, up to 4 a day, until NCO became > 2 L/min. Afterward, the mea-surements were made at the operator’s discretion, at least once a day, during the time of PAC monitoring.
The following data were also collected: hemodynamic support (catecholamine infusion, inhaled nitric oxide, cardiac pacing), left VAD outflow (if present), heart rate, systemic blood pressure, pulmonary artery pressures (PAP), pulmonary arterial wedge pressure (PAWP), SvO2, ventilator and VA-ECLS settings (respiratory
mode, tidal volume, respiratory rate, positive end-expiratory pressure, plateau pressure, VA-ECLS, and sweep gas outputs), and blood gases sampled from the radial artery.
Study size
We anticipated collecting data from eligible patients until obtaining at least 50 observations of Th-NCO.
Statistical analysis
Categorical variables (expressed as absolute value and percentage) were compared using the chi-squared test. Continuous variables (expressed as median [25th–75th percentile]) were compared with Student’s t test or the Mann–Whitney U test, as appropriate according to the normality distribution assessed graphically.
The relationships of PP and EtCO2 with NCO were
assessed graphically. The relationships of pulse pressure with stroke volume and PaCO2-EtCO2 gradient with
NCO were studied to consider heart rate and PaCO2
confounders respectively. As these analyses showed non-linear links for some variables, they were fitted in a re-gression model using a cubic spline [21]. The link between variables and the effect of uneven V/Q ratios (absolute difference to 1) at lungs and ECLS membrane on the relationship between EtCO2and NCO were
stud-ied through an error prediction model (variations of model performance according toX or confounders). The NCO < 2 L/min level was identified as a cut-off value by calculating and comparing correlations from either side of several NCO levels using the weighted Spearman test and Zou’s confidence interval respectively.
The ability of PP and EtCO2 to predict Th-NCO was
evaluated with receiver operating characteristics (ROC) curves and quantified by calculating the area under the curve (AUC) and 95% CI. A Delong test was used to compare matched ROC curves. The optimal threshold to predict Th-NCO was then determined as the one that minimized the explicit cost ratio, which is equivalent to maximizing Youden’s index. Statistical significance was defined as p < 0.05. The statistical analyses were per-formed using R environment (version 3.2.2, R Founda-tion, Vienna, Austria).
Results Participants
Among the 106 patients treated with VA-ECLS during the study period, 72 presented an occurrence of PP < 20 mmHg and 26 had a PAC (Fig. 1, flowchart). Baseline patient characteristics, VA-ECLS management, and follow-up are displayed in Table1. Five patients received VA-ECLS while already on transient or durable left VAD support and 4 patients required transient left VAD for severe LV distension during VA-ECLS.
NCO measurements
Eight [5–9] measurements were realized per patient, totaling 196 study points. Fifty-one (26%) Th-NCO
episodes were collected, mainly during the first hours (1 h [0–15]) of VA-ECLS. NCO ≥ 1 L/min study points (n = 145, 74%) were recorded later (me-dian 30th hour [8–65]). Forty-seven (24%) of the study points were recorded while left VAD support
106 VA-ECLS 72 PP < 20 mmHg 34 PP 20 mmHg 46 no PAC Contraindication: 12 Insertion failure: 3 Not available: 31 26 PP<20 mmHg + PAC monitoring 196 Study points 51 NCO < 1 L/min 145 NCO 1 L/min
Fig. 1 Flowchart. VA-ECLS, veno-arterial extracorporeal life support; PP, pulse pressure; PAC, pulmonary artery catheter; NCO, native cardiac output
Table 1 Patients’ characteristics, clinical course, and outcomes in intensive care unit
Men 16 (62)
Age, years 63 [58–70]
Body mass index 25 [23–29]
Cardiogenic shock etiology
Post cardiotomy 11 (42)
Acute myocardial infarction 8 (31)
Dilated cardiomyopathy 5 (19)
0thers 2 (8)
Clinical and biological variables at VA-ECLS implantation
Resuscitation before VA-ECLS 9 (35)
VA-ECLS under CPR 4 (15)
SOFA score 12 [12–13]
Durable left VAD 1 (4)
Transient left VAD 4 (15)
IABP 0 (0)
Serum lactate, mmol/L 7.1 [4.5–9.7]
Prothrombin time, % 56 [44–64]
Hemodynamic variables at inclusion (=1st study point)
Heart rate, beats/min 90 [77–100]
Cardiac pacing 6 (23)
Norepinephrine, mg/h 3 [1.3–5.1]
Inotropic support 14 (54)
Inhaled nitric oxide 7 (27)
VA-ECLS flow, L/min 3.4 [2.9–4.1]
Left VAD flow if present, L/min 0.9 [0.4–1.5]
Clinical course in ICU
Days under VA-ECLS 8 [6–10]
Add of transient left VAD during VA-ECLS 4 (15)
Add of IABP during VA-ECLS 0 (0)
Renal replacement therapy 10 (38)
Successful VA-ECLS weaning 18 (69)
Outcomes
Length of ICU stay, days 21 [13–31]
ICU survival 13 (50)
6-month survival 11 (42)
Data are expressed as median [IQR interquartile range], orN (%) VA-ECLS veno-arterial extracorporeal life support, CPR cardiopulmonary resuscitation,SOFA Sepsis-Related Organ Failure Assessment, VAD ventricular assist device,ICU intensive care unit, IABP intra-aortic balloon pump
was running (= missing data for pulse pressure), with a similar proportion between Th-NCO events and other study points (Table 2).
Eighteen (69%) patients presented at least one episode of Th-NCO and 13 (50%) had Th-NCO at the first meas-urement. Respiratory and hemodynamic variables accord-ing to NCO < or≥ 1 L/min are reported in Table2.
Pulse pressure and NCO
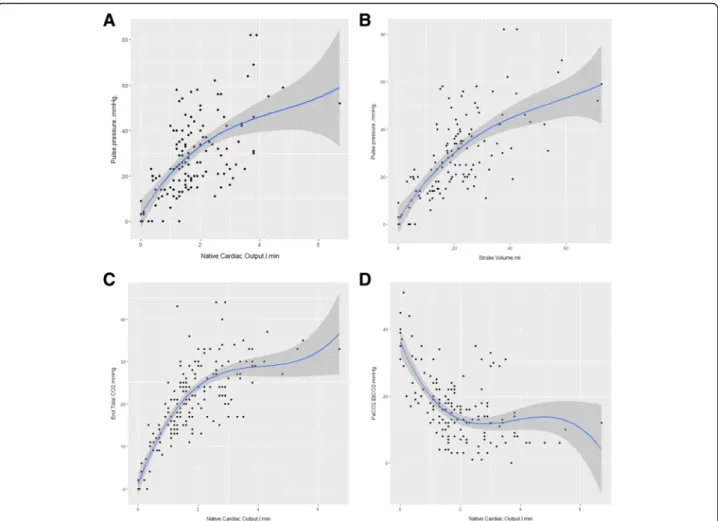
As shown in Fig. 2a, PP relationship with NCO described a nonlinear regression curve. The spline
regression model error increased significantly with NCO (p < 0.001 with positive coefficient), which means that the model fitted better for lower NCO values. A similar relationship was observed between PP and stroke volume, with the spline regression model error significantly increased with NCO (p < 0.001) (Fig.2b).
Since the relationship between PP and NCO < 2 L/min was covering the NCO values of interest, we also tested a linear fitting, which showed a correlation coefficient of 0.694 [CI 0.570–0.786].
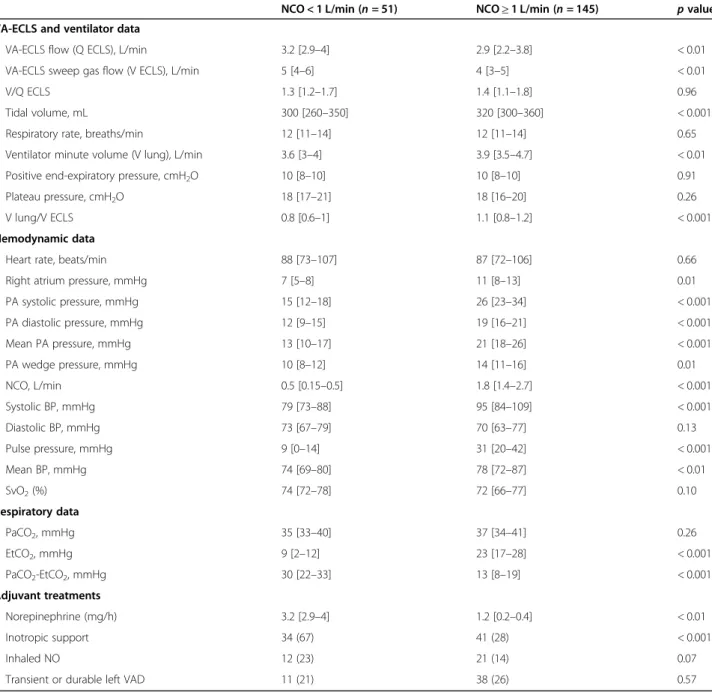
Table 2 Respiratory and hemodynamic data according to native cardiac output (NCO) < 1 L/min versus≥ 1 L/min
NCO < 1 L/min (n = 51) NCO≥ 1 L/min (n = 145) p value
VA-ECLS and ventilator data
VA-ECLS flow (Q ECLS), L/min 3.2 [2.9–4] 2.9 [2.2–3.8] < 0.01
VA-ECLS sweep gas flow (V ECLS), L/min 5 [4–6] 4 [3–5] < 0.01
V/Q ECLS 1.3 [1.2–1.7] 1.4 [1.1–1.8] 0.96
Tidal volume, mL 300 [260–350] 320 [300–360] < 0.001
Respiratory rate, breaths/min 12 [11–14] 12 [11–14] 0.65
Ventilator minute volume (V lung), L/min 3.6 [3–4] 3.9 [3.5–4.7] < 0.01
Positive end-expiratory pressure, cmH2O 10 [8–10] 10 [8–10] 0.91
Plateau pressure, cmH2O 18 [17–21] 18 [16–20] 0.26
V lung/V ECLS 0.8 [0.6–1] 1.1 [0.8–1.2] < 0.001
Hemodynamic data
Heart rate, beats/min 88 [73–107] 87 [72–106] 0.66
Right atrium pressure, mmHg 7 [5–8] 11 [8–13] 0.01
PA systolic pressure, mmHg 15 [12–18] 26 [23–34] < 0.001 PA diastolic pressure, mmHg 12 [9–15] 19 [16–21] < 0.001 Mean PA pressure, mmHg 13 [10–17] 21 [18–26] < 0.001 PA wedge pressure, mmHg 10 [8–12] 14 [11–16] 0.01 NCO, L/min 0.5 [0.15–0.5] 1.8 [1.4–2.7] < 0.001 Systolic BP, mmHg 79 [73–88] 95 [84–109] < 0.001 Diastolic BP, mmHg 73 [67–79] 70 [63–77] 0.13 Pulse pressure, mmHg 9 [0–14] 31 [20–42] < 0.001 Mean BP, mmHg 74 [69–80] 78 [72–87] < 0.01 SvO2(%) 74 [72–78] 72 [66–77] 0.10 Respiratory data PaCO2, mmHg 35 [33–40] 37 [34–41] 0.26 EtCO2, mmHg 9 [2–12] 23 [17–28] < 0.001 PaCO2-EtCO2, mmHg 30 [22–33] 13 [8–19] < 0.001 Adjuvant treatments Norepinephrine (mg/h) 3.2 [2.9–4] 1.2 [0.2–0.4] < 0.01 Inotropic support 34 (67) 41 (28) < 0.001 Inhaled NO 12 (23) 21 (14) 0.07
Transient or durable left VAD 11 (21) 38 (26) 0.57
Data are expressed as median [IQR interquartile range], orN (%)
NCO native cardiac output, VA-ECLS veno-arterial extracorporeal life support, EtCO2end-tidal carbon dioxide,PaCO2-EtCO2arterial-to-end-tidal carbon dioxide gradient,BP blood pressure, PA pulmonary artery, SvO2mixed venous oxygen saturation,NO nitric oxide, VAD left ventricular assist device
End-tidal CO2and NCO
As shown in Fig. 2c, EtCO2 relationship with NCO
also described a nonlinear regression curve. The spline regression model error increased significantly with NCO (p = 0.01 with positive coefficient), which means that the model fitted better for lower NCO values. Indeed, linear fitting between EtCO2 and
NCO < 2 L/min found a correlation coefficient of 0.779 [CI 0.683–0.848].
Of note, uneven V/Q ratios at lungs and membrane did not affect the relation between EtCO2and NCO (p = 0.15
andp = 0.1 for V/Q ECLS and V/Q lung respectively). A similar biphasic correlation was observed for the PaCO2-EtCO2gradient but in the opposite direction to
EtCO2 (Fig. 2d), and with weaker correlation
coeffi-cient (− 0.560 [− 0.685–0.402]) when considering the linear regression between PaCO2-EtCO2 gradient and
NCO < 2 L/min.
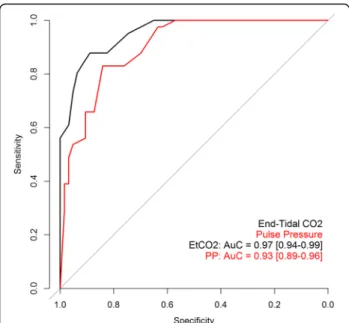
Accuracy of pulse pressure and EtCO2to predict Th-NCO
The best cut-off values for predicting Th-NCO were 14.5 mmHg for PP (sensitivity = 0.83, specificity = 0.90, positive predictive value = 0.75, negative predictive value = 0.93) and 13.5 mmHg for EtCO2 (sensitivity =
0.88, specificity = 0.93, positive predictive value = 0.82, negative predictive value = 0.95).
ROC curve analysis of PP and EtCO2 cut-off values
are shown in Fig. 3. ROC AUC tended to be higher for EtCO2 than for PP (0.97 [0.94–0.99] and 0.93 [0.89–
0.96] respectively,p = 0.058).
Discussion
This prospective study shows that, during VA-ECLS, PP and EtCO2are strongly correlated with NCO when it is
lower than 2 L/min. PP < 15 mmHg and EtCO2 < 14
mmHg predicted Th-NCO (NCO < 1 L/min) with good accuracy. Monitoring these parameters may help to
Fig. 2 Pulse pressure and EtCO2relationships with native cardiac output and their determinants. Native cardiac output was assessed with
pulmonary artery catheter or echocardiography at the same time as pulse pressure, end-tidal carbon dioxide (EtCO2), arterial carbon dioxide
pressure (PaCO2), and heart rate. Figures consist of spline regression representations (cubic spline, P Bruce and Bruce 2017) of the relationships
between a pulse pressure and native cardiac output, b pulse pressure and stroke volume, c EtCO2and native cardiac output, and d PaCO2-EtCO2
gradient and native cardiac output. The variation of model performance according to theX was evaluated through prediction of the error model (p < 0.001, p < 0.001, p = 0.01, and p = 0.3 for figures a, b, c, and d respectively)
prevent the risks associated with low NCO during VA-ECLS.
In the early phase of cardiovascular assistance in the case of severe CS, VA-ECLS is devoted to the restoration of blood flow to organs, a vital issue in avoiding multiple organ failure and death [22]. Therefore, low residual transpulmonary blood flow or NCO is common during the initial hours after VA-ECLS implantation [23]. In our series, owing to the fact that patients were included with PP < 20 mmHg, a high incidence of Th-NCO was expected and 13 (50%) patients did indeed have Th-NCO at the first measurement. However, most Th-Th-NCO episodes (n = 38, 75%) occurred afterwards, despite glo-bal NCO improvement over time.
Not surprisingly, Th-NCO was associated with higher VA-ECLS flow, lower blood and pulmonary artery pres-sures, stable heart rate, and higher inotropic and vaso-pressor support (Table 2), a hemodynamic profile that underlines a high dependence on VA-ECLS. However, we also observed lower right atrial pressure and lower PAWP when NCO was < 1 L/min compared to NCO≥ 1 L/min, suggesting that hypovolemia may have worsened the NCO. High VA-ECLS outflows are at greater risk of pulmonary circulation exclusion and left ventricle dis-tension, and thus, related complications may occur. The study was not designed to explore these complications, but several publications have already reported risk of blood stasis, stroke incidence, or intra-cardiac or aortic
root thrombosis [5, 6, 24, 25]. In our series, 4 (15%) patients needed LV venting with Impella to avoid major complications, an incidence in agreement with previous studies [12, 13]. Poor prognosis of Th-NCO increases with its duration or episode repetition [7, 23]. Therefore, the monitoring of NCO is strongly rec-ommended to avoid a prolonged cumulative time of Th-NCO [8].
In this respect, ELSO guidelines recommend the use of a PAC to maintain mean PAP > 30 mmHg, echocardi-ography to avoid non-opening of the aortic valve, and continuous arterial monitoring to track the non-pulsatile arterial line [8]. PAC is mandatory for measuring PAP, but it is an invasive monitoring method with a limited duration of utilization due to septic risk [26]. High PAP may also reflect left ventricular overload, through an ele-vation of PAWP, a major concern during VA-ECLS. Moreover, in our series, even when NCO exceeded 1 L/ min, mean PAP was lower than 30 mmHg, which indeed seems like a rather difficult objective to achieve when patients are very VA-ECLS dependent. Incidentally, PAC with continuous thermodilution measurement of cardiac output cannot measure flows < 1 L/min and becomes less reliable when cardiac output falls below 2 L/min, which makes PAC less useful in the condition of high level of ECLS assistance [15,16]. The PAC limitation on cardiac output measurement in low flow states could be overcome with adaptation of the thermodilution tech-nique, mainly with resetting catheter constant at various flow ranges [27]. Although attractive, the technique is currently not available in clinical practice.
A continuous monitoring of the arterial pressure line can evidence loss of pulsatility, and echocardiography may then confirm absence or rare openings of the aortic valve. The loss of pulsatility is associated with blood sta-sis and a high incidence of stroke (41%) [6]. However, analysis of PP may go beyond the qualitative evaluation of the presence or absence of pulsatility. In physiology, PP is linearly related to the stroke volume and inversely related to arterial compliance [28]. In the non-physiological condition of the VA-ECLS, PP was still strongly related to stroke volume, especially for lower stroke volume values. The NCO relationship with pulse pressure followed that of stroke volume, in agreement with a heart rate that remained constant. The weaker lationship with upper values might be explained by a re-duction of VA-ECLS backflow pressure. VA-ECLS outflow was reduced proportionally to the improvement of NCO, therefore decreasing LV afterload, which is equivalent to an increase in arterial compliance [28]. Anyway, the good relation between low NCO levels and PP was exemplified by the ROC curve analysis, with ex-cellent accuracy for predicting Th-NCO. However, PP monitoring may be limited by any venting technique
Fig. 3 ROC AUCs of pulse pressure and EtCO2for predicting native
cardiac output < 1 L/min. ROC curve for pulse pressure (PP) in red and for end-tidal carbon dioxide (EtCO2) in black. Receiver operating
characteristics (ROC) curves quantified by area under the curve (AUC) and 95% CI were obtained from 149 study points because 47 pulse pressure values were missing (patients on concomitant left VAD).p = 0.058 between ROC AUC of PP versus EtCO2(Delong test)
involving the left ventricle, by aortic valve leaks, or by the presence of an intra-aortic balloon.
Conversely, EtCO2appears as a very pertinent
param-eter, even when PP is not reliable. EtCO2monitoring is
a routine and non-invasive measure in ventilated pa-tients. Recent studies have found a correlation between NCO and EtCO2in patients requiring LV venting during
VA-ECLS [19,29]. In the present study, we demonstrate that EtCO2 correlated strongly with NCO when < 2 L/
min, and even that EtCO2tended to have a better ability
than PP to predict Th-NCO. This result corroborates Bachman and coworkers’ study, which showed in an ex-perimental model of VA-ECLS that the variation of CO2
elimination from the lungs correlated strongly with the variation of pulmonary blood flow [30]. Moreover, in our study, PaCO2was measured as a control of effective
CO2 removal by both lungs and ECLS. Owing to the
facts that PaCO2 was in normal range and that sweep
gas-to-blood flow ratio at ECLS as well as ventilator set-tings were unchanged, the EtCO2 changes followed the
NCO quite well at low NCO levels. Indeed, in physio-logical conditions, when CO2 production is stable, the
venous return allows CO2 transport to the lung where
CO2is removed from the blood through the regulation
of pulmonary gas exchanges. EtCO2is closely related to
PaCO2, and the PaCO2-EtCO2 gradient is low (3–5
mmHg) [31]. An EtCO2decrease, with parallel increase
of PaCO2-EtCO2gradient, while CO2production or gas
exchanges are unchanged, reflects quite directly a de-crease in venous return and pulmonary artery flow, generating alveolar dead space [17, 18, 31, 32]. In the condition of VA-ECLS, a large amount of venous re-turn is diverted to the membrane oxygenator by the ECLS circuit, but NCO keeps a fraction of the venous return for flow into the pulmonary artery towards the alveolar capillaries. Therefore, CO2 removal depends
on ventilator and ECLS settings, but even with very low volume ventilation, EtCO2 variation parallels the
changes in alveolar dead space related to low pul-monary artery blood flow. In our series, minute venti-lation was low (median 3.6 L/min, which is roughly half the physiological value), but median PaCO2
-EtCO2 gradient was 30 mmHg, i.e., 6-fold the normal
range, when NCO was < 1 L/min. The EtCO2 kept
go-ing up when NCO increased above 1 L/min but the relation between EtCO2 and NCO curved down
sig-nificantly when NCO exceeded 2 L/min (Fig. 2c), demonstrating that EtCO2 became independent on
the NCO level when pulmonary vascular recruitment was completed. The limitation of EtCO2 monitoring
is related to the access to exhaled CO2 that, in order
to be trustable, needs the patient to be intubated. Taken together, the two parameters offer a real-time, complementary monitoring method and could guide
medical interventions (fluid loading, inotrope, cardiac pacing, VA-ECLS outflow titration, or left ventricle vent-ing) for NCO optimization in situations of threatening NCO.
Our study has several limitations. It is a single-center nature study with a small number of patients and a strict control of lung and ECLS ventilations, and thus PaCO2.
The ventilator and ECLS settings were fixed according to guidelines, which are routinely used in most ECLS centers. A quarter of the measures were made with concomitant left VAD support that induced missing data for PP. How-ever, the association of transient or durable VAD with VA-ECLS is frequent and source of low NCO events. NCO monitoring is crucial in these patients and PP is not reliable. Based on previous observations [19], we thought that VAD do not impede interpretation of EtCO2/NCO relationship, which is why we chose to include patients with VAD. PAC monitoring was considered as the gold standard for cardiac output measurement but its accuracy in cases of low cardiac output and in the setting of VA-ECLS is disputed [27]. Although echocardiography was used for NCO < 1 L/min (failure of PAC assessment), cross measurements for comparison of the 2 techniques above 1 L/min would have been interesting. Finally, car-diac thrombosis and stroke incidences were not docu-mented in this study, but recommended actions to prevent them (including LV venting) were applied when appropriate. The study was based on a physiological ap-proach, and the small number of patients included would not allow any significant clinical assumption.
Conclusions
The study shows that PP and EtCO2are interesting
pa-rameters to monitor residual native cardiac output during VA-ECLS, specifically for detecting threatening NCO. Thresholds of PP < 15 mmHg and EtCO2< 14 mmHg
pre-dicted NCO < 1 L/min with good accuracy. Further studies are needed to show if their utilization may help to imple-ment therapeutic strategies in order to prevent thrombo-embolic and respiratory complications associated with VA-ECLS, and to improve patients’ prognosis.
Abbreviations
AUC:Area under the curve; CS: Cardiogenic shock; EtCO2: End-tidal carbon
dioxide; ICU: Intensive care unit; LV: Left ventricular; NCO: Native cardiac output; PAC: Pulmonary artery catheter; PAP: Pulmonary artery pressure; PAWP: Pulmonary arterial wedge pressure; PP: Pulse pressure; ROC: Receiver operating characteristics; SEC: Spontaneous echo contrast;
Th-NCO: Threatening NCO; VA-ECLS: Veno-arterial extracorporeal life support; VAD: Ventricular assist device
Acknowledgements Not applicable. Authors’ contributions
MM was involved in the conception of the study, in the interpretation of the data, and in drafting the manuscript. EJ was involved in the study design and in revising the manuscript. ZN, SM, and SP contributed to the data
acquisition and drafting of the manuscript. MF and MN were involved in the statistical design and analysis of the study and in revising the manuscript. GT was involved in all surgical aspects of the study design and in revising the manuscript. CP and GP were involved in the interpretation of data and in revising the manuscript. All authors approved the final manuscript to be published and are accountable for all aspects of the work.
Funding
Montpellier University Hospital Availability of data and materials
The datasets used and/or analyzed during the current study are available from the corresponding author on reasonable request.
Ethics approval and consent to participate
Our institutional review board had approved the study design (CPP Sud Mediterranée 1; ID RCB: 2015-A02006-43). Informed consent was obtained from all patients or their surrogates. The trial was registered on Clinical Trials on July 12, 2016 (NCT03323268).
Consent for publication Not applicable. Competing interests
The authors declare that they have no competing interests. Author details
1Department of Anesthesiology and Critical Care Medicine, Arnaud de
Villeneuve Hospital, CHU Montpellier, Univ Montpellier, Montpellier, France.
2Epidemiology and Clinical Research Department, CHU Montpellier, Univ
Montpellier, Montpellier, France.3Department of Cardiac Surgery, CHU
Montpellier, Univ Montpellier, Montpellier, France.4Univ Montpellier, CNRS,
INSERM, Institut de Génomique Fonctionnelle, Montpellier, France.5Univ Montpellier, CNRS, INSERM, PhyMedExp, Montpellier, France.
Received: 19 June 2020 Accepted: 10 September 2020
References
1. Stretch R, Sauer CM, Yuh DD, et al. National trends in the utilization of short-term mechanical circulatory support: incidence, outcomes, and cost analysis. J Am Coll Cardiol. 2014;64:1407–15.
2. Combes A, Leprince P, Luyt C-E, et al. Outcomes and long-term quality-of-life of patients supported by extracorporeal membrane oxygenation for refractory cardiogenic shock. Crit Care Med. 2008;36:1404–11.
3. Chen Y-S, Lin J-W, Yu H-Y, et al. Cardiopulmonary resuscitation with assisted extracorporeal life-support versus conventional cardiopulmonary resuscitation in adults with in-hospital cardiac arrest: an observational study and propensity analysis. Lancet Lond Engl. 2008;372:554–61.
4. Vardi A, Jessen ME, Chao RY, et al. Effect of extracorporeal membrane oxygenation flow on pulmonary capillary blood flow. Crit Care Med. 1995;23:726–32. 5. Williams B, Bernstein W. Review of venoarterial extracorporeal membrane
oxygenation and development of intracardiac thrombosis in adult cardiothoracic patients. J Extra Corpor Technol. 2016;48:162–7. 6. Unai S, Nguyen M-L, Tanaka D, et al. Clinical significance of spontaneous
echo contrast on extracorporeal membrane oxygenation. Ann Thorac Surg. 2017;103:773–8.
7. Koul B, Wollmer P, Willen H, et al. Venoarterial extracorporeal membrane oxygenation--how safe is it? Evaluation with a new experimental model. J Thorac Cardiovasc Surg. 1992;104:579–84.
8. Extracorporeal Life Support Organization: ELSO Adult Cardiac Failure Supplement to the ELSO General Guidelines v1.3. Ann Arbor; 2013.http:// elso.org/.
9. Truby L, Hart S, Takeda K, et al. Management and outcome of left ventricular distention during venoarterial extracorporeal membrane oxygenation support. J Heart Lung Transplant. 2015;34:S83–4. 10. Cevasco M, Takayama H, Ando M, et al. Left ventricular distension and
venting strategies for patients on venoarterial extracorporeal membrane oxygenation. J Thorac Dis. 2019;11:1676–83.
11. Schrage B, Becher M, Schwarzl M, et al. Percutaneous unloading of the left ventricle during extracorporeal membrane oxygenation in cardiogenic
shock - ongoing experience from a high-volume centre. J Heart Lung Transplant. 2018;37:S28.
12. Gaudard P, Mourad M, Eliet J, et al. Management and outcome of patients supported with Impella 5.0 for refractory cardiogenic shock. Crit Care Lond Engl. 2015;19:363.
13. Mourad M, Gaudard P, De La Arena P, et al. Circulatory support with extracorporeal membrane oxygenation and/or Impella for cardiogenic shock during myocardial infarction. ASAIO J. 2018;64:708–14. 14. Russo JJ, Aleksova N, Ian P, et al. Left ventricular unloading during
extracorporeal membrane oxygenation in patients with cardiogenic shock. J Am Coll Cardiol. 2019;73:654–62.
15. Norris SL, King EG, Grace M, et al. Thermodilution cardiac output--an in vitro model of low flow states. Crit Care Med. 1986;14:57–9.
16. Reuter DA, Huang C, Edrich T, et al. Cardiac output monitoring using indicator-dilution techniques: basics, limits, and perspectives. Anesth Analg. 2010;110:799–811.
17. Shibutani K, Muraoka M, Shirasaki S, et al. Do changes in end-tidal PCO2 quantitatively reflect changes in cardiac output? Anesth Analg. 1994;79:829–83. 18. Maslow A, Stearns G, Bert A, et al. Monitoring end-tidal carbon dioxide
during weaning from cardiopulmonary bypass in patients without significant lung disease. Anesth Analg. 2001;92:306–13.
19. Eliet J, Gaudard P, Zeroual N, et al. Effect of Impella during veno-arterial extracorporeal membrane oxygenation on pulmonary artery flow as assessed by end-tidal carbon dioxide. ASAIO J. 2018;64:502–7. 20. Schmidt M, Pellegrino V, Combes A, et al. Mechanical ventilation during
extracorporeal membrane oxygenation. Crit Care Lond Engl. 2014;18:203. 21. Peter Bruce, Andrew Bruce. Practical statistics for data scientists. Sebastopol:
O’Reilly Media; 2017.
22. Rao P, Khalpey Z, Smith R, Burkhoo D, Kociol RD. Venoarterial extracorporeal membrane oxygenation for cardiogenic shock and cardiac arrest. Circ Heart Fail. 2018;11:e004905.
23. Park B-W, Seo D-C, Moon I-K, et al. Pulse pressure as a prognostic marker in patients receiving extracorporeal life support. Resuscitation. 2013;84:1404–8. 24. Weber C, Deppe A-C, Sabashnikov A, et al. Left ventricular thrombus
formation in patients undergoing femoral veno-arterial extracorporeal membrane oxygenation. Perfusion. 2018;33:283–28.
25. Madershahian N, Weber C, Scherner M, et al. Thrombosis of the aortic root and ascending aorta during extracorporeal membrane oxygenation. Intensive Care Med. 2014;40:432–43.
26. Haller M, Zöllner C, Briegel J, et al. Evaluation of a new continuous thermodilution cardiac output monitor in critically ill patients: a prospective criterion standard study. Crit Care Med. 1995;23:860–6.
27. Bachmann KF, Zwicker L, Nettelbeck K, Casoni D, Heinisch PP, Jenni H, Haenggi M, Berger D. Assessment of right heart function during extracorporeal therapy by modified thermodilution in a porcine model Anesthesiology 2020. No Pagination Specified.https://doi.org/10.1097/ALN. 0000000000003443.
28. Vennin S, Li Y, Willemet M, et al. Identifying hemodynamic determinants of pulse pressure. A combine numerical and physiological approach. Hypertension. 2017;70:1176–82.
29. Lim HS. The effect of Impella CP on cardiopulmonary physiology during venoarterial extracorporeal membrane oxygenation support. Artif Organs. 2017;41:1109–12.
30. Bachmann KF, Haenggi M, Jakob S, Takala J, Gattinoni L, Berger D. Gas exchange calculation may estimate changes in pulmonary blood flow during veno-arterial extracorporeal membrane oxygenation in a porcine model. Am J Physiol Lung Cell Mol Physiol. 2020;318:L1211–21. 31. Downs JB. PaCO2, EtCO2 and gradient. In: CAPNOGRAPHY 2nd edition,
Gravenstein JS, Jaffe MB, Gravenstein N, Paulus DA, editors. Cambridge: Cambridge University Press; 2011. p. 225–30.
32. Isserles SA, Breen PH. Can changes in end-tidal PCO2 measure changes in cardiac output? Anesth Analg. 1991;73:808–14.
Publisher’s Note
Springer Nature remains neutral with regard to jurisdictional claims in published maps and institutional affiliations.