HAL Id: halsde-00510994
https://hal.archives-ouvertes.fr/halsde-00510994
Submitted on 23 Aug 2010HAL is a multi-disciplinary open access archive for the deposit and dissemination of sci-entific research documents, whether they are pub-lished or not. The documents may come from teaching and research institutions in France or abroad, or from public or private research centers.
L’archive ouverte pluridisciplinaire HAL, est destinée au dépôt et à la diffusion de documents scientifiques de niveau recherche, publiés ou non, émanant des établissements d’enseignement et de recherche français ou étrangers, des laboratoires publics ou privés.
Accelerated evolutionary rate of housekeeping genes in
tunicates.
Georgia Tsagkogeorga, Xavier Turon, Nicolas Galtier, Emmanuel Douzery,
Frédéric Delsuc
To cite this version:
Georgia Tsagkogeorga, Xavier Turon, Nicolas Galtier, Emmanuel Douzery, Frédéric Delsuc. Acceler-ated evolutionary rate of housekeeping genes in tunicates.. Journal of Molecular Evolution, Springer Verlag, 2010, 71 (2), pp.153-67. �10.1007/s00239-010-9372-9�. �halsde-00510994�
1
Accelerated Evolutionary Rate of Housekeeping Genes in
Tunicates
Georgia Tsagkogeorga ● Xavier Turon ● Nicolas Galtier ● Emmanuel J. P. Douzery ● Frédéric Delsuc
G. Tsagkogeorga ● N. Galtier ● E. J. P. Douzery ● F. Delsuc (*)
Université Montpellier 2 and CNRS, Institut des Sciences de l'Evolution (UMR 5554), CC064, Place Eugène Bataillon, 34095 Montpellier Cedex 05, France
e-mail: [email protected]
X. Turon
Centre d’Estudis Avançats de Blanes (CEAB, CSIC), Accés Cala S. Francesc 14, 17300 Blanes (Girona), Spain
Running title: Tunicate accelerated evolutionary rates
Keywords: Urochordates – Chordates – Phylogenomics – 454 sequencing – Molecular
2
Abstract
Phylogenomics has recently revealed that tunicates represent the sister-group of vertebrates in the newly-defined clade Olfactores. However, phylogenomic and comparative genomic studies have also suggested that tunicates are characterized by an elevated rate of molecular evolution and a high degree of genomic divergence. Despite the recurrent interest in the group, the picture of tunicate peculiar evolutionary dynamics is still fragmentary, as it mainly lies in studies focusing on only few model species. In order to expand the available genomic data for the group, we used the high-throughput 454 technology to sequence the partial transcriptome of a previously unsampled tunicate, Microcosmus squamiger. This allowed us to get further insights into tunicate accelerated evolution through a comparative analysis based on pertinent phylogenetic markers, i.e., a core of 35 housekeeping genes conserved across bilaterians. Our results showed that tunicates evolved on average about two times faster than the other chordates, yet the degree of this acceleration varied extensively upon genes and upon lineages. Appendicularia and Aplousobranchia were detected as the most divergent groups which were also characterized by highly heterogeneous substitution rates across genes. Finally, an estimation of the dN/dS ratio in three pairs of closely related taxa
within Olfactores did not reveal strong differences between the tunicate and vertebrate lineages suggesting that for this set of housekeeping genes the accelerated evolution of tunicates is plausibly due to an elevated mutation rate rather than to particular selective effects.
3
Introduction
Understanding chordate origins and evolution has been a preeminent challenge for biologists over the last two centuries (Swalla and Xavier-Neto 2008). The phylum Chordata consists of three distinct lineages: cephalochordates (lancelets), tunicates or urochordates (sea squirts, salps and appendicularians) and craniates (i.e., cyclostomes and vertebrates). Among these, tunicates embrace a diversity of more than 3,000 filter-feeding and mostly hermaphrodite marine species, characterized by both sessile (ascidians) and planktonic (salps and
appendicularians) life styles, associated with a unique developmental program (Cone and Zeller 2005; Lambert 2005; Satoh 2003).
In sharp contrast with vertebrates and lancelets, the vast majority of tunicate adults lack the hallmarks of the typical chordate body plan, namely a dorsal neural tube and a notochord. From the time it has been pointed out that ascidian larvae do possess these chordate features (Kowalevski 1868), tunicates have been considered as the sister group of Euchordata, i.e., cephalochordates plus craniates (Cameron et al. 2000; Mallatt and Winchell 2007; Swalla et al. 2000; Winchell et al. 2002). Although widely accepted during the pre-genomic era, this euchordate view has been substantially impacted by the genome projects of the two model ascidians Ciona intestinalis (Dehal et al. 2002) and Ciona savignyi (Small et al. 2007b), as well as the draft genome of the appendicularian Oikopleura dioica (Seo et al. 2001).
These genomic data allowed including tunicates in phylogenomic studies and
accumulating evidence soon indicated that the evolutionary positions of cephalochordates and tunicates should be reversed, erecting a clade called Olfactores that links tunicates with vertebrates (Bourlat et al. 2006; Delsuc et al. 2006; Delsuc et al. 2008; Dunn et al. 2008; Singh et al. 2009). Although debated at first, the Olfactores hypothesis of chordate evolution
4
has now gained wide acceptance since it has been corroborated by analyses of the complete genome sequence of the amphioxus (Putnam et al. 2008). Moreover, the latest mitogenomic analyses also provided additional support for such a relationship within chordates (Singh et al. 2009).
Comparative genomics also revealed that tunicates possess the basic developmental genetic toolkit of vertebrates in unexpectedly condensed genomes that have not undergone the subsequent vertebrate-specific duplication events (Cañestro et al. 2003; Dehal and Boore 2005; Dehal et al. 2002). This prompted a growing interest in tunicates as useful experimental systems to decipher the developmental mechanisms underlying chordate origins (Davidson 2007; Holland and Gibson-Brown 2003; Satoh 2003). Despite this renewed interest, our current understanding of tunicate evolution remains fragmentary since phylogenomic and especially comparative genomic studies are taxonomically biased towards model species with available genomes (Bourlat et al. 2006; Delsuc et al. 2006; Delsuc et al. 2008; Donmez et al. 2009; Imai et al. 2006; Kim et al. 2007; Satoh 2003; Sierro et al. 2006; Yandell et al. 2006). Complementary EST data are available in a few additional species like Diplosoma
listerianum (Blaxter and Thomas 2004), Molgula tectiformis (Gyoja et al. 2007) and
Halocynthia roretzi (Kim et al. 2008). However, the aforementioned species are far from
covering the diversity of tunicates, so that genomic data are still disproportionately distributed among the major phylogenetic lineages. Moreover, tunicates are currently subjected to a paucity of nuclear phylogenetic markers, as indicated by the exclusive use of the 18S rRNA associated with open controversies regarding the evolutionary history of the group
(Tsagkogeorga et al. 2009; Yokobori et al. 2006; Zeng et al. 2006; Zeng and Swalla 2005). One reason invoked to explain this situation involves the high level of divergence of tunicate lineages due to their accelerated evolution (Zeng et al. 2006). Several recent genome based phylogenies inferred from either nuclear or mitochondrial genome data have provided
5
clear-cut evidence for the particularly high rates distinguishing tunicate evolution, as illustrated by the persisting long branches of the group in the reconstructed trees (Bourlat et al. 2008; Delsuc et al. 2008; Gissi et al. 2008; Singh et al. 2009). Similar conclusions have been drawn by studies focusing on individual genes such as 18S rRNA (Perez-Portela et al. 2009; Yokobori et al. 2006), cox1 (Turon and Lopez-Legentil 2004), Huntingtin (Gissi et al. 2006), P transposase (Kimbacher et al. 2009), or chordate gene families such as CYP 1 (Goldstone et al. 2007) suggesting that tunicate sequence divergence may increase up to 30% between species of the same genus. Similarly, whole-genome sequence data analyses have also revealed high rates of molecular evolution at a within-species level, as indicated by the extremely high rates of structural (16.6 %) and single nucleotide polymorphism (4.5%) characterizing the Ciona savignyi genome (Small et al. 2007a). As far as genomic features are concerned, it has been shown that, besides genome contraction, tunicates have also undergone dramatic genomic rearrangements associated to numerous gene losses (Holland and Gibson-Brown 2003). Breaking prominent chordate paradigms, intron positions are highly variable in
Oikopleura doica genes (Edvardsen et al. 2004), the Hox cluster is disintegrated in Ciona
intestinalis (Ikuta et al. 2004) and Oikopleura doica (Seo et al. 2004), and the main retinoic
acid signaling genes are lacking from the Oikopleura dioica genome (Cañestro and
Postlethwait 2007). All afore-mentioned elements suggest a high degree of tunicate genomic divergence from other chordate lineages and provide compelling evidence that tunicates exhibit high rates of molecular evolution.
Given these puzzling issues, we conducted an in silico identification of new nuclear coding phylogenetic markers for tunicates from orthologous housekeeping genes. These candidate markers were then validated in a non-model species, Microcosmus squamiger (Ascidiacea: Stolidobranchia, Pyuridae) through an in vitro transcriptomic approach involving high-throughput 454-sequencing (Margulies et al. 2005). In order to shed light on the patterns
6
of evolutionary rate variation among tunicates and other chordates, we carried out a
comparative analysis based on a subset of 35 highly conserved orthologs. More precisely, our study aimed at testing the hypothesis of tunicate accelerated evolution at independent nuclear loci and assessing their degree of divergence from the other chordate lineages. To this goal we addressed the following questions: (1) Are evolutionary rates of amino acid replacement consistently higher in tunicates than in vertebrates and to what extent? (2) Do chordates exhibit homogenous within-lineage rates and, if not, which genes and/or which species contribute the most to the observed heterogeneity? And finally (3) what are the underlying cause(s) of molecular evolutionary rate heterogeneities within Olfactores?
Materials and Methods
Biological sampling and 454 sequencing of Microcosmus squamiger
Microcosmus squamiger individuals were collected from an invasive population at the
locality of Cubelles (Rius et al. 2009), in the Spanish North-East littoral (41º11’37.2” N, 1º39’17.46” E).Muscle and gonad tissues were dissected and rapidly frozen in liquid nitrogen. Given the small size of this species, tissue material from 8 individuals was mixed and used for standard cDNA library construction in pCMV Sport 6.1 vectors (Invitrogen; Carlsbad, CA, USA). The obtained library was estimated to contain 1.9 x 10⁷ cDNA clones,
with inserts of about length 2 kb in average which were subsequently sequenced using the 454 Roche GS FLX standard system.
Identification of orthologs
First, we formatted three reference databases: (1) a database consisting of all Ciona
7
orthologous genes between Ciona intestinalis and Ciona savignyi (9,520 genes); and finally (3) a protein database built from a previous phylogenomic dataset of 179 orthologous markers for 51 metazoans (Delsuc et al. 2008). We then scanned the 454-generated data by conducting similarity searches against these databases, and vice versa, using the programs BLASTN, TBLASTX, BLASTX and TBLASTN respectively, with a cut-off e-value of 10-6 (Altschul et
al. 1990).
Contigs of the sequences matching the third database were assembled using the program CAP3 (Huang and Madan 1999). Orthology assignment was controlled in two ways: (1) by reciprocal BLAST searches, i.e., by checking that the best hit for a given contig indeed corresponded to the targeted gene, and (2) by phylogenetic tree reconstruction controlling that
Microcosmus contigs cluster within tunicates in highest likelihood trees reconstructed by
TREEFINDER (Jobb et al. 2004) under the GTR+ 4+I model. Using the above criteria
allowed us to determine the orthologous coding sequences of Microcosmus squamiger for 68 metazoan housekeeping genes from the initial 179 candidates. Among these, 35 genes for which orthology was unequivocally assessed through phylogenetic analyses were finally retained. The resulting 35 Microcosmus squamiger sequences have been deposited in the EMBL nucleotide database under Accession Numbers FN984758 to FN984792.
Dataset assembly
Under conservative constraints of orthology assessment using phylogenetic reconstruction and adequate taxonomic representation of tunicates, the number of usable markers was restricted to 35 (Table 1). Individual gene datasets for these housekeeping genes were built upon available transcript data for 21 additional metazoan species: three non-bilaterians, one poriferan and two cnidarian species, used as outgroups; and 18 bilaterians, including 7 Protostomia and 11 Deuterostomia species. Nucleotide sequences for these taxa were
8
retrieved from multiple online resources, such as the Ensembl Genome Browser
(http://www.ensembl.org/), the EST Database (http://www.ncbi.nlm.nih.gov/dbEST/) and Trace Archive (http://www.ncbi.nlm.nih.gov/Traces/) of GenBank at the National Center for Biotechnology Information (http://www.ncbi.nlm.nih.gov/), as well as other eukaryotic genome databases hosted at the Department of Energy Joint Genome Institute
(http://www.jgi.doe.gov).
Each of the 35 nuclear DNA dataset was translated into protein. Amino acid alignments were generated using MAFFT version 5 (Katoh et al. 2005). Gaps were then reported on the corresponding DNA sequences to obtain nucleotide alignments. Some divergent regions of these alignments were subsequently refined manually using MEGA 4 (Tamura et al. 2007). Ambiguously aligned sites were then identified at the amino acid level and separately removed from all individual gene datasets, using the program GBLOCKS (Castresana 2000), according to the following parameters: a minimum of 14 sequences for conserved and flanking positions, a maximum of 8 contiguous non-conserved positions, a minimum of 5 positions for the length of a block, and a maximum of 50% of gaps per position. The resulting blocks of each protein alignment were then transposed at the DNA level. The concatenation of the 35 phylogenetic markers yielded two 28-taxon datasets: a nucleotide dataset including 25,026 unambiguously aligned sites (8,342 codons), and the corresponding amino acid dataset. The percentage of missing data in these matrices was only 10.7%. All datasets are available upon request.
Phylogenetic analyses
Probabilistic phylogenetic analyses of the two concatenated datasets were conducted following Bayesian Inference (BI) and Maximum Likelihood (ML) reconstruction
9
model (Lartillot and Philippe 2004) combined to a 4-category Gamma ( ) distribution, i.e., CAT+ for amino-acid and CAT+GTR+ for nucleotide alignments. All analyses were run using Phylobayes version 3.1 (Lartillot et al. 2009). For each dataset, two independent Markov Chains Monte Carlo (MCMC) were launched with parameters and trees sampled every 10 cycles until 1500 points were attained. Priors were set to default values and
convergence of the two chains was checked by monitoring the marginal likelihoods through cycles. Bayesian Posterior Probabilities (PP) were obtained from the 50% majority rule consensus of the 1000 trees sampled during the stationary phase, after a burnin of 500 cycles.
ML analyses of the nucleotide dataset were conducted using PHYML 3.01 (Guindon and Gascuel 2003) and PAUP* 4.0b10 (Swofford 2002). ML parameters of the GTR+ model were first estimated by conducting an initial heuristic search in PHYML using a BIONJ starting tree followed by Subtree Pruning and Regraphting (SPR) branch-swapping. The optimal parameter values were then used in PAUP ML heuristic searches implemented by applying Tree Bisection and Reconnection (TBR) branch-swapping on a Neighbor-Joining (NJ) starting tree. For the amino acid dataset, ML analyses were performed using the program PHYML under the CAT-C20+ model with the number of CAT categories set to 20 (Le et al. 2008) . The heuristic ML searches were conducted by performing SPR moves on a NJ starting tree.
For both nucleotide and amino-acid ML trees, statistical support was estimated by bootstrap resampling with 100 pseudo-replicates generated by the program SEQBOOT of the PHYLIP package (Felsenstein 2005). In all replicates, ML analyses were performed as described above for the original data sets. Bootstrap percentages (BP) were obtained from the 50% majority rule consensus of the 100 pseudo-replicated trees using the program
10
Substitutional saturation
We evaluated the extent of substitutional saturation in our data using saturation plots (Philippe et al. 1994) for all types of concatenated datasets, nucleotide and amino-acid, as well as for the first plus second, and third codon positions separately. The amount of saturation was estimated by plotting the observed pairwise distances on the alignments against the tree-inferred distances. The latter patristic distances were calculated from the CAT+ branch lengths estimated by PhyloBayes under a fixed topology. All analyses were carried out using the APE package (Paradis et al. 2004) within the R statistical environment (The The R Development Core Team 2004).
Testing relative rate variations between tunicates and vertebrates using local clocks.
Given the depth of the divergences involved in our phylogeny, all following analyses were conducted at the amino-acid level in an effort to minimize the misleading effects of
saturation. The tree topology previously obtained from the Bayesian CAT+ analyses of the concatenated amino-acid dataset was used as a reference, and the variation of evolutionary rates between the tunicate and vertebrate lineages was assessed using the program CODEML of the PAML package version 4.2 (Yang 2007).
We first specified two local clock models (using option Clock=2 in CODEML): (1) a two-rate model, where all branches in our phylogeny conform with the clock assumption and have a default rate (r0 = 1) to the exception of the Olfactores clade, encompassing tunicate and
vertebrate branches, which was assumed to have a different rate r1; and (2) a three-rate model
in which tunicate and vertebrate branches were assigned distinct rates, r1 and r2.
ML analyses were performed under these two local clock models on the concatenated dataset as well as on each individual gene alignment. Given that the first model is
11
likelihood ratio tests (LRTs) (Felsenstein 1981), with degrees of freedom equal to one (i.e., the difference in the number of parameters included in the models). The associated p-values were corrected for multiple testing (e-values), by being multiplied by the total number of genes tested in parallel according to a Bonferroni correction (Boorsma et al. 2005). In these tests, the two-rate model (1) represented the null hypothesis that the rate of evolution is homogenous between tunicates and vertebrates.
Protein evolutionary rate estimation under autocorrelated models
Because of practical constraints in using the program MULTIDIVTIME (Thorne et al. 1998), all amino-acid alignments for the 35 orthologous markers were slightly modified in order to ensure the presence of one non-bilaterian outgroup taxa in each gene dataset. In this respect,
Nematostella sequences had to be removed from all gene alignments because this taxon was
missing for some genes. The missing sequences of Reniera (genes rpl10l and rplp2) were replaced by the corresponding orthologs of its relative Suberites domuncula, in order to obtain a complete poriferan outgroup.
For each of the 35 resulting protein datasets, branch-specific rates of amino acid substitution were estimated with MULTIDIVTIME under the JTT model. We used the previously defined reference topology after pruning Nematostella, and set the prior age of the root at 700 Mya (Douzery et al. 2004) with no additional constraints on nodes. Two
independent MCMC were launched and run for 1 million generations, sampling every 100 generations and discarding the first 100,000 as the burnin. The rates assigned to terminal branches were taken as species-specific evolutionary rates expressed as the number of amino-acid replacements per 100 sites per million year (Myr).
12
Estimation of non-synonymous and synonymous substitution rates in Olfactores
Given the extent of substitutional saturation at the large-scale in our dataset, we selected the three pairs of more closely related species to estimate the ω = dN / dS ratio for tunicates,
teleosts and mammals. This criterion resulted in the following pairs being selected: Ciona
intestinalis and Ciona savignyi for tunicates, Danio rerio – Tetraodon nigroviridis for
teleosts, and Monodelphis domestica – Homo sapiens for mammals.
From the 35 previously assembled individual gene datasets, we extracted the
sequences of the six afore-mentioned taxa. Nucleotide alignments were then processed using Gblocks in order to exclude all codons that contained gaps (option: no gap positions allowed). Five markers (psmb1, rplP2, rpl35A, rpl39L and rpsA) had to be discarded during this process because of too many missing characters. Thirty genes were thus analyzed, encompassing in total 19,083 nucleotide sites or 6,361 codons for the three selected pairs of tunicate, teleost and mammal species.
The numbers of synonymous substitutions per synonymous sites (dS) and
non-synomymous substitutions per non-synonymous sites (dN) were estimated for each of the
three species pairs and all thirty housekeeping genes, using the ML method of Goldman and Yang (Goldman and Yang 1994), implemented in CODEML (options seqtype = 1, runmode = -1 and CodonFreq = 2). Similar results were also obtained when analyses were repeated using the YN00 counting method (Yang et al. 2000) implemented in CODEML. Three genes for which a dS greater than 10 was obtained (rpl15, rpl7 and sars) were excluded, as they
undoubtedly present unreliable estimates due to strong substitutional saturation through time. Finally, the distributions of the synonymous and non-synonymous substitution rate (dS and
dN) estimates for tunicates, teleosts and mammals across the 27 retained housekeeping genes
13
Results
Microcosmus squamiger 454 transcriptome sequencing and identification of orthologs The 454 sequencing of the Microcosmus squamiger partial transcriptome on the GS FLX standard platform yielded about 50 million high quality bases in total, which correspond to 211,899 sequence reads with a mean length of 250 bp. Similarity searches using BLASTN against either the intersection between Ciona intestinalis and Ciona savignyi orthologous genes (9,520 genes) or the Ciona intestinalis full transcriptome (19,858 transcripts) resulted in 46,245 and 48,455 matching reads corresponding to 216 and 245 genes, respectively. When using TBLASTX searches, the total number of putative homologous read sequences to Ciona orthologs was raised to 126,830 belonging to 834 genes.
At a larger taxonomic scale, positive BLAST results were obtained for about 11 % of the total number of Microcosmus reads which matched 68 of the 179 initially targeted nuclear protein-coding genes conserved across metazoans. Among these, 35 genes for which
orthology was unequivocally assessed were finally retained. The 35 orthologous gene sequences for Microcosmus squamiger were finally assembled from a total of 24,209 matching reads, with a mean coverage of 691 ± 24 reads per gene reflecting the high
expression level of these housekeeping genes. According to the Gene Ontology (Ashburner et al. 2000), the 35 genes (Table 1) were mostly involved in translational elongation (ribosomal proteins) but also in metabolic or catabolic processes (AHCY, SUCLG1, PSMA6, PSMB1,
HSP90AB1), glycolysis (PDHB), RNA splicing (U2AF1), tRNA processing (SARS), and
14
Tunicate phylogenetics based on 35 housekeeping genes
Saturation plots revealed a high degree of substitutional saturation at 3rd codon positions
compared to positions 1 and 2 and amino acids (Fig. 1). Consequently, 3rd codon positions
were excluded from subsequent phylogenetic analyses of the nucleotide dataset. Phylogenetic reconstructions conducted at both the amino acid and nucleotide levels using ML and BI approaches under standard and mixture models of sequence evolution yielded almost identical trees. The resulted phylogenetic picture (Fig. 2) conforms to the widely accepted view of animal evolution (Telford 2006) according to which Bilateria can be divided into Protostomia and Deuterostomia, the former embracing two reciprocally monophyletic lineages;
Lophotrochozoa (PPaa = 1, BPaa = 98, PPnt = 0.98, BPnt = 98) and Ecdysozoa (PPaa = 1, BPaa =
99, PPnt = 1, BPnt = 100). All analyses were highly congruent as far as the monophyletic
origin of Protostomia was concerned (PPaa = 0.99, BPaa = 93, PPnt = 1, BPnt = 81), yet
Deuterostomia relationships appeared more difficult to resolve, particularly in ML trees (PPaa
= 0.89, BPaa < 50, PPnt = 0.87, BPnt < 50). In details, ML analyses on nucleotide positions 1
and 2 under the standard GTR+ model yielded a ML tree where Xenambulacraria (Xenoturbella + Hemichordata + Echinodermata) appeared as the sister-group of all other bilaterians thereby disrupting deuterostome monophyly, although without statistical support (BPnt < 50). In ML analyses of the amino acid dataset under the CAT-C20+ model,
Xenoturbella emerged as the sister-group of the remaining bilaterians (BPaa < 50) and
Branchiostoma clustered with Ambulacraria with moderate support (BPaa = 77). As pointed
out, no significant nodal support was obtained for neither conformations, and similar results were previously shown to likely represent phylogenetic reconstruction artifacts (Bourlat et al. 2006; Delsuc et al. 2008), although the phylogenetic position of Xenoturbella is still
15
Within Chordata, a sister-group relationship of tunicates with vertebrates was
unequivocally recovered with all methods and datasets (PPaa = 1, BPaa = 94, PPnt = 1, BPnt =
95). Of note, the Olfactores clade is retrieved from nucleotide-based reconstructions, giving further credit to the robustness of the new chordate phylogeny and suggesting that the core of 35 housekeeping genes we considered carries a strong phylogenetic signal largely congruent with that of larger phylogenomic datasets (Delsuc et al. 2006; Delsuc et al. 2008; Dunn et al. 2008; Putnam et al. 2008).
Similarly, the 35 phylogenetic markers appeared informative enough to provide a clear-cut phylogenetic picture within each group. The newly sequenced Microcosmus
squamiger was found firmly branched with Halocynthia (PPaa = 1, BPaa = 100, PPnt = 1, BPnt
= 100), a relationship consistent with the traditional classification, both species belonging to the same order and family (Stolidobranchia: Puyridae). Likewise, the resulting relationships for the remaining tunicate species appeared highly concordant with recent phylogenies inferred from 18S rRNA data (Tsagkogeorga et al. 2009).
For the majority of species, branch length estimates obtained from phylogenetic reconstructions based on amino acid data were similar to those inferred from nucleotide sequences, to the exception of some fast-evolving taxa within Ecdysozoa and Tunicata.
Oikopleura dioica constitutes such an exception, since its DNA branch length is 1.6 times
longer than its amino acid one, with the mean ratio for the other tunicate branches being equal to 1.1. Moreover, Oikopleura dioica was found to exhibit a highly distinct compositional profile in PCA analyses (data not shown), occupying an outlier position relative to the other tunicate and deuterostome taxa, and being close to Caenorhabitis elegans, the second fastest-evolving species in our phylogeny (see Fig. 2).
16
Individual gene rate differences between tunicates and vertebrates under local clocks
In all phylogenetic trees inferred from the full dataset of 35 proteins, tunicates displayed the longest branches within Chordata indicating an overall faster evolutionary rate than
vertebrates and cephalochordates. In order to test whether this acceleration affects all genes to a similar extent, we followed a ML approach to obtain relative rate estimates for the two Olfactores lineages in each orthologous gene. LRTs between a constant-rate model and a variable-rate model allowed us to test for statistical significance in rate differences between the two groups. The results indicated that the relative rate of amino acid replacement in tunicates and vertebrates significantly differs between the two groups for 20 genes (Supplementary Table). The tunicate rate was consistently found to be superior to the vertebrate rate for all the afore-mentioned 20 genes, upholding the assumption of tunicate rapid evolution for the housekeeping genes considered. Moreover, the rate ratio estimates ranged from 1.4 to 7.5 depending on the marker, which implies that the evolutionary shift in tunicate rates has not affected all genes to a similar extent (Fig. 3).
Unexpectedly, although the rate ratio for the remaining 15 genes was superior to 1, except for three of them (rplp2, rpl12 and rpl39l), the LRTs did not significantly reject the hypothesis of equal rate between the two groups. Thereby, in these cases the evolutionary rate within Olfactores may be considered roughly constant, a result providing evidence that
tunicates do carry genes that have escaped the prevalent genomic acceleration. The outline of the estimated rate variation within Olfactores is shown in Fig. 4 which illustrates the global rate contrast between tunicates and vertebrates across the 35 proteins. When the same analytical protocol was applied to the concatenated dataset, an overall rate ratio of 1.9 was obtained.
17
Within-group rate variation under an autocorrelated model of rate evolution
Given the extensive variation in rate among genes, we next asked whether similar fluctuations can also be observed in species rates, and if yes, how they are linked to the afore-described contrasts. Do all tunicates contribute equally to the estimated rate differences among
chordates, or the large range of among-gene variation is rather driven by only few species? To answer this question, we estimated the rate of amino acid replacement in all branches of our phylogeny over the 35 housekeeping genes using an autocorrelated model of rate evolution (Thorne et al. 1998). This allowed us to simultaneously explore two aspects of rate variation within Chordata: both across genes, and across branches of its three subclades.
The branch-specific rate distributions for tunicates, vertebrates, and cephalochordates have been estimated across the 35 molecular markers (Fig. 5). All branches of the tunicate clade were characterized by an accelerated evolutionary rate as compared to the other
chordate groups, whereas the lineage-specific estimates were found to vary extensively across the sampled species. This yielded a particularly heterogeneous picture for tunicate rates, which contrasted sharply with the more homogeneous and mostly overlapping rate distributions of vertebrates, and the slow evolutionary rate characterizing the amphioxus
Branchiostoma floridae (Fig. 5). More precisely, the two phlebobranch ascidians (Ciona
intestinalis and C. savignyi) seemed to exhibit the lowest rates among tunicates, with the
stolidobranchs (Halocynthia roretzi, Microcosmus squamiger and Molgula tectiformis) following next, conforming to previously reported phylogenetic observations (Tsagkogeorga et al. 2009; Yokobori et al. 2006; Zeng et al. 2006). Interestingly, the evolutionary rate
heterogeneity appeared radically lessened when considering species of the same order, as best exemplified by the overlap of the gene rate distributions within Stolidobranchia. Notably, the aplousobranch Diplosoma listerianum and, particularly, the appendicularian Oikopleura
18
values of all other sampled tunicates in particular, and chordates in general. These two representatives were also characterized by the largest variance in estimates across genes, illustrated by the wide quartiles of their rate distributions (Fig. 5).
Considering the results of the previous local clock analyses, we finally examined the among-branch variation separately for the 20 genes that showed significantly higher
evolutionary rates in tunicates, and the remaining 15 genes for which LRTs did not reject the hypothesis of a homogeneous rate among Olfactores. As expected, rate estimates considering the latter 15 genes yielded a more even rate variation across Chordata (Fig. 6). Interestingly, this more homogeneous picture among chordate lineages appeared to stand mainly in the decrease of Diplosoma listerianum and Oikopleura dioica rates. The two Ciona species, and the three stolidobranch ascidians (Halocynthia roretzi, Microcosmus squamiger and Molgula
tectiformis) showed rate profiles almost identical when considering either the full dataset or
the two subsets of 20 and 15 genes respectively (Fig. 6).
dN/dS ratio variation among lineages
The synonymous and non-synonymous rate ratios (dN/dS), as estimated for the three most
closely related species pairs Ciona intestinalis – Ciona savignyi, Danio rerio – Tetraodon
nigroviridis and Monodelphis domestica – Homo sapiens, respectively, and across a subset of
27 genes are shown in Fig. 7. All dN/dS estimates were much less than 1 reflecting the fact
that the set of examined genes is under strong purifying selection in all represented lineages. This is consistent with the fact that every gene of our analysis is conserved at a notably large taxonomic scale with most of them involved in fundamental housekeeping functions of the cell.
Overall, the
19
compared to the others, ruling out the hypothesis that the observed evolutionary rate variation is due to a relaxation of selective constraints in one particular lineage. Instead, the resulting picture of
similar global distributions of dN/dS observed for tunicates, teleosts and mammals (Fig. 8).
Discussion
Determining new phylogenetic markers for tunicates using 454 sequencing
Over the past four years, massively parallel sequencing platforms have become available, enabling the generation of large amounts of genomic data at extremely short times and accessible costs (Shendure and Ji 2008). Using such technologies for tunicates seemed a promising perspective from a phylogenetic and comparative genomics standpoint, mainly because this lineage is far from satisfying the prerequisites for the successful development of phylogenetic markers through traditional PCR approaches. Evolving at elevated rates, tunicate protein-coding genes exhibit high levels of sequence divergence leading to large amounts of saturation, even when considering closely related species such as Ciona intestinalis and C.
savignyi. Thereby, the identification of conserved regions in a gene, suitable for primer
designation, appears to be a particularly difficult task. As a result, besides whole-genome projects, the currently available genomic information for tunicates comes from EST and cDNA sequencing projects that do not technically require a priori information and low sequence divergence (Blaxter and Thomas 2004; Gyoja et al. 2007; Kim et al. 2008).
Here, we applied for the first time the high-throughput 454 technology (Margulies et al. 2005) to sequence the partial transcriptome of an ascidian tunicate, Microcosmus
squamiger. This invasive species recently became widespread in the western Mediterranean
20
parts of the world (Rius et al. 2008; Rius et al. 2009). We sought to identify orthologous sequences for a set of 179 previously determined phylogenetic markers used in large-scale comparative analyses (Delsuc et al. 2008). At the time this work was conceived, the 454 sequencing system generated an average of 100 megabases per run, at short 250 base-pair reads. Still this approach permitted us to determine in silico 68 homologous genes, among which 35 were unambiguously identified as orthologous sequences to our query genes.
Although this might seem a small number compared to the initial 50 million base pairs of resulting data, several factors argue for the great potential of the 454 sequencing approach in tunicate phylogenetics and comparative genomics. First, the sequencing of the
Microcosmus transcriptome was conducted on a cDNA library that was not normalized. This
yielded an important level of coverage or/and redundancy for highly expressed genes in our data, and the 35 housekeeping genes corresponded to a non-negligible amount of 24,209 sequence reads (i.e. about 10% of the initial 211,899 reads). Second, albeit high-throughput sequencing alleviates bench problems, the fast-evolving nature of tunicate species has still a substantial impact on the post-data analyses by hindering the reliable assignment of orthology between highly divergent sequences. Analyses of the Ciona intestinalis genome have
demonstrated that in a transcriptome composed of 16,000 genes, only a small fraction (5%) matched to vertebrate genomes, whereas about 60% of the genes are shared with protostome animals (Dehal et al. 2002). In this respect, the limited sequence length of the 454 GS FLX standard platform at the time has reinforced the problem, since short sequences are difficult to assign with confidence through similarity searches.
In conclusion, considering tunicate scarcity in genomic data and available
phylogenetic markers, the results from our pilot application of the 454 sequencing approach to the group appears promising. Given the ongoing advances of these high-throughput sequencing technologies in terms of layout, it can be foreseen that the 454 sequencing
21
approach will represent a compelling tool for the construction of large comparative datasets allowing for more comprehensive studies on tunicate phylogenetics and molecular evolution in the near future.
Tunicates evolve twice as fast as vertebrates, but not all genes nor all lineages are equal determinants of this contrast
To quantify the tunicate molecular divergence in a comparative chordate framework, we assessed evolutionary rate variation within Chordata on the basis of 35 housekeeping genes. Overall, our results suggested that tunicates have experienced a nearly twofold faster
evolution compared to their vertebrate counterparts within Olfactores (Fig. 4), whereas the cephalochordate rate pattern appeared fairly similar to that of vertebrates (Fig. 5).
From a gene standpoint, shifts in tunicate rates have been detected in the majority of the examined genes, yet the degree of the predicted acceleration varied extensively across genes. Our estimates indicated a 1.4- to an uppermost 8- fold accelerated rate for tunicates versus vertebrates depending on the gene, clearly suggesting that not all genes are equal determinants of rate discrepancies within Chordata (Fig. 3). For a substantial proportion of genes (15 out of 35 genes), the estimated evolutionary rate in tunicates was not significantly different from that of vertebrates (Table 2). This result implies that despite the generally striking genomic divergence (Dehal et al. 2002; Seo et al. 2001; Small et al. 2007b), at least some coding parts of tunicate genomes have escaped the prevalent acceleration bursts.
Considering lineage-specific rate profiles, Phlebobranchia and Stolidobranchia exhibited lower among-gene variation. The inclusion of Microcosmus allowed expanding the taxonomic coverage of Stolidobranchia, providing clues for a rather uniform rate at the ordinal taxonomic level. Finally, Aplousobranchia and, particularly, Appendicularia were characterized instead by the highest and the more heterogeneous rates across the examined markers.
22
In overview, tunicates presented a propensity for extensive rate variation across genes and lineages but certainly our results cannot be generalized to a genome scale, since 35 housekeeping genes constitute only a small portion of the chordate gene repertoire. Due to the necessity of accurate orthology assessment among compared sequences, studies in
comparative genomics are frequently based on highly conserved molecular markers, being most of the time restricted to only few functional classes of genes. The main challenge for forthcoming studies would be to counterbalance the trade-off between fast-evolving
sequences and orthology assessment, in order to explore tunicate, and thereby chordate, rate variation at a larger scale. This would allow testing the validity of two prefatory hypotheses issued from this work: (1) The high heterogeneity of across-gene rates of protein evolution and (2) the preponderant impact of Appendicularia and Aplousobranchia on the whole image of chordate evolutionary rate variation.
From another point of view, it would also be interesting to attempt lower taxonomic scale analyses, with the goal to decrease the evolutionary distance separating sampled species. The number of shared orthologous genes between two species is expected to be negatively correlated to their evolutionary distance, more closely relatives have thus a much broader potential in terms of number of molecular markers to be examined.
Insights into the underlying causes of tunicate accelerated evolution
Evolutionary rate shifts in protein-coding genes among as well as within lineages could result from different factors, such as changes on selective constraints and positive selection, or changes in mutation rates, i.e. a general acceleration of nucleotide substitutions (Nabholz et al. 2008). In a preliminary effort to understand the causes that drove the observed tunicate rate acceleration, we compared synonymous (dS) and non-synonymous (dN) rates of Ciona
23
The dN/dS ratio was roughly similar for the three lineages, albeit some pronounced
differences were observed for some genes (Fig. 7). Tunicates were not systematically
associated with higher dN/dS, and no signature of positive selection was traced in our data. On
the contrary, all examined genes evolved under strong purifying or negative selection, which in conjunction with the rather uniform picture of (Fig. 8) implies that tunicate rate shift with regards to vertebrates, and also chordates, most probably resulted from an increase of their mutation rate rather than changes in selection regime.
Yet a generalization of these findings would be premature, obviously because of the limited gene sampling considered, but also because our estimations, of dS particularly, might
suffer from the uncertainty due to the putatively confounding effects of saturation
(Kryazhimskiy and Plotkin 2008) and from potential branch length effects (Wolf et al. 2009). Underestimated dS might indeed explain why we observe essentially similar dN/dS ratio in
tunicates and vertebrates, although the former have presumably larger population sizes than the latter (Small et al. 2007a) – theory would predict more efficient purifying selection, and hence reduced dN/dS ratio, in large populations (Charlesworth 2009). Still, as a first insight into the causes of tunicate acceleration, our results should stimulate a more thorough research for the underlying determinant of mutation rate variation within tunicates. Variability in mutation rate has been so far attributed to a number of intrinsic factors, such as generation time and metabolic rate, mating system and, more recently, longevity (Nabholz et al. 2008). Undoubtedly, the highly diversified life-history traits of the group, encompassing for example both sexually and asexually reproducing species (Lambert 2005), provide a challenging ground for identifying links between changes in mutation rates and environmental, functional and biological factors such as population size.
24
Conclusions
In this study, the comparative analysis of 35 highly conserved nuclear genes at both amino acid and nucleotide levels provides a first assessment of the within-chordate rate variation and bears a round of elements worth to be tested in larger-scale analyses. More precisely, our results revealed (1) a two-fold faster evolution of tunicates as compared to other chordates; (2) a marked asymmetry and heterogeneity in tunicate evolutionary rates, both across genes and among major lineages; (3) the prevailing effects of Appendicularia and Aplousobranchia in the extent of rate contrasts within Chordata; and finally (4) the predominant role of changes in mutation rate as the most probable underlying cause of tunicate accelerated genomic
evolution.
Acknowledgments
We thank the associated editor and two anonymous referees for their constructive comments. This work has been supported by the Research Networks Program in
Bioinformatics of the High Council for Scientific and Technological Cooperation between France and Israel, by the European Research Council (“PopPhyl”: Population
Phylogenomics), and benefited from the ISE-M computing cluster. This is contribution ISEM 2010-049 of the Institut des Sciences de l’Evolution de Montpellier (UMR 5554 - CNRS).
References
Altschul SF, Gish W, Miller W, Myers EW, Lipman DJ (1990) Basic local alignment search tool. J Mol Biol 215:403-10
Ashburner M, Ball CA, Blake JA, Botstein D, Butler H, Cherry JM, Davis AP, Dolinski K, Dwight SS, Eppig JT, Harris MA, Hill DP, Issel-Tarver L, Kasarskis A, Lewis S, Matese JC, Richardson JE, Ringwald M, Rubin GM, Sherlock G (2000) Gene
25
ontology: tool for the unification of biology. The Gene Ontology Consortium. Nat Genet 25:25-9
Blaxter M, Thomas J (2004) A survey of genes expressed in the seasquirt Diplosoma listerianum. Unpublished
Boorsma A, Foat BC, Vis D, Klis F, Bussemaker HJ (2005) T-profiler: scoring the activity of predefined groups of genes using gene expression data. Nucleic Acids Res 33:W592-5
Bourlat SJ, Juliusdottir T, Lowe CJ, Freeman R, Aronowicz J, Kirschner M, Lander ES, Thorndyke M, Nakano H, Kohn AB, Heyland A, Moroz LL, Copley RR, Telford MJ (2006) Deuterostome phylogeny reveals monophyletic chordates and the new phylum Xenoturbellida. Nature 444:85-8
Bourlat SJ, Nielsen C, Economou AD, Telford MJ (2008) Testing the new animal phylogeny: a phylum level molecular analysis of the animal kingdom. Mol Phylogenet Evol 49:23-31
Cameron CB, Garey JR, Swalla BJ (2000) Evolution of the chordate body plan: new insights from phylogenetic analyses of deuterostome phyla. Proc Natl Acad Sci USA 97:4469-74
Cañestro C, Bassham S, Postlethwait JH (2003) Seeing chordate evolution through the Ciona genome sequence. Genome Biol 4:208
Cañestro C, Postlethwait JH (2007) Development of a chordate anterior-posterior axis without classical retinoic acid signaling. Dev Biol 305:522-38
Castresana J (2000) Selection of conserved blocks from multiple alignments for their use in phylogenetic analysis. Mol Biol Evol 17:540-52
Charlesworth B (2009) Fundamental concepts in genetics: effective population size and patterns of molecular evolution and variation. Nat Rev Genet 10:195-205
Cone AC, Zeller RW (2005) Using ascidian embryos to study the evolution of developmental gene regulatory networks. Can J Zool 83:75-89
Davidson B (2007) Ciona intestinalis as a model for cardiac development. Semin Cell Dev Biol 18:16-26
Dehal P, Boore JL (2005) Two rounds of whole genome duplication in the ancestral vertebrate. PLoS Biol 3:e314
Dehal P, Satou Y, Campbell RK, Chapman J, Degnan B, De Tomaso A, Davidson B, Di Gregorio A, Gelpke M, Goodstein DM, Harafuji N, Hastings KE, Ho I, Hotta K, Huang W, Kawashima T, Lemaire P, Martinez D, Meinertzhagen IA, Necula S, Nonaka M, Putnam N, Rash S, Saiga H, Satake M, Terry A, Yamada L, Wang HG, Awazu S, Azumi K, Boore J, Branno M, Chin-Bow S, DeSantis R, Doyle S, Francino P, Keys DN, Haga S, Hayashi H, Hino K, Imai KS, Inaba K, Kano S, Kobayashi K, Kobayashi M, Lee BI, Makabe KW, Manohar C, Matassi G, Medina M, Mochizuki Y, Mount S, Morishita T, Miura S, Nakayama A, Nishizaka S, Nomoto H, Ohta F, Oishi K, Rigoutsos I, Sano M, Sasaki A, Sasakura Y, Shoguchi E, Shin-i T, Spagnuolo A, Stainier D, Suzuki MM, Tassy O, Takatori N, Tokuoka M, Yagi K, Yoshizaki F, Wada S, Zhang C, Hyatt PD, Larimer F, Detter C, Doggett N, Glavina T, Hawkins T,
26
genome of Ciona intestinalis: insights into chordate and vertebrate origins. Science 298:2157-67
Delsuc F, Brinkmann H, Chourrout D, Philippe H (2006) Tunicates and not
cephalochordates are the closest living relatives of vertebrates. Nature 439:965-8 Delsuc F, Tsagkogeorga G, Lartillot N, Philippe H (2008) Additional molecular support for
the new chordate phylogeny. Genesis 46:592-604
Donmez N, Bazykin GA, Brudno M, Kondrashov AS (2009) Polymorphism due to multiple amino acid substitutions at a codon site within Ciona savignyi. Genetics 181:685-90 Douzery EJ, Snell EA, Bapteste E, Delsuc F, Philippe H (2004) The timing of eukaryotic
evolution: does a relaxed molecular clock reconcile proteins and fossils? Proc Natl Acad Sci USA 101:15386-91
Dunn CW, Hejnol A, Matus DQ, Pang K, Browne WE, Smith SA, Seaver E, Rouse GW, Obst M, Edgecombe GD, Sorensen MV, Haddock SH, Schmidt-Rhaesa A, Okusu A, Kristensen RM, Wheeler WC, Martindale MQ, Giribet G (2008) Broad phylogenomic sampling improves resolution of the animal tree of life. Nature 452:745-9
Edvardsen RB, Lerat E, Maeland AD, Flat M, Tewari R, Jensen MF, Lehrach H, Reinhardt R, Seo HC, Chourrout D (2004) Hypervariable and highly divergent intron-exon
organizations in the chordate Oikopleura dioica. J Mol Evol 59:448-57
Felsenstein J (1981) Evolutionary trees from DNA sequences: a maximum likelihood approach. J Mol Evol 17:368-76
Felsenstein J (2005) PHYLIP (Phylogeny Inference Package) In: Department of Genome Sciences UoW (ed), Seattle
Gissi C, Iannelli F, Pesole G (2008) Evolution of the mitochondrial genome of Metazoa as exemplified by comparison of congeneric species. Heredity 101:301-20
Gissi C, Pesole G, Cattaneo E, Tartari M (2006) Huntingtin gene evolution in Chordata and its peculiar features in the ascidian Ciona genus. BMC Genomics 7:288
Goldman N, Yang Z (1994) A codon-based model of nucleotide substitution for protein-coding DNA sequences. Mol Biol Evol 11:725-36
Goldstone JV, Goldstone HM, Morrison AM, Tarrant A, Kern SE, Woodin BR, Stegeman JJ (2007) Cytochrome P450 1 genes in early deuterostomes (tunicates and sea urchins) and vertebrates (chicken and frog): origin and diversification of the CYP1 gene family. Mol Biol Evol 24:2619-31
Guindon S, Gascuel O (2003) A simple, fast, and accurate algorithm to estimate large phylogenies by maximum likelihood. Syst Biol 52:696-704
Gyoja F, Satou Y, Shin-i T, Kohara Y, Swalla BJ, Satoh N (2007) Analysis of large scale expression sequenced tags (ESTs) from the anural ascidian, Molgula tectiformis. Dev Biol 307:460-82
Hejnol A, Obst M, Stamatakis A, Ott M, Rouse GW, Edgecombe GD, Martinez P, Baguna J, Bailly X, Jondelius U, Wiens M, Muller WE, Seaver E, Wheeler WC, Martindale MQ, Giribet G, Dunn CW (2009) Assessing the root of bilaterian animals with scalable phylogenomic methods. Proc Biol Sci 276:4261-70
27
Holland LZ, Gibson-Brown JJ (2003) The Ciona intestinalis genome: when the constraints are off. Bioessays 25:529-32
Huang X, Madan A (1999) CAP3: A DNA sequence assembly program. Genome Res 9:868-77
Ikuta T, Yoshida N, Satoh N, Saiga H (2004) Ciona intestinalis Hox gene cluster: Its
dispersed structure and residual colinear expression in development. Proc Natl Acad Sci USA 101:15118-23
Imai KS, Levine M, Satoh N, Satou Y (2006) Regulatory blueprint for a chordate embryo. Science 312:1183-7
Jobb G, von Haeseler A, Strimmer K (2004) TREEFINDER: a powerful graphical analysis environment for molecular phylogenetics. BMC Evol Biol 4:18
Katoh K, Kuma K, Toh H, Miyata T (2005) MAFFT version 5: improvement in accuracy of multiple sequence alignment. Nucleic Acids Res 33:511-8
Kim JH, Waterman MS, Li LM (2007) Diploid genome reconstruction of Ciona intestinalis and comparative analysis with Ciona savignyi. Genome Res 17:1101-10
Kim YO, Cho HK, Park EM, Nam BH, Hur YB, Lee SJ, Cheong J (2008) Generation of expressed sequence tags for immune gene discovery and marker development in the sea squirt, Halocynthia roretzi. J Microbiol Biotechnol 18:1510-7
Kimbacher S, Gerstl I, Velimirov B, Hagemann S (2009) Drosophila P transposons of the urochordata Ciona intestinalis. Mol Genet Genomics 282:165-72
Kowalevski A (1868) Beiträge zur Entwicklungsgeschichte der Tunicaten. Nachrichten Gesellschaft Wissenschaften Göttingen 19:401-415
Kryazhimskiy S, Plotkin JB (2008) The population genetics of dN/dS. PLoS Genet 4:e1000304
Lambert C (2005) Historical introduction, overview, and reproductive biology of the protochordates. Can J Zool 83:1-7
Lartillot N, Lepage T, Blanquart S (2009) PhyloBayes 3. A Bayesian software package for phylogenetic reconstruction and molecular dating. Bioinformatics 25:2286-2288 Lartillot N, Philippe H (2004) A Bayesian mixture model for across-site heterogeneities in
the amino-acid replacement process. Mol Biol Evol 21:1095-109
Le SQ, Gascuel O, Lartillot N (2008) Empirical profile mixture models for phylogenetic reconstruction. Bioinformatics 24:2317-23
Mallatt J, Winchell CJ (2007) Ribosomal RNA genes and deuterostome phylogeny revisited: more cyclostomes, elasmobranchs, reptiles, and a brittle star. Mol Phylogenet Evol 43:1005-22
Margulies M, Egholm M, Altman WE, Attiya S, Bader JS, Bemben LA, Berka J, Braverman MS, Chen YJ, Chen Z, Dewell SB, Du L, Fierro JM, Gomes XV, Godwin BC, He W, Helgesen S, Ho CH, Irzyk GP, Jando SC, Alenquer ML, Jarvie TP, Jirage KB, Kim JB, Knight JR, Lanza JR, Leamon JH, Lefkowitz SM, Lei M, Li J, Lohman KL, Lu H, Makhijani VB, McDade KE, McKenna MP, Myers EW, Nickerson E, Nobile JR, Plant
28
R, Puc BP, Ronan MT, Roth GT, Sarkis GJ, Simons JF, Simpson JW, Srinivasan M, Tartaro KR, Tomasz A, Vogt KA, Volkmer GA, Wang SH, Wang Y, Weiner MP, Yu P, Begley RF, Rothberg JM (2005) Genome sequencing in microfabricated high-density picolitre reactors. Nature 437:376-80
Nabholz B, Glemin S, Galtier N (2008) Strong variations of mitochondrial mutation rate across mammals--the longevity hypothesis. Mol Biol Evol 25:120-30
Paradis E, Claude J, Strimmer K (2004) APE: Analyses of Phylogenetics and Evolution in R language. Bioinformatics 20:289-90
Perez-Portela R, Bishop JD, Davis AR, Turon X (2009) Phylogeny of the families Pyuridae and Styelidae (Stolidobranchiata, Ascidiacea) inferred from mitochondrial and nuclear DNA sequences. Mol Phylogenet Evol 50:560-70
Philippe H, Sorhannus U, Baroin A, Perasso R, Gasse F, Adoutte A (1994) Comparison of molecular and paleontological data in diatoms suggests a major gap in the fossil record. J Evol Biol 7:247-265
Putnam NH, Butts T, Ferrier DE, Furlong RF, Hellsten U, Kawashima T, Robinson-Rechavi M, Shoguchi E, Terry A, Yu JK, Benito-Gutierrez EL, Dubchak I, Garcia-Fernandez J, Gibson-Brown JJ, Grigoriev IV, Horton AC, de Jong PJ, Jurka J, Kapitonov VV, Kohara Y, Kuroki Y, Lindquist E, Lucas S, Osoegawa K, Pennacchio LA, Salamov AA, Satou Y, Sauka-Spengler T, Schmutz J, Shin IT, Toyoda A, Bronner-Fraser M, Fujiyama A, Holland LZ, Holland PW, Satoh N, Rokhsar DS (2008) The amphioxus genome and the evolution of the chordate karyotype. Nature 453:1064-71
Rius M, Pascual M, Turon X (2008) Phylogeography of the widespread marine invader Microcosmus squamiger (Ascidiacea) reveals high genetic diversity of introduced populations and non-independent colonizations. Divers Distrib 14
Rius M, Turon X, Marshall DJ (2009) Non-lethal effects of an invasive species in the marine environment: the importance of early life-history stages. Oecologia 159:873-82 Satoh N (2003) The ascidian tadpole larva: comparative molecular development and
genomics. Nat Rev Genet 4:285-95
Seo HC, Edvardsen RB, Maeland AD, Bjordal M, Jensen MF, Hansen A, Flaat M, Weissenbach J, Lehrach H, Wincker P, Reinhardt R, Chourrout D (2004) Hox
cluster disintegration with persistent anteroposterior order of expression in Oikopleura dioica. Nature 431:67-71
Seo HC, Kube M, Edvardsen RB, Jensen MF, Beck A, Spriet E, Gorsky G, Thompson EM, Lehrach H, Reinhardt R, Chourrout D (2001) Miniature genome in the marine chordate Oikopleura dioica. Science 294:2506
Shendure J, Ji H (2008) Next-generation DNA sequencing. Nat Biotechnol 26:1135-45 Sierro N, Kusakabe T, Park KJ, Yamashita R, Kinoshita K, Nakai K (2006) DBTGR: a
database of tunicate promoters and their regulatory elements. Nucleic Acids Res 34:D552-5
Singh TR, Tsagkogeorga G, Delsuc F, Blanquart S, Shenkar N, Loya Y, Douzery EJ, Huchon D (2009) Tunicate mitogenomics and phylogenetics: peculiarities of the Herdmania momus mitochondrial genome and support for the new chordate phylogeny. BMC Genomics 10:534
29
Small KS, Brudno M, Hill MM, Sidow A (2007a) Extreme genomic variation in a natural population. Proc Natl Acad Sci USA 104:5698-703
Small KS, Brudno M, Hill MM, Sidow A (2007b) A haplome alignment and reference sequence of the highly polymorphic Ciona savignyi genome. Genome Biol 8:R41 Swalla BJ, Cameron CB, Corley LS, Garey JR (2000) Urochordates are monophyletic within
the deuterostomes. Syst Biol 49:52-64
Swalla BJ, Xavier-Neto J (2008) Chordate origins and evolution. Genesis 46:575-9
Swofford D (2002) PAUP*. Phylogenetic Analysis Using Parsimony (* and Other Methods). . Sinauer Associates Sunderland, Massachusetts
Tamura K, Dudley J, Nei M, Kumar S (2007) MEGA4: Molecular Evolutionary Genetics Analysis (MEGA) software version 4.0. Mol Biol Evol 24:1596-9
Telford MJ (2006) Animal phylogeny. Curr Biol 16:R981-5
Thorne JL, Kishino H, Painter IS (1998) Estimating the rate of evolution of the rate of molecular evolution. Mol Biol Evol 15:1647-57
Tsagkogeorga G, Turon X, Hopcroft RR, Tilak MK, Feldstein T, Shenkar N, Loya Y, Huchon D, Douzery EJ, Delsuc F (2009) An updated 18S rRNA phylogeny of tunicates based on mixture and secondary structure models. BMC Evol Biol 9:187
Turon X, Lopez-Legentil S (2004) Ascidian molecular phylogeny inferred from mtDNA data with emphasis on the Aplousobranchiata. Mol Phylogenet Evol 33:309-320
Winchell CJ, Sullivan J, Cameron CB, Swalla BJ, Mallatt J (2002) Evaluating hypotheses of deuterostome phylogeny and chordate evolution with new LSU and SSU ribosomal DNA data. Mol Biol Evol 19:762-76
Wolf JB, Kunstner A, Nam K, Jakobsson M, Ellegren H (2009) Nonlinear dynamics of nonsynonymous (dN) and synonymous (dS) substitution rates affects inference of selection. Genome Biol Evol 2009:308-19
Yandell M, Mungall CJ, Smith C, Prochnik S, Kaminker J, Hartzell G, Lewis S, Rubin GM (2006) Large-scale trends in the evolution of gene structures within 11 animal genomes. PLoS Comput Biol 2:e15
Yang Z (2007) PAML 4: phylogenetic analysis by maximum likelihood. Mol Biol Evol 24:1586-91
Yang Z, Nielsen R, Goldman N, Pedersen AM (2000) Codon-substitution models for heterogeneous selection pressure at amino acid sites. Genetics 155:431-49
Yokobori S, Kurabayashi A, Neilan BA, Maruyama T, Hirose E (2006) Multiple origins of the ascidian-Prochloron symbiosis: molecular phylogeny of photosymbiotic and non-symbiotic colonial ascidians inferred from 18S rDNA sequences. Mol Phylogenet Evol 40:8-19
Zeng L, Jacobs M, Swalla B (2006) Coloniality and sociality has evolved once in Stolidobranch ascidians. Integr Comp Biol 46:255-268
30
Zeng L, Swalla B (2005) Molecular phylogeny of the protochordates: chordate evolution. Can J Zool 83:24-33
31
TABLES
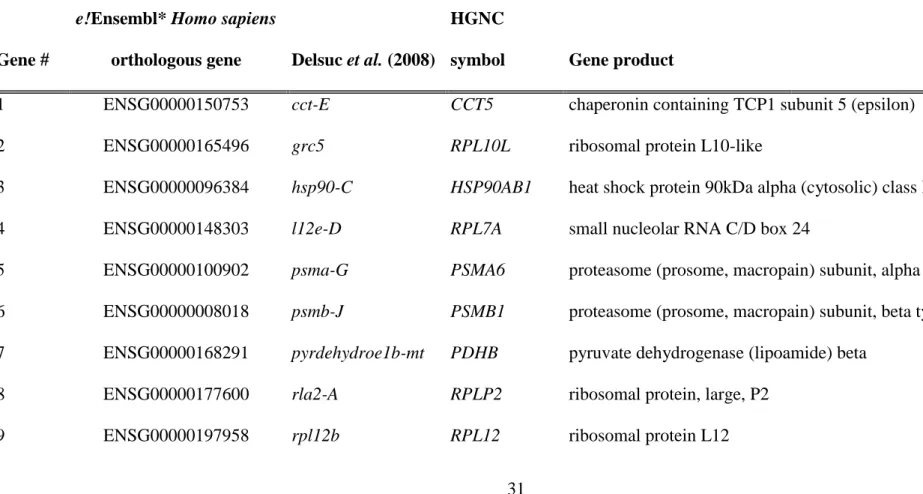
Table 1 — List of the 35 metazoan-conserved housekeeping genes for which orthologous sequences have been identified in the
transcriptome of Microcosmus squamiger. Markers corresponding to a subsample of the ones used in a recent phylogenomic study (Delsuc et
al. 2008) and for which, a nucleotide dataset was built upon in silico available data for 27 additional metazoan taxa.
Gene #
e!Ensembl* Homo sapiens
orthologous gene Delsuc et al. (2008)
HGNC
symbol Gene product
1 ENSG00000150753 cct-E CCT5 chaperonin containing TCP1 subunit 5 (epsilon)
2 ENSG00000165496 grc5 RPL10L ribosomal protein L10-like
3 ENSG00000096384 hsp90-C HSP90AB1 heat shock protein 90kDa alpha (cytosolic) class B member 1
4 ENSG00000148303 l12e-D RPL7A small nucleolar RNA C/D box 24
5 ENSG00000100902 psma-G PSMA6 proteasome (prosome, macropain) subunit, alpha type, 6
6 ENSG00000008018 psmb-J PSMB1 proteasome (prosome, macropain) subunit, beta type, 1
7 ENSG00000168291 pyrdehydroe1b-mt PDHB pyruvate dehydrogenase (lipoamide) beta
8 ENSG00000177600 rla2-A RPLP2 ribosomal protein, large, P2
32
10 ENSG00000167526 rpl13 RPL13 small nucleolar RNA, C/D box 68
11 ENSG00000174748 rpl15a RPL15 ribosomal protein L15
12 ENSG00000142541 rpl16b RPL13A small nucleolar RNA, C/D box 32A
13 ENSG00000063177 rpl18 RPL18 ribosomal protein L18
14 ENSG00000108298 rpl19a RPL19 ribosomal protein L19
15 ENSG00000166441 rpl27 RPL27A ribosomal protein L27a
16 ENSG00000161016 rpl2 RPL8 ribosomal protein L8
17 ENSG00000182899 rpl33a RPL35A ribosomal protein L35a
18 ENSG00000163923 rpl39 RPL39L ribosomal protein L39-like
19 ENSG00000100316 rpl3 RPL3 small nucleolar RNA, C/D box 43
20 ENSG00000174444 rpl4B RPL4 ribosomal protein L4
21 ENSG00000122406 rpl5 RPL5 small nucleolar RNA, C/D box 21
22 ENSG00000089009 rpl6 RPL6 60S ribosomal protein L6
23 ENSG00000147604 rpl7-A RPL7 ribosomal protein L7
24 ENSG00000089157 rpp0 RPLP0 ribosomal protein, large, P0
33
26 ENSG00000110700 rps13a RPS13 ribosomal protein S13
27 ENSG00000105193 rps16 RPS16 ribosomal protein S16
28 ENSG00000182498 rps18 RPS18 40S ribosomal protein S18
29 ENSG00000145425 rps1 RPS3A small nucleolar RNA, C/D box 73A
30 ENSG00000130041 rps27 RPS27 40S ribosomal protein S27
31 ENSG00000101444 sadhchydrolase-E1 AHCY adenosylhomocysteinase
32 ENSG00000168028 sap40 RPSA small nucleolar RNA, H/ACA box 62
33 ENSG00000031698 srs SARS seryl-tRNA synthetase
34 ENSG00000163541 suca SUCLG1 succinate-CoA ligase, alpha subunit
35 ENSG00000160201 u2snrnp U2AF1 U2 small nuclear RNA auxiliary factor 1
34
FIGURES
Fig. 1 — Levels of saturation inferred for first plus second codon positions, third
codon-positions and amino acids. All three plots represent the relationship between tree-inferred
distances and observed pairwise distances at nucleotide and amino acid level, respectively. Dotted lines represent the hypothesis of absence of saturation on the data, where estimated and observed distances are equal. Solid lines indicate the regression of the linear model fitted on the data.
Fig. 2 — Superimposition of the consensus Bayesian trees inferred from amino acids
and from first and second codon positions under the CAT+ site-heterogeneous mixture
model. Values at nodes represent Bayesian Posterior Probabilities (PP) / Maximum
Likelihood bootstrap percentage (BP) obtained for the amino acid (aa) and nucleotide (nt) datasets respectively (PPaa / BPaa / PPnt / BPnt).
Fig. 3 — Contrasting local molecular clock estimates among tunicates and vertebrates
for the 35 housekeeping proteins. The graph shows the tunicate/vertebrate rate ratio
estimated for each of the 35 genes. Black bars indicate genes for which rate differences between the two groups were not significant after correcting for multiple tests (LTR test, critical e-value = 0.05).
Fig. 4 — Average contrast of rate variation in amino acid replacements within
Olfactores. The figure illustrates tunicate (grey) and vertebrate (white) distributions of the
35
boxes give the quartiles; whiskers extend to 1.5 times the interquartile range; and circles are for outliers.
Fig. 5 — Branchwise distributions of tunicate, vertebrate and cephalochordate rates of
amino acid replacements as estimated under an autocorrelated rate model across 35
proteins. The top panel shows the Chordate sub-tree extracted from the reference tree with
numbering of the corresponding internal branches. In the bottom panel, tunicate rate distributions are shown in dark grey, vertebrates in white, and amphioxus in light grey. Horizontal bars give the median of rate distributions; boxes give the quartiles; whiskers extend to 1.5 times the interquartile range; and circles are for outliers.
Fig. 6 — Branchwise distributions of tunicate, vertebrate and cephalochordate rates of
amino acid replacements as estimated under an autocorrelated rate model across all 35
proteins, the 20 faster genes, and the 15 slower genes, respectively. All-gene distributions
are shown in light grey, the 20 faster-evolving-gene in dark grey and the slower-evolving-gene in white. Horizontal bars give the median of distributions; boxes give the quartiles; whiskers extend to 1.5 times the interquartile range; and circles are for outliers. Boxes
highlight the deviating rate distributions of the aplousobranch Diplosoma listerianum and the appendicularian Oikopleura dioica.
Fig. 7 — Estimation of the synonymous / non-synonymous rate ratios (dN/dS) according
to 27 housekeeping genes in three pairs of closely related taxa. The graph shows the
synonymous and non-synonymous substitution rates as estimated using the YN00 counting method (Yang et al. 2000) between C. intestinalis - C. savignyi, D. rerio - T. nigroviridis, and
36
Fig. 8 — Overall estimation of the synonymous / non-synonymous rate ratios in
Olfactores. ω or dN/dS distributions for the pairs C. intestinalis - C. savignyi, D. rerio - T.
37
38
39
40
41
42
43
44