HAL Id: inserm-00127340
https://www.hal.inserm.fr/inserm-00127340
Submitted on 29 Jan 2007
HAL is a multi-disciplinary open access
archive for the deposit and dissemination of
sci-entific research documents, whether they are
pub-lished or not. The documents may come from
teaching and research institutions in France or
abroad, or from public or private research centers.
L’archive ouverte pluridisciplinaire HAL, est
destinée au dépôt et à la diffusion de documents
scientifiques de niveau recherche, publiés ou non,
émanant des établissements d’enseignement et de
recherche français ou étrangers, des laboratoires
publics ou privés.
Body silhouette, menstrual function at adolescence and
breast cancer risk in the E3N cohort study.
Bertrand Tehard, Rudolf Kaaks, Françoise Clavel-Chapelon
To cite this version:
Bertrand Tehard, Rudolf Kaaks, Françoise Clavel-Chapelon. Body silhouette, menstrual function at
adolescence and breast cancer risk in the E3N cohort study.. Breast Cancer Research and Treatment,
Springer Verlag, 2005, 92 (11), pp.2042-8. �10.1038/sj.bjc.6602620�. �inserm-00127340�
Body silhouette, menstrual function at adolescence and breast
cancer risk in the E3N cohort study
B. Tehard
1, R. Kaaks
2and F. Clavel-Chapelon
1*1Equipe Inserm ‘Nutrition, Hormones et Cancer’, Institut Gustave Roussy, 39 rue Camille Desmoulins, 94805
Villejuif Cedex, France; 2International Agency for Cancer Research, Lyon, France
We analysed the relation between adult breast cancer risk and adiposity in ages 8–25, and among 90 509 women included in the E3N cohort study, and investigated the potential modification effect of certain factors. Participants completed a questionnaire that included a set of eight silhouettes corresponding to body shape at different ages. During the follow-up (mean = 11.4 years), 3491 breast cancer cases were identified. Negative trends in risk of breast cancer with increasing body silhouettes at age 8 and at menarche were observed, irrespective of menopausal status, with relative risks of 0.73 (0.53–0.99) and 0.82 (0.66–1.02) for women who reported a silhouette equal or greater than the fifth silhouette at age 8 and at menarche, respectively. We observed no clear effect modification by age at menarche, delay between age at menarche, regular cycling, regularity of cycles in adult life or body mass index at baseline.
Keywords: breast neoplasms; cohort study; risk factors; body shape; childhood; overweight
Adult adiposity is positively associated with postmenopausal breast cancer risk and may be negatively associated with premenopausal breast cancer risk (Choi et al, 1978; La Vecchia et al, 1987; WCRF, 1997; COMA, 1998; van den Brandt et al, 2000; Friedenreich, 2001; IARC, 2002; Okasha et al, 2003). It still remains unclear, however, whether or not it is mostly excess weight during puberty and adolescence that explains the inverse relation of breast cancer risk with premenopausal overweight. In a number of studies (Friedenreich, 2001; IARC, 2002; Alghren et al, 2004), premenopausal breast cancer risk was inversely related to recalled weight and body mass index (BMI) around the age of 18, whereas the relation to weight gain since that age remains unclear, one literature review indicating a direct relation (Friedenreich, 2001) and another indicating an inverse relation (IARC, 2002). Among studies on the relation between overweight and breast cancer, seven case–control studies (Hislop and Coldman, 1986; Pryor et al, 1989; Brinton and Swanson 1992; Franceschi et al, 1996; Hu et al, 1997; Magnusson et al, 1998; Coates et al, 1999), one historical cohort study (Le Marchand et al, 1988) and six prospective cohorts (Hilakivi-Clarke et al, 2001; Swerdlow et al, 2002; Alghren et al, 2004; De Stavola et al, 2004; Weiderpass et al, 2004; Baer et al, 2005) have examined the relation between breast cancer and adiposity in childhood. Only two studies (De Stavola et al, 2004; Baer et al, 2005) investigated the interaction between adiposity, between 2 and 4 years of age and age at menarche in their relation to breast cancer. Studying the events occurring
during the period in life of the mammary gland growth may give new insights into the aetiology of the disease. We have examined the relation between breast cancer and body shape at adolescence, using the data from the E3N study, a large prospective cohort of French women, followed up from 1990 until 2002 (Clavel-Chapelon, 2002).
Material and methods
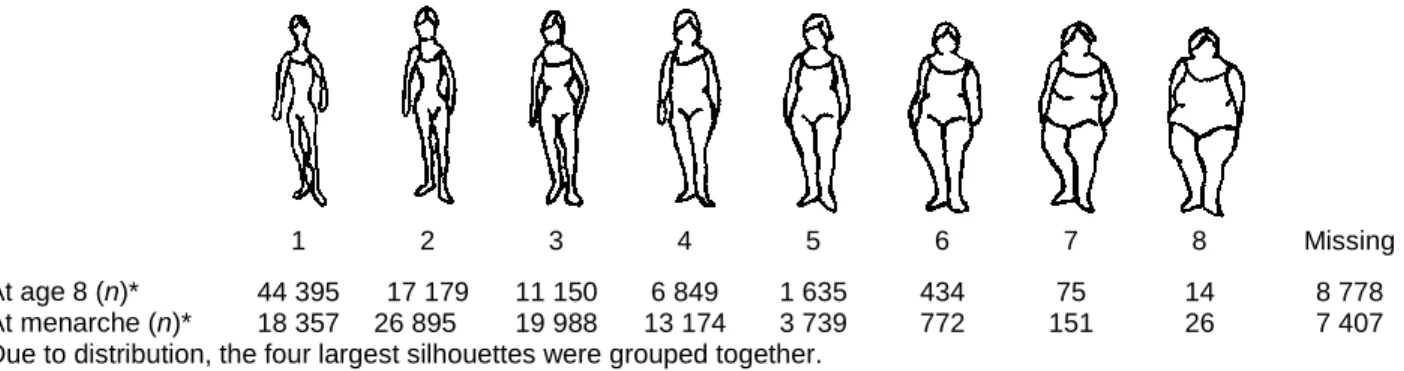
The E3N cohort consists of 98 995 women living in France, covered by a national health insurance scheme primarily covering school teachers. Participants were aged 40–65 years when they were first recruited into the cohort, between June 1990 and November 1991, by responding to the first in a series of mailed questionnaires during their follow-up. The baseline questionnaire contained questions on established risk factors of breast cancer including aspects of reproductive life, menopause, history of benign breast disease, breast cancer in first-degree relatives and anthropometric measures. Women were also asked to report which of a series of Sørensen’s silhouettes (Sørensen et al, 1983; www.e3n.net) best
described their body shape around the age of 8, at menarche and at age 20–25 (Figure 1); more than 86% of women completed such questions (Figure 1).
*
1 2 3 4 5 6 7 8 Missing At age 8 (n)* 44 395 17 179 11 150 6 849 1 635 434 75 14 8 778 At menarche (n)* 18 357 26 895 19 988 13 174 3 739 772 151 26 7 407 *Due to distribution, the four largest silhouettes were grouped together.
Figure 1 Body silhouettes used in baseline questionnaire (as first proposed by Sörensen et al, 1983), with frequency distribution of women’s responses.
Follow-up questionnaires were sent out approximately every 2 years thereafter. All questionnaires asked whether breast cancer had been diagnosed, requesting the addresses of their physicians and permission to contact them. Deaths in the cohort were detected from reports by family members and by searching the insurance company (MGEN) file, which contains information on vital status. Information on cause of death was obtained from the National Service on Causes of Deaths (http://sc8.vesinet.inserm.fr:1080/accueil_fr.html). Information on nonrespondents was obtained from the MGEN file on reimbursement of hospital fees. The third follow-up questionnaire sent out contained a dietary questionnaire. Participants of the E3N cohort who responded to the dietary questionnaire (n = 74 524) were included in the European Prospective Investigation into Cancer and Nutrition (EPIC) (Riboli and Kaaks, 1997).
Menopause, if applicable, was recorded in each follow-up questionnaire. To promote accuracy of the constructed menopause variables, all answers on date and type of menopause (natural or the result of bilateral oophorectomy, chemotherapy, radiotherapy or other treatment), date of last menstruation, date of start of menopausal symptoms and date of hysterectomy, if appropriate, were reviewed. Postmenopause was defined as the cessation of periods for natural reasons or not.
Follow-up time was between the return of the baseline questionnaire in 1990 and July 2002, when the seventh questionnaire was sent out. Person-years were accrued up to the date of breast cancer diagnosis, death, last questionnaire returned or July 2002 (for replies to the questionnaire received after July 2002), whichever occurred first. Women with a null follow-up were excluded (n = 2601) from the analyses, as those who declared a prevalent cancer other than a basal cell carcinoma and an incident cancer other than a breast cancer (n = 5447). Also excluded were women with an incident ductal carninoma in situ (n = 405). Finally, 90 509 women were included in the analyses; mean followup was 11.4 years (s.d. = 2.4 years).
Owing to the high percentage of pathology reports finally obtained (covering 94.9% of the breast cancers reported up to the sixth questionnaires) and because of the high rate of histologic confirmation (97.8% of these), we decided to consider in the present analysis reported breast cancer cases not yet confirmed (n = 527). Overall, the present analysis is based on 3491 breast cancer cases, 930 diagnosed before the menopause and 2561 women after their menopause.
Statistical analyses were made using Cox’s proportional-hazard models, with subjects’ age as the time scale. As menopausal status changed during follow-up for 45 573 women, it was included in Cox’s models as a time-dependent variable in analyses that were not stratified by menopausal status. The other adjustment variables taken into account were: adult height divided into quartiles (cut points: 158, 162 and 165 cm), history of breast cancer in first-degree relatives (yes/no), age at menarche (cut points: 12, 13 and 14), age at first full-term pregnancy (FFTP) (cut points: 23, 26 and 30), parity (0, 1–3 and 4+), history of benign breast disease (yes/no), alcohol consumption (g of alcohol per week), number of years at school (cut points: 0, 5, 9, 13 and 15), marital status (if ever married or not), oral contraceptive use (yes/no) and physical activity (quartiles of weekly energy expenditure for recreational and household activities cited in the first questionnaire). Additional adjustments were made for BMI at recruitment, the interval between menarche and the establishing of regular menstrual cycles. The four largest silhouettes were grouped together, according to the distribution.
Results
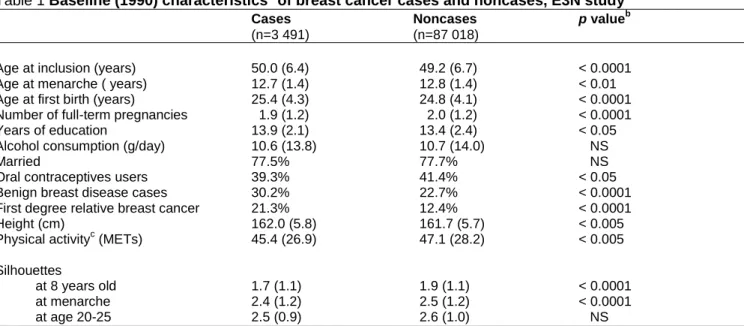
Evidence for the following risk factors of breast cancer in the E3N population were found (Table 1): early age at menarche, late age at first birth, high height, low physical activity, high educational level, familial history of breast cancer and personal history of benign breast disease. Breast cancer cases on average also reported a smaller silhouette than noncases, both at 8 years of age (P<0.0001) and at menarche (P<0.0001). Concerning silhouette at age 20–25, no difference was observed between cases and noncases. Body silhouette at age 8 and at menarche were correlated (Spearman’s correlation coefficient = 0.63, P-value<0.0001). Among women who reported a silhouette at both ages (n = 80 956), 45.6% chose the same silhouette and 83.5% chose one at menarche that was equal or adjacent to that at age 8. Body silhouette at age 20–25 was found less correlated with that at age 8 (Spearman’s correlation coefficient = 0.62, P-value <0.0001) than with that at menarche (Spearman’s correlation coefficient = 0.44, P-value <0.0001).
Table 1 Baseline (1990) characteristicsa of breast cancer cases and noncases, E3N study Cases Noncases p valueb
(n=3 491) (n=87 018)
Age at inclusion (years) 50.0 (6.4) 49.2 (6.7) < 0.0001 Age at menarche ( years) 12.7 (1.4) 12.8 (1.4) < 0.01 Age at first birth (years) 25.4 (4.3) 24.8 (4.1) < 0.0001 Number of full-term pregnancies 1.9 (1.2) 2.0 (1.2) < 0.0001 Years of education 13.9 (2.1) 13.4 (2.4) < 0.05 Alcohol consumption (g/day) 10.6 (13.8) 10.7 (14.0) NS
Married 77.5% 77.7% NS
Oral contraceptives users 39.3% 41.4% < 0.05 Benign breast disease cases 30.2% 22.7% < 0.0001 First degree relative breast cancer 21.3% 12.4% < 0.0001 Height (cm) 162.0 (5.8) 161.7 (5.7) < 0.005 Physical activityc (METs) 45.4 (26.9) 47.1 (28.2) < 0.005 Silhouettes
at 8 years old 1.7 (1.1) 1.9 (1.1) < 0.0001 at menarche 2.4 (1.2) 2.5 (1.2) < 0.0001 at age 20-25 2.5 (0.9) 2.6 (1.0) NS
NS = nonsignificant. aMean (s.d.) or percentages. bCalculations were made by t-tests and 2 tests. cWeekly energy expenditure for recreational and household activities cited in the first questionnaire.
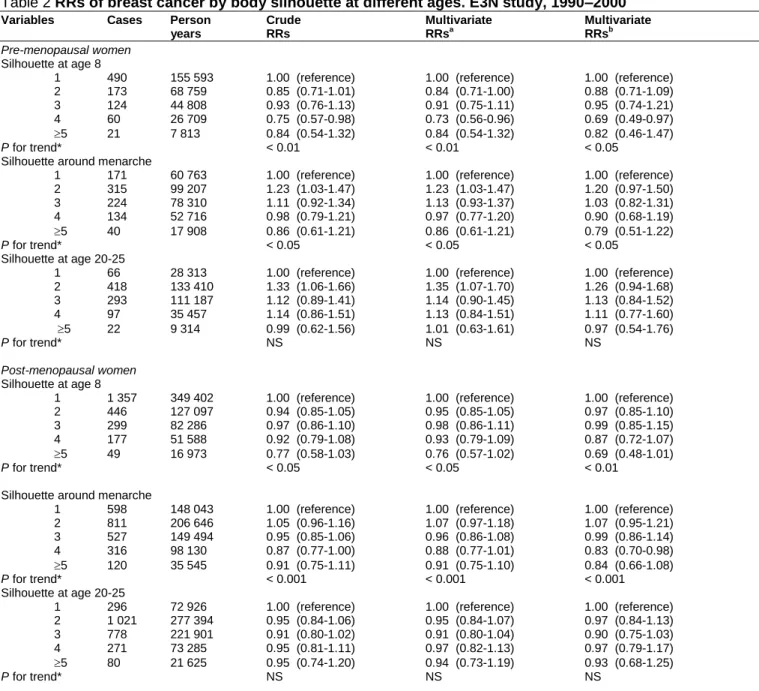
Patterns of risks with silhouette at age 8 and at menarche were similar among pre- and postmenopausal women (Table 2), with significant negative trends in risk. In the whole group of pre- and postmenopausal women, we observed a linear trend of decrease in risk of breast cancer with increasing silhouette, both at age 8 (P<0.001) and at menarche (P<0.0005), with relative risks (RR) equal to 0.86 (95% confidence interval (CI): 0.75–0.99) and 0.89 (0.80–0.99), for women who chose the fourth silhouette at age 8 and at menarche, respectively, and equal to 0.80 (0.63–1.02) and 0.90 (0.76–1.06) for women who chose a silhouette equal or greater than the fifth silhouette at age 8 and at menarche, respectively, as compared to women who chose the first silhouette (data not shown). Considering silhouette at menarche, we observed a weak increase in risk among women who chose the second silhouette (RR equal to 1.11 (1.02–1.21)), as compared with the first. The linear decreases in risk observed with silhouettes at age 8 and at menarche were slightly more accentuated after additional adjustment for adult BMI, adult regularity of menstrual cycles and for interval between menarche and regular cycling, with RRs equal to 0.73 (0.53–0.99) and 0.82 (0.66–1.02) for women who chose a silhouette equal or greater than the fifth silhouette at age 8 and at menarche, respectively, as compared to women choosing the first (data not shown). No significant linear relation was found between silhouette at age 20–25 and breast cancer risk, irrespective of menopausal status. However, we observed an increased risk of premenopausal breast cancer among women who chose the second silhouette at this age, with RRs of 1.35 (1.07– 1.70), as compared to those choosing the first silhouette (Table 2). Later adjustments for adult BMI, adult regularity of menstrual cycles and for interval between age at menarche and age at regular cycling did not materially change the results.
Table 2 RRs of breast cancer by body silhouette at different ages. E3N study, 1990–2000 Variables Cases Person Crude Multivariate Multivariate
years RRs RRsa RRsb
Pre-menopausal women Silhouette at age 8
1 490 155 593 1.00 (reference) 1.00 (reference) 1.00 (reference)
2 173 68 759 0.85 (0.71-1.01) 0.84 (0.71-1.00) 0.88 (0.71-1.09)
3 124 44 808 0.93 (0.76-1.13) 0.91 (0.75-1.11) 0.95 (0.74-1.21)
4 60 26 709 0.75 (0.57-0.98) 0.73 (0.56-0.96) 0.69 (0.49-0.97)
5 21 7 813 0.84 (0.54-1.32) 0.84 (0.54-1.32) 0.82 (0.46-1.47)
P for trend* < 0.01 < 0.01 < 0.05
Silhouette around menarche
1 171 60 763 1.00 (reference) 1.00 (reference) 1.00 (reference)
2 315 99 207 1.23 (1.03-1.47) 1.23 (1.03-1.47) 1.20 (0.97-1.50) 3 224 78 310 1.11 (0.92-1.34) 1.13 (0.93-1.37) 1.03 (0.82-1.31) 4 134 52 716 0.98 (0.79-1.21) 0.97 (0.77-1.20) 0.90 (0.68-1.19) 5 40 17 908 0.86 (0.61-1.21) 0.86 (0.61-1.21) 0.79 (0.51-1.22) P for trend* < 0.05 < 0.05 < 0.05 Silhouette at age 20-25
1 66 28 313 1.00 (reference) 1.00 (reference) 1.00 (reference)
2 418 133 410 1.33 (1.06-1.66) 1.35 (1.07-1.70) 1.26 (0.94-1.68) 3 293 111 187 1.12 (0.89-1.41) 1.14 (0.90-1.45) 1.13 (0.84-1.52) 4 97 35 457 1.14 (0.86-1.51) 1.13 (0.84-1.51) 1.11 (0.77-1.60) 5 22 9 314 0.99 (0.62-1.56) 1.01 (0.63-1.61) 0.97 (0.54-1.76) P for trend* NS NS NS Post-menopausal women Silhouette at age 8
1 1 357 349 402 1.00 (reference) 1.00 (reference) 1.00 (reference)
2 446 127 097 0.94 (0.85-1.05) 0.95 (0.85-1.05) 0.97 (0.85-1.10)
3 299 82 286 0.97 (0.86-1.10) 0.98 (0.86-1.11) 0.99 (0.85-1.15)
4 177 51 588 0.92 (0.79-1.08) 0.93 (0.79-1.09) 0.87 (0.72-1.07)
5 49 16 973 0.77 (0.58-1.03) 0.76 (0.57-1.02) 0.69 (0.48-1.01)
P for trend* < 0.05 < 0.05 < 0.01
Silhouette around menarche
1 598 148 043 1.00 (reference) 1.00 (reference) 1.00 (reference)
2 811 206 646 1.05 (0.96-1.16) 1.07 (0.97-1.18) 1.07 (0.95-1.21) 3 527 149 494 0.95 (0.85-1.06) 0.96 (0.86-1.08) 0.99 (0.86-1.14) 4 316 98 130 0.87 (0.77-1.00) 0.88 (0.77-1.01) 0.83 (0.70-0.98) 5 120 35 545 0.91 (0.75-1.11) 0.91 (0.75-1.10) 0.84 (0.66-1.08) P for trend* < 0.001 < 0.001 < 0.001 Silhouette at age 20-25
1 296 72 926 1.00 (reference) 1.00 (reference) 1.00 (reference)
2 1 021 277 394 0.95 (0.84-1.06) 0.95 (0.84-1.07) 0.97 (0.84-1.13)
3 778 221 901 0.91 (0.80-1.02) 0.91 (0.80-1.04) 0.90 (0.75-1.03)
4 271 73 285 0.95 (0.81-1.11) 0.97 (0.82-1.13) 0.97 (0.79-1.17)
5 80 21 625 0.95 (0.74-1.20) 0.94 (0.73-1.19) 0.93 (0.68-1.25)
P for trend* NS NS NS
RR = relative risk; FFTP = first full-term pregnancy; NS = nonsignificant. aAdjusted for menopause, age at menarche, age at FFTP, parity,
marital status, number of years at school, height, alcohol consumption, familial history of breast cancer in first-degree relatives, personal history of benign breast disease, oral contraceptive use and physical activity. bAdditionally adjusted for BMI at baseline (1990), regularity of menstrual cycles when adult, interval between age at menarche and onset of regular cycling. *Performed on the continuous variable ranked from 1 to 5+.
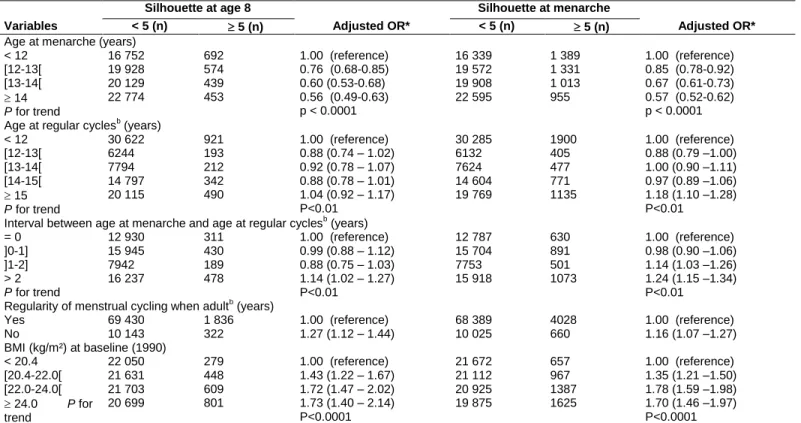
Logistic regression models (Table 3) to determine if menstrual-related variables and BMI in adulthood were associated with adiposity during childhood. Compared to women with a silhouette of 4 or less at menarche, those with a silhouette greater than or equal to 5 tended to be younger at menarche (Ptrend<0.0001, odds ratio
(OR) = 0.57 (0.52–0.62) for age at menarche 14 vs <12), had a longer interval between menarche and regular cycling (Ptrend<0.005, OR = 1.24 (1.15–1.34) for an interval >2 years vs 0), had more often irregular menstrual
cycles in adult life (OR = 1.16 (1.07–1.27)) and were more adipose at baseline (Ptrend<0.0001, OR = 1.70 (1.46–
1.97) for women in the fourth vs women in the first quartile). Having a large silhouette at adolescence was not related to age at regular cycling, except when the latter occurred after age 15 (OR = 1.18 (1.10–1.28)). Similar results were observed for silhouette at age 8.
Subgroup analyses (Table 4) indicated similar patterns of risks with silhouette at age 8 irrespective of age at menarche, delay between age at menarche, regular cycling, regularity of cycles in adult life or BMI at inclusion. Similar conclusions were found for adiposity at menarche. No test for heterogeneity between trends in risk by subgroups reached significance.
Table 3: Factors associated to a silhouette equal or greater than the 5th (logistic regression), at age 8 and around menarche. E3N study
Silhouette at age 8 Silhouette at menarche
Variables < 5 (n) 5 (n) Adjusted OR* < 5 (n) 5 (n) Adjusted OR*
Age at menarche (years) < 12 [12-13[ [13-14[ 14 P for trend 16 752 19 928 20 129 22 774 692 574 439 453 1.00 (reference) 0.76 (0.68-0.85) 0.60 (0.53-0.68) 0.56 (0.49-0.63) p < 0.0001 16 339 19 572 19 908 22 595 1 389 1 331 1 013 955 1.00 (reference) 0.85 (0.78-0.92) 0.67 (0.61-0.73) 0.57 (0.52-0.62) p < 0.0001 Age at regular cyclesb (years)
< 12 [12-13[ [13-14[ [14-15[ 15 P for trend 30 622 6244 7794 14 797 20 115 921 193 212 342 490 1.00 (reference) 0.88 (0.74 – 1.02) 0.92 (0.78 – 1.07) 0.88 (0.78 – 1.01) 1.04 (0.92 – 1.17) P<0.01 30 285 6132 7624 14 604 19 769 1900 405 477 771 1135 1.00 (reference) 0.88 (0.79 –1.00) 1.00 (0.90 –1.11) 0.97 (0.89 –1.06) 1.18 (1.10 –1.28) P<0.01
Interval between age at menarche and age at regular cyclesb (years)
= 0 ]0-1] ]1-2] > 2 P for trend 12 930 15 945 7942 16 237 311 430 189 478 1.00 (reference) 0.99 (0.88 – 1.12) 0.88 (0.75 – 1.03) 1.14 (1.02 – 1.27) P<0.01 12 787 15 704 7753 15 918 630 891 501 1073 1.00 (reference) 0.98 (0.90 –1.06) 1.14 (1.03 –1.26) 1.24 (1.15 –1.34) P<0.01
Regularity of menstrual cycling when adultb (years) Yes No 69 430 10 143 1 836 322 1.00 (reference) 1.27 (1.12 – 1.44) 68 389 10 025 4028 660 1.00 (reference) 1.16 (1.07 –1.27) BMI (kg/m²) at baseline (1990) < 20.4 [20.4-22.0[ [22.0-24.0[ 24.0 P for trend 22 050 21 631 21 703 20 699 279 448 609 801 1.00 (reference) 1.43 (1.22 – 1.67) 1.72 (1.47 – 2.02) 1.73 (1.40 – 2.14) P<0.0001 21 672 21 112 20 925 19 875 657 967 1387 1625 1.00 (reference) 1.35 (1.21 –1.50) 1.78 (1.59 –1.98) 1.70 (1.46 –1.97) P<0.0001
OR = odds ratio. aOR (95% CI) adjusted for menopause, age at menarche, age at FFTP, parity, marital status, number of years at school, height, BMI, alcohol
consumption, familial history of breast cancer in first-degree relatives, personal history of benign breast disease, oral contraceptive use and physical activity.
b
Age at menarche added as a confounder.
Discussion
Our results support the hypothesis of a protective effect of adiposity at young ages on breast cancer risk, irrespective of menopausal status, although the magnitude of the effect was not strong and although the CIs around the RRs for obese girls often included unity. Since adjustment for menstrual and anthropometric characteristics in adulthood did not attenuate our estimates, our results suggest that adiposity during adolescence may have an independent protective effect against breast cancer. No clear association was found between silhouette at age 20–25 and risk.
Table 4 RRs of breast cancer by body silhouette around menarche, according to menstrual characteristics and to BMI at inclusion E3N study, 1990–2000
Variables Cases (PY) Multivariate RRsa Cases (PY) Multivariate RRs Cases (PY) Multivariate RRs Cases (PY) Multivariate RRs
Silhouette Around 8 years old Around menarche
Age at menarche <13 years Age at menarche 13 years Age at menarche <13 years Age at menarche 13 years
1 2 3 4 5 P for trend 819 (209 031) 305 (93 580) 217 (65 286) 135 (42 654) 40 (14 245) 1.00 (reference) 0.88 (0.77 – 1.01) 0.91 (0.78 – 1.06) 0.86 (0.72 – 1.03) 0.75 (0.54 – 1.03) <0.01 1017 (292 984) 311 (101 096) 204 (61 049) 102 (35 201) 29 (10 353) 1.00 (reference) 0.95 (0.83 – 1.07) 1.01 (0.87 – 1.18) 0.88 (0.72 – 1.07) 0.83 (0.57 – 1.21) =0.10 309 (77 554) 526 (131 807) 370 (112 425) 261 (80 332) 81 (30 363) 1.00 (reference) 1.11 (0.98 –1.27) 0.95 (0.82 –1.10) 0.93 (0.79 –1.09) 0.76 (0.60 –0.96) <0.001 458 (130 126) 589 (172 116) 380 (114 027) 188 (69 606) 78 (22 646) 1.00 (reference) 1.10 (0.98 – 1.23) 1.05 (0.92 – 1.20) 0.85 (0.72 – 1.01) 1.07 (0.84 – 1.36) <0.05
Interval ≤1 year Interval >1 year Interval ≤1 year Interval >1 year
1 2 3 4 5 P for trend 695 (185 744) 232 (71 241) 159 (45 640) 86 (26 931) 24 (8 526) 1.00 (reference) 0.93 (0.80 – 1.07) 0.98 (0.82 – 1.16 0.90 (0.72 – 1.13) 0.75 (0.49 – 1.14 =0.07 537 (152 369) 187 (59 523) 127 (39 729) 65 (25 006) 18 (7 724) 1.00 (reference) 0.91 (0.81 – 1.02) 0.96 (0.83 – 1.09) 0.86 (0.72 – 1.02) 0.80 (0.60 – 1.08) <0.01 304 (78 266) 424 (113 320) 266 (81 983) 154 (51 725) 62 (17 374) 1.00 (reference) 1.05 (0.91 –1.21 0.92 (0.79 –1.08) 0.84 (0.69 –1.01) 1.00 (0.76 –1.31) <0.05 221 (61 042) 323 (90 287) 238 (70 799) 132 (48 614) 39 (18 127) 1.00 (reference) 1.14 (1.02 – 1.28) 1.05 (0.93 – 1.19) 0.94 (0.82 – 1.08) 0.84 (0.67 – 1.04) <0.001
Irregular menstrual cycles in adulthood Regular menstrual cycles in adulthood Irregular menstrual cycles in adulthood Regular menstrual cycles in adulthood
1 2 3 4 5 P for trend 231 (65 299) 67 (23 659) 55 (16 504) 35 (10 166) 10 (3 717) 1.00 (reference) 0.88 (0.67 – 1.16) 1.05 (0.78 – 1.40) 1.06 (0.74 – 1.52) 0.86 (0.46 – 1.63 =0.50 1616 (439 696) 552 (172 197) 368 (110 590) 202 (68 130) 60 (21 070) 1.00 (reference) 0.92 (0.83 – 1.01) 0.95 (0.85 – 1.06) 0.84 (0.73 – 0.98) 0.78 (0.60 – 1.01) <0.001 114 (28 680) 124 (38 165) 92 (28 397) 54 (19 037) 21 (7 532) 1.00 (reference) 0.96 (0.75 –1.23) 0.96 (0.73 –1.26) 0.86 (0.62 –1.18) 0.82 (0.52 –1.31) <0.05 655 (180 126) 1002 (267 688) 659 (199 407) 396 (131 809) 139 (45 922) 1.00 (reference) 1.13 (1.03 – 1.24) 1.01 (0.91 – 1.12) 0.91 (0.80 – 1.02) 0.90 (0.75 – 1.08) <0.001 BMI <25 kg/m2 At baseline (1990) BMI 25 kg/m2 At baseline (1990) BMI <25 kg/m2 At baseline (1990) BMI 25 kg/m2 At baseline (1990) 1 2 3 4 5 P for trend 1553 (430 261) 520 (162 534) 329 (99 590) 176 (59 526) 52 (17 789) 1.00 (reference) 0.93 (0.85 – 1.03) 0.95 (0.84 – 1.07) 0.85 (0.72 – 0.99) 0.81 (0.61 – 1.07) <0.01 270 (69 036) 95 (31 477) 92 (26 338) 57 (17 913) 18 (6 769) 1.00 (reference) 0.84 (0.67 – 1.06) 1.02 (0.81 – 1.29) 0.93 (0.70 – 1.23) 0.77 (0.47 – 1.26) =0.20 669 (184 973) 940 (256 953) 619 (181 855) 342 (119 426) 118 (39 707) 1.00 (reference) 1.11 (1.01 –1.22) 1.04 (0.93 –1.15) 0.86 (0.76 –0.98) 0.88 (0.72 –1.07) <0.001 88 (21 522) 177 (45 836) 130 (43 351) 102 (29 974) 40 (13 193) 1.00 (reference) 1.12 (0.89 – 1.42) 0.98 (0.72 – 1.19) 1.05 (0.80 – 1.37) 0.94 (0.65 – 1.35) =0.22
RR=relative risk; BMI=body mass index; PY=person-years. aadjusted for menopause, age at menarche, age at FFTP, parity, marital status, number of years at school, height, alcohol consumption, familial
Few studies have focused on the relation between high weight at (or around) menarche and risk (Le Marchand et al, 1988; Franceschi et al, 1996; Hu et al, 1997; Magnusson et al, 1998; Coates et al, 1999; Alghren et al, 2004; De Stavola et al, 2004; Weiderpass et al, 2004). Most of these studies showed results quite similar to ours, with a reduction especially of premenopausal risk among women who had a high BMI during childhood (Le Marchand et al, 1988; Coates et al, 1999; Weiderpass et al, 2004). A case–control study nested within a historical cohort in Hawaii (Le Marchand et al, 1988) showed a significant negative association of premenopausal risk with high body mass at age 10–14. A lower risk was found for women who considered themselves heavier than average at ages 12–13 and 15–16 (Coates et al, 1999). The use of Sørensen’s body silhouettes for adiposity at age 7, showed a significant and strong negative association of increasing body silhouette at that age with postmenopausal breast cancer risk, with a three-fold RR for those who had chosen the leanest shape as their age 7 silhouettes, as compared to the largest (Magnusson et al, 1998). Three prospective cohort studies have found a significant decrease in risk with childhood adiposity: a Scandinavian cohort study (Weiderpass et al, 2004) showed a decreased risk of premenopausal breast cancer among women who were the heaviest girls at age 7 (RR=0.69 (0.51– 0.93)), when compared to the thinnest; a high BMI at age 14 was associated with a RR of 0.84 (0.75– 0.94) in a Danish cohort (Alghren et al, 2004), while another study found a reduced risk only with a high BMI at ages 2–4 (De Stavola et al, 2004). Two others studies of anthropometric data at age 12 had no significant results (Franceschi et al, 1996; Hu et al, 1997). Some studies have indicated that weight may be a risk modifier even earlier in life (De Stavola et al, 2004). Unfortunately, birth weight and weight, or adiposity, before age 8 were not available in our study. Overall a decreased risk of premenopausal breast cancer has been found with increasing adiposity around 20 years of age, while such relation was less clear among postmenopausal women (IARC, 2002; Weiderpass et al, 2004). Overall our results were globally nonsignificant whatever the menopausal status.
Excess adiposity can alter the production of hormones, notably by increasing the frequency of anovulatory cycles (Stoll, 1997, 1998), which leads to a decrease in progesterone levels. In our data, the percentage of women for whom menstrual cycles became regular more than 1 year after menarche – which may indicate the occurrence of anovulatory cycles – increased from 29 to 42% with increasing body silhouette at menarche. Several studies associated irregular menstrual cycles during life course to a lower risk of breast cancer (Layde et al, 1989; Parazzini et al, 1993; Den Tonkelaar and de Waard, 1996). Our observations and the fact that the relationships observed were not modified by menstrual and anthropometric characteristics in adulthood suggest that the inverse relation of excess weight during childhood with risk later in life, before or after menopause, may be explained by hormonal mechanisms in the peripubertal period, when mammary tissue develops.
As body silhouettes at age 8 and at menarche are highly correlated, it is difficult to deduce if the protective effect in our study is due to body fatness at age 8, to body fatness at menarche or to both. To try to disentangle these two efforts, we examined the associations between risk and overweight at age 8 among women with a silhouette lesser or equal to 3 at menarche, and also overweight at menarche among those with a silhouette lesser or equal to 3 at age 8. Both analyses showed similar decreases in risk with increasing body silhouette, although the decrease remained significant only with increasing silhouette at menarche (P for trend <0.01), perhaps indicating that body fatness at menarche is more relevant to the decreased risk observed in this study.
As E3N participants have high levels of education and health consciousness, our data can be considered reliable with very few missing replies (around 5% for anthropometric variables). As a prospective cohort, recall bias is prevented. The frequent updating of our data (a questionnaire sent out every 2 years) allowed us to determine accurately the menopausal status of the women and to take account of this evolution in our analyses. Although we included breast cancer cases that were not histologically confirmed, the great concordance between self-declaration of cancer and pathology reports allowed us to strengthen the statistical power of our study, and any misclassifications would only bias our estimates towards unity.
However, the fact that the E3N cohort was not population based may reduce the variability of many characteristics and consequently bias our estimates towards unity. This study is based on long-term memory of adiposity between childhood and young adulthood, which may generate important error measurements because many people cannot precisely evaluate their weight and height in childhood, either because of difficulty of accurate recall measurements or because they were not informed of their weight when young. Nevertheless, several previous studies have shown a reasonably high reliability of
recalled body weight data, even after long intervals (Stevens et al, 1990; Casey et al, 1991; De Fine Olivarius and Andreasen, 1997). Moreover, the use of Sørensen’s body silhouettes greatly facilitates the distant recall of body shape and adiposity, during childhood. The use of silhouettes was validated to estimate 33 years prior body shape on 448 women, and showed that recalled silhouettes were overestimated by the thinnest girls and underestimated by normal/heavier girls (Must et al, 2002). However, such misclassifications would only bias our estimates towards unity. Silhouettes may therefore offer an easier and more accurate estimate of categories of past obesity.
In summary, our results support the hypothesis that obesityduring childhood or adolescence reduces breast cancer risk, and that this reduction is not fully explained by menstrual characteristics after menarche nor by adult BMI, but these results need confirmation; further research is also required to analyse the hormonal characteristics of overweight adolescents and to assess whether hormonal modifications related to overweight at adolescence persist in adult life.
Acknowledgements
We are indebted to all participants for providing the data used in this study and to practitioners for providing pathology reports. We thank the French League against Cancer, the European Community, the 3M Company, the Mutuelle Générale de l’Education Nationale, the Institut Gustave-Roussy and the Institut National de la Santé et de la Recherche Médicale for supporting the E3N study financially. We are grateful to Dimitrios Trichopoulos, to Christine Friedenreich and to the E3N group for their comments and support.
References
Alghren M, Melbye M, Wohlfahrt J, Sørensen TIA (2004) Growth patterns and the risk of breast cancer in women. N Engl J Med 351: 1619–1626
Baer HJ, Colditz GA, Rosner B, Michels KB, Rich-Edwards JW, Hunter DJ, Willett WC (2005) Body fatness during adolescence and incidence of breast cancer in premenopausal women: a prospective cohort study. Breast Cancer Res 7: R314– R325
Brinton LA, Swanson CA (1992) Height and weight at various ages and risk of breast cancer. Am J Epidemiol 2(5): 597–609
Casey VA, Dwyer JT, Berkey CS, Coleman KA, Gardner J, Valadian I (1991) Long-term memory of body weight and past weight satisfaction: a longitudinal follow-up study. Am J Clin Nutr 53: 1493– 1498 Choi NW, Howe GR, Miller AB, Matthews V, Morgan RW, Munan L, Burch JD, Feather J, Jain M, Kelly A
(1978) An epidemiologic study of breast cancer. Am J Epidemiol 107: 510–521
Clavel-Chapelon F (2002) E3N-EPIC Group. Differential effects of reproductive factors on the risk of pre- and postmenopausal breast cancer. Results from a large cohort of French women. Br J Cancer 86(5): 723–727
Coates RJ, Uhler RJ, Hall HI, Potischman N, Brinton LA, Ballard-Barbash R, Gammon MD, Brogan DR, Daling JR, Malone KE, Schoenberg JB, Swanson CA (1999) Risk of breast cancer in young women in relation to body size and weight gain in adolescence and early adulthood. Br J Cancer 81: 167– 174 De Fine Olivarius N, Andreasen AH (1997) Five-year all-cause mortality of 1323 newly diagnosed
middle-aged and elderly diabetic patients. Data from the population-based study, diabetes care in general practice, Denmark. J Diabetes Complications 11: 83–89
De Stavola BL, dos Santos Silva I, McCormack V, Hardy RJ, Kuh Dj, Wadsworth MEJ (2004) Childhood growth and breast cancer. Am J Epidemiol 159: 671–682
Den Tonkelaar I, de Waard F (1996) Regularity and length of menstrual cycles in women aged 41-46 in relation to breast cancer risk: results from the DOM-project. Breast Cancer Res Treat 38: 253–258 Franceschi S, Favero A, La Vecchia C, Baron AE, Negri E, Dal Maso L, Giacosa A, Montella M, Conti E,
Amadori D (1996) Body size indices and breast cancer risk before and after menopause. Int J Cancer 67: 181–186
Friedenreich CM (2001) Review of anthropometric factors and breast cancer risk. Eur J Cancer Prev 10: 15–32
Hilakivi-Clarke L, Forsen T, Eriksson JG, Luoto R, Tuomilehto J, Osmond C, Barker DJ (2001) Tallness and overweight during childhood have opposing effects on breast cancer risk. Br J Cancer 85(11): 1680–1684
Hislop TG, Coldman AJ (1986) Re: ‘Overweight and changes in weight throughout adult life in breast cancer etiology: a case–control study’. Am J Epidemiol 124(3): 493–494
Hu YH, Nagata C, Shimizu H, Kaneda N, Kashiki Y (1997) Association of body mass index, physical activity, and reproductive histories with breast cancer: a case–control study in Gifu, Japan. Breast Cancer Res Treat 43: 65–72
IARC Handbooks of Cancer Prevention (2002) Weight Control and Physical Activity Vol. 6, pp 95–111. Lyon: IARC Press
La Vecchia C, Decarli A, Parazzini F, Gentile A, Negri E, Cecchetti G, Franceschi S (1987) General epidemiology of breast cancer in northern Italy. Int J Epidemiol 16: 347–355
Layde PM, Webster LA, Baughman AL, Wingo PA, Rubin GL, Ory HW (1989) The independent associations of parity, age at first full term pregnancy, and duration of breastfeeding with the risk of breast cancer. Cancer and Steroid Hormone Study Group. J Clin Epidemiol 42: 963–973
Le Marchand L, Kolonel LN, Earle ME, Mi MP (1988) Body size at different periods of life and breast cancer risk. Am J Epidemiol 128: 137–152
Magnusson C, Baron J, Persson I, Wolk A, Bergstrom R, Trichopoulos D, Adami HO (1998) Body size in different periods of life and breast cancer risk in post-menopausal women. Int J Cancer 76: 29–34 Must A, Phillips SM, Naumova EN, Blum M, Harris S, Dawson-Hughes B, Rand WM (2002) Recall of early
menstrual history and menarcheal body size: after 30 years, how well do women remember? Am J Epidemiol 155: 672–679
Okasha M, McCarron P, Gunnel D, Smith GD (2003) Exposures in childhood, adolescence and early adulthood and breast cancer risk: a systematic review of the literature. Breast Cancer Res Treat 78: 223–276
Parazzini F, La Vecchia C, Negri E, Franceschi S, Tozzi L (1993) Lifelong menstrual pattern and risk of breast cancer. Oncology 50: 222–225
Pryor M, Slattery ML, Robison LM, Egger M (1989) Adolescent diet and breast cancer in Utah. Cancer Res 49(8): 2161–2167
Riboli E, Kaaks R (1997) The EPIC Project: rationale and study design. European Prospective Investigation into Cancer and Nutrition. Int J Epidemiol 26(Suppl 1): S6– S14
Sørensen TI, Stunkard AJ, Teasdale TW, Higgins MW (1983) The accuracy of reports of weight: children’s recall of their parents’ weights 15 years earlier. Int J Obes 7: 115–122
Stevens J, Keil JE, Waid LR, Gazes PC (1990) Accuracy of current, 4-year, and 28-year self-reported body weight in an elderly population. Am J Epidemiol 132: 1156–1163
Stoll BA (1997) Impaired ovulation and breast cancer risk. Eur J Cancer 33:1532– 1535
Stoll BA (1998) Teenage obesity in relation to breast cancer risk. Int J Obes Relat Metab Disord 22: 1035– 1040
Swerdlow AJ, De Stavola BL, Floderus B, Holm NV, Kaprio J, Verkasalo PK, Mack T (2002) Risk factors for breast cancer at young ages in twins: an international population-based study. J Natl Cancer Inst 94(16):1238– 1246
van den Brandt PA, Spiegelman D, Yaun SS, Adami HO, Beeson L, Folsom AR, Fraser G, Goldbohm RA, Graham S, Kushi L, Marshall JR, Miller AB, Rohan T, Smith-Warner SA, Speizer FE, Willett WC, Wolk A, Hunter DJ (2000) Pooled analysis of prospective cohort studies on height, weight, and breast cancer risk. Am J Epidemiol 152: 514–527
Weiderpass E, Braaten T, Magnusson C, Kumle M, Vainio H, Lund E, Adami HO (2004) A Prospective study of body size in different periods of life and risk of premenopausal breast cancer. Cancer Epidemiol Biomarkers Prev 13: 1121–1127
Working Group on Diet and Cancer of the Committee on Medical Aspects of Food and Nutrition policy (COMA) (1998) Nutritional Aspects of the Development of Cancer pp 154–160. London: The Stationery Office
World Cancer Research Fund/American Institute for Cancer Research (1997) Food, Nutrition and the Prevention of Cancer: a Global Perspective. Washington, DC: American Institute for Cancer Research, pp 252–288.