HAL Id: hal-00327949
https://hal.archives-ouvertes.fr/hal-00327949
Submitted on 29 Jun 2006HAL is a multi-disciplinary open access
archive for the deposit and dissemination of sci-entific research documents, whether they are pub-lished or not. The documents may come from teaching and research institutions in France or abroad, or from public or private research centers.
L’archive ouverte pluridisciplinaire HAL, est destinée au dépôt et à la diffusion de documents scientifiques de niveau recherche, publiés ou non, émanant des établissements d’enseignement et de recherche français ou étrangers, des laboratoires publics ou privés.
Formation of secondary organic aerosol and oligomers
from the ozonolysis of enol ethers
A. Sadezky, P. Chaimbault, A. Mellouki, A. Römpp, R. Winterhalter, G. Le
Bras, G. K. Moortgat
To cite this version:
A. Sadezky, P. Chaimbault, A. Mellouki, A. Römpp, R. Winterhalter, et al.. Formation of secondary organic aerosol and oligomers from the ozonolysis of enol ethers. Atmospheric Chemistry and Physics Discussions, European Geosciences Union, 2006, 6 (3), pp.5629-5670. �hal-00327949�
ACPD
6, 5629–5670, 2006
Ozonolysis of enol ethers: formation of
SOA and oligomers A. Sadezky et al. Title Page Abstract Introduction Conclusions References Tables Figures J I J I Back Close
Full Screen / Esc
Printer-friendly Version Interactive Discussion
EGU
Atmos. Chem. Phys. Discuss., 6, 5629–5670, 2006 www.atmos-chem-phys-discuss.net/6/5629/2006/ © Author(s) 2006. This work is licensed
under a Creative Commons License.
Atmospheric Chemistry and Physics Discussions
Formation of secondary organic aerosol
and oligomers from the ozonolysis of enol
ethers
A. Sadezky1,2, P. Chaimbault3, A. Mellouki2, A. R ¨ompp1, R. Winterhalter1, G. Le Bras2, and G. K. Moortgat1
1
Max-Planck-Institute for Chemistry, Atmospheric Chemistry Department, P.O. Box 3060, 55020 Mainz, Germany
2
Laboratoire de Combustion et de Syst `emes R ´eactifs, CNRS, 1C Avenue de la Recherche Scientifique, 45071 Orl ´eans-Cedex 2, France
3
Institut de Chimie Organique et Analytique, UMR 6005, BP 6759, University of Orl ´eans, 45067 Orl ´eans Cedex 2, France
Received: 18 April 2006 – Accepted: 10 May 2006 – Published: 29 June 2006 Correspondence to: A. Mellouki ([email protected])
ACPD
6, 5629–5670, 2006
Ozonolysis of enol ethers: formation of
SOA and oligomers A. Sadezky et al. Title Page Abstract Introduction Conclusions References Tables Figures J I J I Back Close
Full Screen / Esc
Printer-friendly Version Interactive Discussion
EGU
Abstract
Formation of secondary organic aerosol has been observed in the gas phase ozonoly-sis of a series of enol ethers, among them several alkyl vinyl ethers (AVE, ROCH=CH2), such as ethyl, propyl, n-butyl, i so-butyl, t-butyl vinyl ether, and ethyl propenyl ether (EPE, C2H5OCH=CHCH3). The ozonolysis has been studied in a 570 l spherical glass 5
reactor at atmospheric pressure (730 Torr) and temperature (296 K). Gas phase reac-tion products were investigated by in-situ FTIR spectroscopy, and secondary organic aerosol (SOA) formation was monitored by a scanning mobility particle sizer (SMPS). The chemical composition of the formed SOA was analysed by a hybrid mass spec-trometer using electrospray ionization (ESI). The main stable gas phase reaction prod-10
uct is the respective alkyl formate ROC(O)H, formed with yields of 60 to 80%, implying that similar yields of the corresponding Criegee Intermediates (CI) CH2O2for the AVE and CH3CHO2for EPE are generated. Measured SOA yields are between 2 to 4% for all enol ethers. Furthermore, SOA formation is strongly reduced or suppressed by the presence of an excess of formic acid, which acts as an efficient CI scavenger.
15
Chemical analysis of the formed SOA by ESI(+)/MS-TOF allows to identify oligomeric compounds in the mass range 200 to 800 u as its major constituents. Repetitive chain units are identified as CH2O2 (mass 46) for the AVE and C2H4O2 (mass 60) for EPE and thus have the same chemical compositions as the respec-tive major Criegee Intermediates formed during ozonolysis of these ethers. The 20
oligomeric structure and chain unit identity are confirmed by HPLC/ESI(+)/MS-TOF and ESI(+)/MS/MS-TOF experiments, whereby successive and systematic loss of a fragment with mass 46 for the AVE (and mass 60 for EPE) is observed. It is proposed that the oligomer has the following basic structure of an oligoperoxide, -[CH(R)-O-O]n-, where R=H for the AVE and R=CH3for the EPE. Oligoperoxide formation is thus sug-25
gested to be another, so far unknown reaction of stabilized Criegee Intermediates in the gas phase ozonolysis of oxygen-containing alkenes leading to SOA formation.
ACPD
6, 5629–5670, 2006
Ozonolysis of enol ethers: formation of
SOA and oligomers A. Sadezky et al. Title Page Abstract Introduction Conclusions References Tables Figures J I J I Back Close
Full Screen / Esc
Printer-friendly Version Interactive Discussion
EGU
1 Introduction
Alkyl vinyl ethers are increasingly produced as solvents to be used in the chemical industry. Because of their reasonable volatility this class of compounds will result in a significant emission into the urban atmosphere. Consequently alkyl vinyl ethers will be oxidized by OH- and NO3-radicals and O3.
5
A few investigations have recently been reported on the kinetics and product distri-bution of simple alkyl vinyl ethers. Thiault et al. (2002) studied the OH and O3 initi-ated oxidation of ethyl vinyl ether (EVE, C2H5O-CH=CH2). The main products from both reactions were formaldehyde and ethyl formate C2H5OC(O)H. Additional stud-ies performed in the EUPHORE chamber revealed the formation of secondary organic 10
aerosols (SOA) (George et al., 2005).
Klotz et al. (2004) performed a product study of the gas-phase reactions of O3, OH and NO3 with methyl vinyl ether (MVE, CH3O-CH2=CH2). The main products from all reactions were formaldehyde and methyl formate CH3OC(O)H; in the case of the O3 reaction, hydroperoxymethyl formate, methanol, CO2and CO were also produced. In-15
terestingly, particle formation was observed in the ozonolysis, but not in the OH or NO3 radical reactions. The observed aerosol profiles showed typical behaviour associated with homogeneous nucleation. The mean size of the particles measured at the end of the experiment (1 to 3 h) was typically 60 nm in diameter. Methyl vinyl ether with only three carbon atoms, is the smallest compound studied that produces aerosol during its 20
atmospheric degradation. Usually, seven or more C atoms are required from non-cyclic hydrocarbons, six from cyclic species to initiate SOA formation (Seinfeld and Pankow, 2003; Seinfeld and Pandis, 1998).
A detailed investigation of the ozonolysis of six unsaturated alkyl ethers has been performed in a laboratory reaction chamber: ethyl vinyl ether (EVE), ethyl propenyl 25
ether (EPE), propyl vinyl ether (PVE), n-butyl vinyl ether (BVE), t-butyl vinyl ether (TBVE), and iso-butyl vinyl ether (IBVE). Gas phase products have been quantified by FTIR spectroscopy and SOA have been observed by a SMPS system and
char-ACPD
6, 5629–5670, 2006
Ozonolysis of enol ethers: formation of
SOA and oligomers A. Sadezky et al. Title Page Abstract Introduction Conclusions References Tables Figures J I J I Back Close
Full Screen / Esc
Printer-friendly Version Interactive Discussion
EGU
acterized by an HLPC coupled to a hybrid mass spectrometer (Sadezky, 2005). This paper reports the formation and identification of a series of oligomeric products in the ozonolysis of all the studied unsaturated alkyl ethers.
2 Experimental
Experiments in the laboratory were performed in a 570-liter spherical glass reactor at 5
room temperature in synthetic air at a total pressure of 730 Torr. A detailed description of this setup has been described in earlier publications (Neeb et al., 1998; Winterhal-ter et al., 2000). Ozone was produced by a mercury pen-ray lamp inside the reactor, prior to the addition of the mixture of vinyl ether and synthetic air (reaction start). The concentrations of reactants and reaction products were followed by Fourier Transform 10
infrared spectroscopy (FTIR). The aerosol concentration and size distribution was mon-itored with a scanning mobility particle sizer (SMPS, TSI 3936). The SMPS consists of an electrostatic classifier (TSI 3080) with a long differential mobility analyzer, (LDMA; TSI 3081) and an ultrafine condensation particle counter (CPC; TSI 3025A) as detec-tor.
15
Experiments were performed with initial ether mixing ratios varying between 200 ppb and 9 ppm, and similar or slightly lower ozone mixing ratios. For the studies involv-ing observation of SOA formation profiles, mixinvolv-ing ratios between 200 and 400 ppb of ether and ozone were used, whereas for experiments with chemical analysis by mass spectrometry of collected aerosols, 8 ppm of ozone and 9 ppm of ether were used. In 20
order to prevent reactions of vinyl ethers with OH radicals, which are known to be gen-erated during the ozonolysis of alkenes (Finlayson et al., 1972), cyclohexane (excess, 300 ppm) was added in some experiments. In another type of experiments, excess HCOOH (20 ppm) was added as scavenger for stabilized Criegee Intermediates. All chemicals were commercially available (purity >95%) and used without further purifi-25
cation.
ACPD
6, 5629–5670, 2006
Ozonolysis of enol ethers: formation of
SOA and oligomers A. Sadezky et al. Title Page Abstract Introduction Conclusions References Tables Figures J I J I Back Close
Full Screen / Esc
Printer-friendly Version Interactive Discussion
EGU
on Teflon (PTFE) filters (45 mm diameter, 0.45 µm pore size), using a flow rate of 14 L min−1. After collection the filters were extracted in a 7 cm3 glass flask with 3 ml pure methanol (HPLC grade), and stored at –20◦C until analysis.
For chromatographic separation, 10 µL of this extract were directly injected into the HPLC system, which consisted of a thermostated autosampler (Series 200, Perkin 5
Elmer), a degasser and a quaternary pump (both 1100 Series, Agilent Technologies). The analytical column (250 mm×2 mm I.D., 5 µm particle size) contains a ReproSil-Pur C18-AQ stationary phase (Dr. Maisch GmbH). The eluents were 0.1% formic acid in deionized water (eluent A) and acetonitrile (HPLC-grade) (eluent B). The gradient of the mobile phase was as follows: 0% B for 0.5 min, gradient to 15% B in 2.5 min, 10
gradient to 100% B in 16 min, isocratic for 6.5 min. The flow of the mobile phase was 400 µL/min.
Chemical constituents were detected by a hybrid mass spectrometer (quadrupole and time-of-flight) QSTAR (Applied Biosystems MDS SCIEX) with an electrospray ion source. The extraction solution was either directly injected (10 µL/min) or previously 15
separated by HPLC as described before. The electrospray ion source (TurboIonSpray) was operated in the positive mode at 400◦C and an ionization voltage of+3.4 kV. The declustering potential was+30 V, and the focussing potential (focus ring) was +100 V. For tandem Q-TOF experiments, the collision energy was between 15 and 30 eV with CAD (collision gas) set to 2. Instrument control, spectra treatment and calculations of 20
elemental compositions were done with the software Analyst (Applied Biosystems MDS SCIEX). Further instrumental and analytical details are reported by R ¨ompp (2003).
3 Results
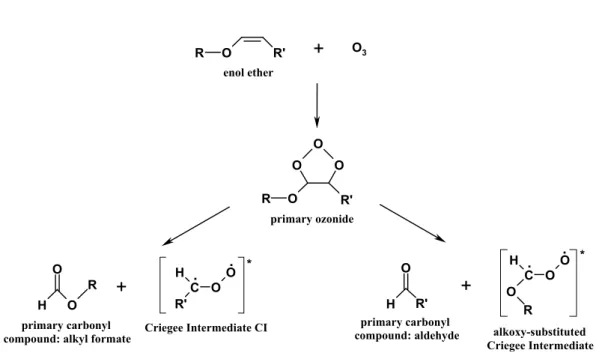
3.1 General aspects and gas phase mechanism of the ozonolysis of enol ethers The general mechanism of the ozonolysis of unsaturated ethers is displayed in Fig. 1. 25
ACPD
6, 5629–5670, 2006
Ozonolysis of enol ethers: formation of
SOA and oligomers A. Sadezky et al. Title Page Abstract Introduction Conclusions References Tables Figures J I J I Back Close
Full Screen / Esc
Printer-friendly Version Interactive Discussion
EGU
and decomposes into a carbonyl oxide, called the Criegee Intermediate (CI), and a primary carbonyl compound. The ozonolysis of the ether molecules investigated in this study produces CIs of the type CH2OO (C1-CI, R0=H) for the alkyl vinyl ethers (AVE), and CH3CHOO (C2-CI, R0=CH3) for ethyl propenyl ether (EPE), together with RO-CHOO (alkoxy-substituted CI). The R group consists of C2H5for EVE and EPE, C3H7 5
for PVE and C4H9 for the three different butyl vinyl ethers. The corresponding primary carbonyl compounds consist of an alkyl formate and formaldehyde or acetaldehyde. The CIs formed from the decomposition of the primary ozonide are formed in excited states, which then either decompose into various products or become collisionaly stabi-lized. Nearly half of the excited CIs are stabilized, and it has been established that sta-10
bilized CIs (SCIs) undergo in the gas phase a variety of bimolecular reactions with car-bonyl compounds, HCOOH and H2O to form secondary ozonides (1,2,4-trioxolanes), hydroperoxy formates and hydroxyhydroperoxides, respectively (Calvert et al., 2000).
The yields of the different gas phase products have been determined by FTIR spec-troscopy for EVE and EPE, from which the branching ratio of the splitting of the primary 15
ozonide into both pathways was deduced to be (71±13) % for the “ethyl formate+ C1 -CI” channel for EVE, and (83±13) % for the “ethyl formate+ C2-CI” channel for EPE (Sadezky, 2005). It has to be stressed that the yield of the C1and C2SCIs is estimated to be nearly 20–40% per reacted enol ether (Sadezky, 2005).
The gas-phase chemistry of the ozonolysis of the unsaturated ethers will not be 20
treated in this paper, but will be published elsewhere (Sadezky et al., 20061). An elab-orate mechanism of the gas phase ozonolysis of methyl vinyl ether has been presented by Klotz et al. (2004), and their results show the same trend as observed in our studies (Sadezky, 2005).
Besides the classical mechanism of the ozonolysis of unsaturated ethers in the gas 25
phase, as presented above, there exists another mechanism in the liquid phase. Keul et al. (1985) investigated the ozonolysis of different alkyl vinyl ethers in a variety of
1
Sadezky, A., Winterhalter, R., Mellouki, A., Moortgat, G. K., and Le Bras, G.:, G: Ozonolysis of enol ethers: gas phase products and reaction mechanism, in preparation, 2006.
ACPD
6, 5629–5670, 2006
Ozonolysis of enol ethers: formation of
SOA and oligomers A. Sadezky et al. Title Page Abstract Introduction Conclusions References Tables Figures J I J I Back Close
Full Screen / Esc
Printer-friendly Version Interactive Discussion
EGU
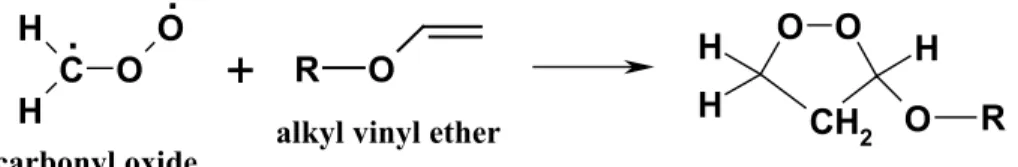
solvents at –78◦C, and observed major yields of alkoxy-1,2-dioxolanes, besides the expected alkoxy-1,2,4-trioxolanes. These products arose from the addition of carbonyl oxide CH2OO, produced upon ozonolysis of vinyl ethers from decomposition of the primary ozonide, to the double bond of the vinyl ethers by 1,3-cycloaddition (Fig. 2). 3.2 Aerosol formation from gas-phase ozonolysis of AVE
5
3.2.1 Size distribution of SOA particles
Typical time evolution of the particle number size distribution during experiments of various alkyl vinyl ethers (AVE) is presented in Fig. 3 for ethyl vinyl ether (EVE) (initial mixing ratios 200 to 400 ppb of reactants EVE and O3). The SOA appears as a sin-gle aerosol mode, whose time evolution is sequentially displayed with different colours 10
for different reaction times of the EVE ozonolysis. Formation of detectable particles (>10 nm) is observed after 3 min, given by the turquoise-coloured size distribution. A maximum total particle concentration of 5×10⁵ to 1×10⁶particle/cm3 is reached after 5 min at mode diameters (top point of the aerosol mode) around 20 nm (pink-coloured size distribution). With increasing reaction time, the total particle concentration de-15
creases due to particle coagulation, while the particle diameter increases due to con-densation of gaseous reaction products onto the particle surfaces and to coagulation. At the end of the reaction (after 45 min), the SOA size distribution is stable at mode di-ameters around 50 nm and a total particle concentration of 1×10⁵particle/cm3. Similar observations were made for the other AVE under similar experimental conditions and 20
initial reactant mixing ratios.
As no seed aerosol is used, and particle background concentrations (>3 nm) are measured to be lower than 200 particle/cm3, SOA particle formation necessarily occurs by homogeneous nucleation of low-volatile reaction products from gas phase ozonoly-sis of the enol ethers.
ACPD
6, 5629–5670, 2006
Ozonolysis of enol ethers: formation of
SOA and oligomers A. Sadezky et al. Title Page Abstract Introduction Conclusions References Tables Figures J I J I Back Close
Full Screen / Esc
Printer-friendly Version Interactive Discussion
EGU
3.2.2 SOA yields and partitioning coefficients
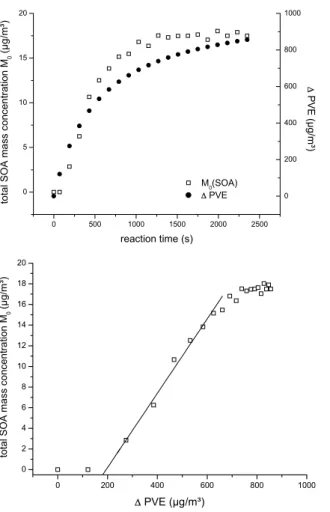
Total aerosol mass concentrations (µg/m3) were calculated from the measured number size distributions by assuming spherical particles with a density of 1 g/cm3. Figure 4 shows for propyl vinyl ether (PVE) plots of the total mass concentration M0of aerosol formed as a function of reaction time (Fig. 4a) and of the mass concentration of the 5
ether reacted,∆P V E (Fig. 4b). The linear part of the plot in Fig. 4b characterizes the SOA formation before a final and stable total SOA mass concentration M0=18 µg/m3 for PVE is reached. These final SOA mass concentrations for the other ethers, which are reached after 15 to 20 min, were: M0=13 µg/m3, 25 µg/m3, 14 µg/m3, and 7 µg/m3 for ethyl vinyl ether (EVE), n-butyl vinyl ether (BVE), iso-butyl vinyl ether (IBVE) and 10
t-butyl vinyl ether (TBVE), respectively. It is clearly evident from Fig. 4b that a certain
quantity of the AVE must have reacted before SOA is formed and observed. The concentration of enol ether reacted until formation of detectable aerosol particles is observed is referred to as threshold quantity∆AV Ethresh. ∆AV Ethresh corresponds to the intersection of the linear section with the x-axis representing the mass of reacted 15
AV E ,∆AV E. The slope of this linear section (Fig. 4b) gives the aerosol yield, a, hereby
ignoring the threshold quantity∆AV Ethreshreacted before:
M0= a × ∆AV E + b (1)
with M0 = total aerosol mass concentration (µg/m3), ∆AV E = mass of reacted AVE (µg/m3), and a= aerosol yield.
20
The aerosol profiles can also be evaluated by the adsorption/partitioning model de-veloped by Odum et al. (1996). In this model hypothetical semi-volatile compounds i are partitioned between the gas and aerosol phase, as expressed in the Eq. (2):
Yf = M0ΣαiKi/(1+ KiM0) (2)
Yf is the fractional SOA yield calculated by 25
ACPD
6, 5629–5670, 2006
Ozonolysis of enol ethers: formation of
SOA and oligomers A. Sadezky et al. Title Page Abstract Introduction Conclusions References Tables Figures J I J I Back Close
Full Screen / Esc
Printer-friendly Version Interactive Discussion
EGU
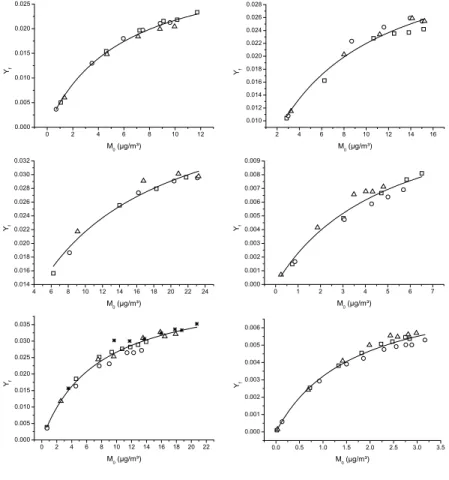
The partitioning coefficients Ki and the formation yields αi for the semi-volatile com-pounds i can be obtained from a least-square fit of the observed aerosol yield Yf as a function of the aerosol mass M0. Here it is assumed that only one semi-volatile compound i is partitioned for every AVE, leading to Eq. (4):
Yf = M0[αiKi/(1+ KiM0)] (4)
5
The corresponding plots and least-square fits for the different AVEs are shown in Fig. 5, combining the results of three to four repetitive ozonolysis experiments for each AVE under similar experimental conditions.
Table 1 summarizes the results of both methods for the evaluation of SOA formation profiles in the reaction of the five studied AVE with ozone. The SOA mass yields a are 10
in very good agreement with the formation yields αi of the hypothetical semi-volatile compound i . For EVE, PVE, BVE and IBVE typical yields range from 3.5 to 4.7%. Threshold quantities∆AV Ethresh vary between 37 and 58 ppb. For TBVE the aerosol yield is much smaller (1.4 to 1.6 %) with a significantly higher∆AV Ethresh≈100 ppb. Moreover, comparison of the ozonolysis experiments of IBVE with and without an ex-15
cess of cyclohexane C6H12 (OH scavenger) shows that the presence of an excess of C6H12 reduces the SOA yield from 4.4% to below 1% in the ozonolysis of IBVE. All values obtained for the AVE in this work are in good agreement with those obtained by Klotz et al. (2004) for methyl vinyl ether MVE using the same methods (Table 1).
Saturation vapor pressures of the SOA forming organic compounds can be estimated 20
by two different methods based on the results in Table 1. The partitioning coefficient
Ki (µg/m3) of the hypothetical semi-volatile compound i is inversely proportional to its saturation vapor pressure Pi◦ (Torr) according to the following relationship (Eq. 5) (Odum et al., 1996; Pankow, 1994):
Pi◦= (760 RT )/(MWi106Kiζi) (5)
25
with R=8.206×10⁻⁵ (m3atm)/(mol K) and T=296 K. In the later sections, the newly formed aerosol is shown by ESI(+)/MS to consist mainly of oligomers in the mass
ACPD
6, 5629–5670, 2006
Ozonolysis of enol ethers: formation of
SOA and oligomers A. Sadezky et al. Title Page Abstract Introduction Conclusions References Tables Figures J I J I Back Close
Full Screen / Esc
Printer-friendly Version Interactive Discussion
EGU
range 300 to 500 u. Assuming that the hypothetical semi-volatile compound i repre-sents an average of these oligomers, and that other unidentified SOA constituents are minor, a mean molar weight MWi=400 g/mol is assumed. With the elemental composi-tions of the oligomers pointing out to an oligoperoxidic structure (see later seccomposi-tions), the compound i is assumed to be moderately polar, giving an activity coefficient ζi≈1. An-5
other method to estimate the mean saturation vapor pressures Pv ap[µTorr] of the main SOA constituents relies on the measured yields of these constituents, here assumed to be nearly equal to the measured SOA yields a, and the SOA formation thresholds ∆AV Ethresh[ppb] (Eq. 6) (Koch et al., 2000):
Pv ap = a × ∆AV Ethresh× 10−9× Ptotal× 106 (6)
10
with Ptotal=730 Torr. Both methods give saturation vapor pressures between 0.1 and 1.8 µTorr, thus within one order of magnitude.
These values can only be considered as an estimate. Both calculations are based on liquid compounds with flat surfaces and do not take into account the effects of Kelvin’s law, which are expected to be significant for the observed particle sizes of several 15
nanometers. The real saturation vapor pressures of the SOA forming compounds might thus be much lower, the range of values given by the two above-described calculation methods representing upper limits.
3.3 Chemical analysis of the SOA composition and formation of oligomers 3.3.1 Observation of oligomers by ESI(+)/MS-TOF
20
Deploying the smooth ionisation of the electrospray technique, oligomeric prod-ucts were detected in the SOA filter samples for all the enol ethers studied. Fig-ures A1a–d (see Appendix A,http://www.atmos-chem-phys-discuss.net/6/5629/2006/
acpd-6-5629-2006-supplement.pdf) show the mass spectra of the aerosol samples ob-tained during the ozonolysis of EVE, EPE, PVE and TBVE. The spectra show the pres-25
ACPD
6, 5629–5670, 2006
Ozonolysis of enol ethers: formation of
SOA and oligomers A. Sadezky et al. Title Page Abstract Introduction Conclusions References Tables Figures J I J I Back Close
Full Screen / Esc
Printer-friendly Version Interactive Discussion
EGU
The pseudomolecular ions are positively charged of the type [M+H]+, where M is the mass of the molecular species.
Detailed analysis of the ion spectra revealed that the ion peaks could be grouped in series, whose ions display regular differences of ∆m/z=46 for all the investigated alkyl vinyl ethers AVE (ROCH=CH2), and∆m/z=60 for the ethyl propenyl ether EPE 5
(C2H5OCH=CHCH3). Such a regular structure is typical for oligomers, consisting of a chain unit with mass 46 and 60, respectively.
The different ion series for the various unsaturated ethers are presented in Table 2 and correspond to different types of oligomers designated (a), (b), (c), (d), (e) for the AVE and (a), (B), (C), (D), (E) for EPE. In order to better distinguish the series, the 10
peaks of the series are identified by different colours, corresponding to the colours of the peaks of Fig. A1a–d. The most intense series observed for each ether is coloured in red, and is assigned as oligomer of type (a). As described in a later section of this publication, ESI(+)/MS/MS-TOF experiments allowed to fragment the pseudomolecu-lar ions [M+H]+ and thus to determine the minimum number n of chain units 46 or 60 15
contained in the molecular species. In Figs. A1a–d, n are given for the pseudomolec-ular ions [M+H]+ of the most intensive oligomer series designated as type (a). Ions of type (a) and ions of weaker oligomer series suggested to carry similar numbers of chain units, are arranged in vertical columns in Table 2.
Some interesting relationships between the oligomer ions shown in Table 2 and 20
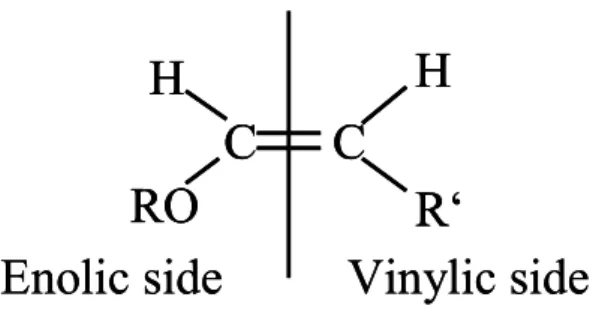
Figs. A1a–d and the original structure of the enol ethers can be derived. The schematic structure of an enol ether is shown in Fig. 6 and displays the two alkyl substituents, R0 on the vinylic side=CHR0of the double bond and R on its enolic side=CHOR
The substituents R and R0vary among the different ethers studied in this work. R0=H for the five alkyl vinyl ethers (AVE, ROCH=CH2), while R0=CH3for ethyl propenyl ether 25
(EPE, C2H5OCH=CHCH3). R0 differs thus by mass 14 (CH2) between the AVE and EPE, a difference that is reflected in the masses of the observed oligomer chain units, which are of∆m/z=46 for the AVE and of ∆m/z=60=46+14 for EPE. This indicates that the oligomer chain unit might depend on the alkyl substituents on the vinylic side
ACPD
6, 5629–5670, 2006
Ozonolysis of enol ethers: formation of
SOA and oligomers A. Sadezky et al. Title Page Abstract Introduction Conclusions References Tables Figures J I J I Back Close
Full Screen / Esc
Printer-friendly Version Interactive Discussion
EGU
=CHR0 of the double bond.
A comparison of the oligomers of type (a) formed from the five AVE (ROCH=CH2) shows that their masses differ by as many multiples of mass 14 (CH2) as do the original alkyl vinyl ethers among each other. As can be seen in Table 2 the oligomers formed from the three isomers of butyl vinyl ether, BVE, IBVE and TBVE, show the same ions 5
of type (a). Moreover, the type (a) ions are shifted by ∆m/z=14 from EVE to PVE as well as from PVE to the butyl vinyl ethers. Regarding the structure of the original ethers, these shifts might be attributed to the alkyl substituents R on the enolic side =CHOR of the double bond, which contain an additional CH2 group between EVE
(C2H5OCH=CH2, R=C2H5) and PVE (C3H7OCH=CH2, R=C3H7), as well as between 10
PVE and the BVEs (C4H9OCH=CH2, R=C4H9). Consequently, the alkoxy group OR of the original ether is suggested to be contained once in each oligomer ion.
Similar observations are made for the other, less intense oligomer series shown in Table 2 and in Figs. A1a–d. Like the oligomer ions of type (a), all weaker series also show chain units of mass 46 for AVE and of mass 60 for EPE. For all AVE except of 15
TBVE, oligomer ions of type (b) are visible, coloured in green in Table 2 and Figs. A1a– d. They differ from the series of type (a) ions by an additional ∆m/z=16, possibly corresponding to an oxygen atom. Consequently, like the type (a) ions, oligomer series of type (b) are also shifted by∆m/z=14 between EVE and PVE as well as between PVE and BVE/IBVE. The three butyl isomers show a variety of additional ions series 20
labelled (c), (d) and (e). For example, the ion series of type (c) systematically possess an additional∆m/z=14 with respect to the type (b) oligomer series, and consequently an additional ∆m/z=30 with respect to the type (a) series, eventually accounting in total for a formaldehyde-like unit (CH2O).
The mass spectra obtained from the ozonolysis of ethyl propenyl ether (EPE) also 25
show besides the type (a) oligomer, a variety of additional oligomer series labelled type (B) through (E). The capital letters distinguish these ion series from those formed from the AVE and designated (b) through (e), as they do not seem to show any analogy.
ACPD
6, 5629–5670, 2006
Ozonolysis of enol ethers: formation of
SOA and oligomers A. Sadezky et al. Title Page Abstract Introduction Conclusions References Tables Figures J I J I Back Close
Full Screen / Esc
Printer-friendly Version Interactive Discussion
EGU
3.3.2 Additional test experiments
Background experiments were performed to assure that the detected oligomers are definitely produced through the ozonolysis of unsaturated ethers during the typical du-ration of the experiment (45 min) and substantially contribute to SOA formation. No aerosol was formed when 9 ppm of EVE was introduced alone in the reactor, nor when 5
solely ozone (8 ppm) was introduced, and filter samples of both experiments did not show any of the described oligomer ions (Fig. A2).
SOA formation was observed to be strongly reduced or suppressed upon addition of HCOOH in excess during gas-phase ozonolysis of enol ethers (Sadezky, 2005) and terpenes (Bonn et al., 2002). The addition of 20 ppm of HCOOH to the mixture of EVE 10
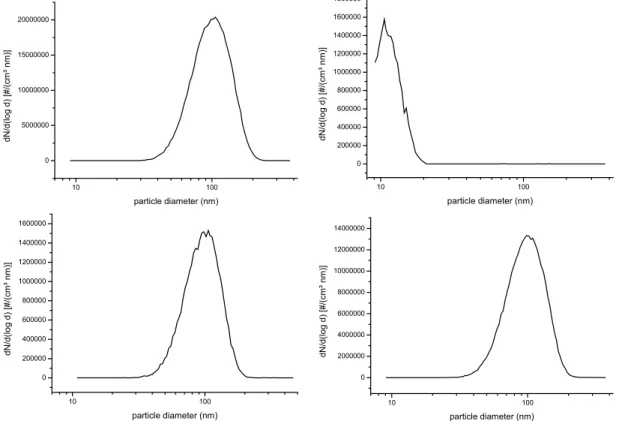
(9 ppm) and O3 (8 ppm) reduced the aerosol yield to less than 1 µg/m3, whereas in the absence of HCOOH the typical aerosol yield was in the order of 5 mg/m3. SOA particle size distributions measured after completion of the reaction, just before the be-ginning of the filter sampling, are shown for both experiments in Figs. 7a and b. The mass spectrum of the collected filter samples of the experiment with added HCOOH 15
is displayed in Fig. A2b and does not show any characteristic ions of the oligomers described before. The most intense ions visible in the Figs. A2a and b, 288 and 299, were proven by MS/MS experiments not to possess an oligomeric structure. HCOOH is known to scavenge Criegee Intermediates formed during alkene ozonolysis, leading to the formation of gaseous hydroperoxy formates (e.g. Klotz et al., 2004; Neeb et al., 20
1998; Horie et al., 1997; Sadezky, 2005). Considering that this reaction is responsible for the observed strong reduction of SOA formation, the scavenging effect of HCOOH indicates that Criegee Intermediates play a decisive role in SOA formation. The ad-dition of H2O to the ozonolysis system also caused a remarkable reduction of SOA formation (Sadezky, 2005).
25
In the presence of 300 ppm of cyclohexane (an OH scavenger), the total aerosol yield decreases by 80%, as is also described for IBVE in the previous section (Table 1). However, mass spectra obtained from filter samples of these experiments remained
un-ACPD
6, 5629–5670, 2006
Ozonolysis of enol ethers: formation of
SOA and oligomers A. Sadezky et al. Title Page Abstract Introduction Conclusions References Tables Figures J I J I Back Close
Full Screen / Esc
Printer-friendly Version Interactive Discussion
EGU
changed in comparison with those from ozonolysis experiments with mixtures of ether and ozone only, showing the same oligomer ions. The SOA particle size distribution measured after completion of the reaction, before the beginning of the filter sampling, is shown in Fig. 7c for an ozonolysis experiment of EVE (9 ppm of EVE and 8 ppm of ozone) with added 300 ppm of cyclohexane producing about 0.8 mg/m3 of SOA. For 5
comparison, also the SOA particle size distribution measured for the reaction of a mix-ture of EPE (9 ppm) with ozone (8 ppm), leading to the formation of about 3 mg/m3 of SOA, is shown in Fig. 7d.
3.3.3 Separation of the oligomers by HPLC
The different oligomeric constituents of the SOA may be separated by HPLC accord-10
ing to their number of chain units. An example of the TIC (total ion current) chro-matogram is shown in Fig. A3a, representing the SOA formed during ozonolysis of EVE, where chromatographic peaks in different retention time (RT) zones surrounded with different colours are marked. In Fig. A3b, the mass spectra of each of these four retention time (RT) zones, displayed in the corresponding colours, are overlaid. Fig-15
ure A3b shows that the most intense ion present in each retention time (RT) zone rep-resents a pseudomolecular ion of the oligomer of type (a) (see Table 2 and Fig. A1a), with m/z=329 for the first (blue-marked) retention time zone at RT=16 min, m/z=375 for the second (red-marked) at RT=17 min, m/z=421 for the third (green-marked) at RT=17.9 min, and m/z=467 for the fourth (violet-marked) at RT=18.5 min. The 20
less intense pseudomolecular ions of the oligomer of type (b) with m/z=345 (blue-marked zone, RT=16 min), 391 (red-marked zone, RT=17 min), 437 (green-marked zone, RT=17.9 min) and 483 (violet-marked zone, RT=18.5 min) are also shown (see Table 2 and Fig. A1a). Thus, with increasing retention time, from one chromatographic peak to the next, the masses of the detected oligomeric pseudomolecular ions increase 25
by∆m/z=46, that is, by the mass of a chain unit.
Similar TIC chromatograms and corresponding mass spectra were obtained for the SOA formed from ozonolysis of the other AVEs, where the oligomers all differ with the
ACPD
6, 5629–5670, 2006
Ozonolysis of enol ethers: formation of
SOA and oligomers A. Sadezky et al. Title Page Abstract Introduction Conclusions References Tables Figures J I J I Back Close
Full Screen / Esc
Printer-friendly Version Interactive Discussion
EGU
chain unit∆m/z=46 between two consecutive chromatographic peaks, and for EPE, where the chain unit is∆m/z=60. For all enol ethers, retention times of the different oligomers strictly increase with increasing number of chain units. A straight increase or decrease of the retention time with the number of chain units is a characteristic behaviour of polymeric compounds with oxygenated chain carriers, such as ethylene 5
oxide, in reverse-phase liquid chromatography (Chaimbault et al., 1998).
The peaks at retention times (RT) near 16 and 17 min (blue-marked and red-marked zones) of the TIC chromatogram of Fig. A3a can be resolved in the XIC (eXtracted Ion Current) mode as shown in Fig. A3c. The blue traces correspond to m/z=329 and 375, respectively of the oligomer of type (a), whereas the red traces correspond to m/z=345 10
and 391, of the oligomer of type (b). Four peaks are visible for each ion, which indicates that at least four isomers of the types (a) and (b) exist. Similar observations were made for the ions with m/z=343 and 389 (type a) and m/z=359 and 405 (type b) for PVE, and for the ions with m/z=375 and 403 (type a) and m/z=373 and 419 (type b) for
n-BVE.
15
3.3.4 Fragmentation of oligomers using ESI(+)/MS-MS-TOF
The fragmentation of the pseudomolecular ions using the MS/MS mode confirm that they consist of an oligomeric structure with the chain unit of∆m/z=60 for SOA formed in the ozonolysis of ethyl propenyl ether (EPE) and∆ m/z=46 for SOA formed from all the alkyl vinyl ethers (AVE) studied. The majority of the observed fragment ions can be 20
classified as being part of fragmentation pathways, formed by successive loss of the chain unit as neutral mass 60 or 46 for EPE and AVE, respectively. Tables 3a and b summarize the observed ions of the fragmentation pathways for the oligomers of type (a), respectively involving loss of chain units∆m/z=46 for AVE (Table 3a), and loss of chain units∆m/z=60 for EPE (Table 3b). A variety of nine fragmentation pathways 25
can thus be distinguished for an oligomer of type (a).
Generally, for the different AVE, detailed analysis of the MS/MS spectra has lead to the observation that the fragmentation of their oligomers proceeds according to a
ACPD
6, 5629–5670, 2006
Ozonolysis of enol ethers: formation of
SOA and oligomers A. Sadezky et al. Title Page Abstract Introduction Conclusions References Tables Figures J I J I Back Close
Full Screen / Esc
Printer-friendly Version Interactive Discussion
EGU
common scheme. There exist two distinct fragmentation patterns involving the loss of the chain element ∆m/z=46. One produces series of fragmentations in a way that the RO group clearly remains in the fragment ions. These fragment ions, given in the central column of Table 3a, differ by ∆m/z=14 between EVE and PVE, as well as between PVE and the three BVEs, as do the pseudomolecular ions themselves. The 5
most intense fragmentation pathway showing this pattern is marked in violet colour, and consists a.o. of the ions with m/z 127, 173, 219, 265, etc. for EVE (molar weight MW: 72 g/mol), the ions with m/z 141,187, 233, 279, etc. for PVE (MW: 86 g/mol), and the ions with m/z 155, 201, 247, 293, etc. for the three BVE-isomers (MW: 100 g/mol). The other fragmentation pattern produces fragment ions, which do not contain the RO 10
group and thus are identical for all the AVE. Those fragment ions are listed in the right-hand column of Table 3a. The two most important pathways showing this pattern are represented by red and green colours, and consist a.o. of the ions with m/z 85, 131, 177, 223, etc. and 99, 145, 191, 237, etc., respectively.
Examples of the MS/MS spectra are displayed in Figs. A4a–d for various unsaturated 15
ethers, which show the fragmentation of a selected specific pseudo-molecular ion of the type (a) oligomer. The three fragmentation pathways highlighted in violet, red and green colours in Table 3a and b are shown in the MS/MS spectra in Figs. A4a–d and are also schematically displayed in the bottom section of these figures by use of the same colours. The elemental compositions given for the ions and neutral molecules 20
are discussed below. Note that for AVE and EPE, the fragmentation pathways marked in red and green terminate by fragment ions of similar m/z, 85 and 99, respectively, and that for EVE and EPE, the fragmentation pathways marked in violet both terminate with fragment ions of a similar m/z, 127.
3.3.5 Principal structure of the oligomer (a) 25
The fragmentation pathways characterized by the regular loss of the chain unit with ∆m/z=60 for EPE and ∆m/z=46 for the AVE typically range from m/z=300 to 400, the masses of the pseudo-molecular ions, down to m/z about 100 for the smallest
ACPD
6, 5629–5670, 2006
Ozonolysis of enol ethers: formation of
SOA and oligomers A. Sadezky et al. Title Page Abstract Introduction Conclusions References Tables Figures J I J I Back Close
Full Screen / Esc
Printer-friendly Version Interactive Discussion
EGU
fragment ions (Tables 3a and b). Thus, they reveal a linear oligomeric structure, which can schematically be represented for an oligomer of type (a) by a chain having a start-ing group “X” and an end group “Y” linked by several chain units of mass 60 or 46 for EPE and AVE, respectively. This structure is schematically pictured in Fig. 8 for an oligomer of type (a) formed from AVE, with chain units of mass 46. The fragmentation 5
initiates with a loss of a neutral species X or Y from one side of the pseudo molecular ion [X-(46)n-Y+H]+, and continues with n successive losses of a chain unit of mass 46, to finally terminate on a fragment ion XH+ or YH+, respectively, representing the opposite side of the molecule.
Attribution of the alkoxy group RO to either the starting group X or the end group 10
Y of the pseudo molecular ion [X-(46)n-Y+H]+ explains the two distinct fragmentation patterns in the MS/MS spectra of the type (a) oligomers formed from AVE. In Fig. 8, RO is for example proposed to be part of the starting group X. The first fragmentation pat-tern, which conserves the RO group in the fragment ions, terminates with the fragment ion XH+, as shown on the right-hand side of Fig. 8. Application of this schema to the 15
observed fragmentation pathway marked in violet colour (Table 3a and Figs. A4a, c and d) identifies the terminating fragment ions 127 (EVE), 141 (PVE) and 155 (the three isomers of BVE) as XH+ and thus as the starting group X of the pseudo molecular ion [X-(46)n-Y+H]+. Consequently, in this example, the end group Y is represented by a neutral species of mass 64, whose loss from the pseudo molecular ion [X-(46)n-Y+H]+ 20
initiates the violet-coloured fragmentation pathway for type (a) oligomers from all AVE (Figs. A4a, c and d). The second fragmentation pattern, whose fragment ions do not contain the RO group and are identical for type (a) oligomers formed from different AVE, terminates on the fragment ion YH+, as shown on the left-hand side of Fig. 8. The starting group X, which contains the RO group, is fragmented as neutral species 25
from the pseudo molecular ion [X-(46)n-Y+H]+ in the first step of this fragmentation pattern. Application of this scheme to the observed fragmentation pathways marked in red and green colours attributes their terminating fragment ions 85 and 99 to YH+, thus to the end group Y of the pseudo molecular ion [X-(46)n-Y+H]+. The starting group X
ACPD
6, 5629–5670, 2006
Ozonolysis of enol ethers: formation of
SOA and oligomers A. Sadezky et al. Title Page Abstract Introduction Conclusions References Tables Figures J I J I Back Close
Full Screen / Esc
Printer-friendly Version Interactive Discussion
EGU
is consequently represented by the neutral species first fragmented from the pseudo-molecular ion [X-(46)n-Y+H]+, which are of masses 92 and 106 (EVE), 106 and 120 (PVE), and 120 and 134 (the three isomers of BVE) for the green- and red-coloured fragmentation pathways, respectively (Figs. A4a, c and d), and thus show the expected differences in units of ∆m/z=14 according to the contained RO groups.
5
Separation of the oligomers by liquid chromatography proved the existence of at least four isomers of the pseudomolecular ion, as is shown in Fig. A3c for oligomers formed during the ozonolysis of EVE. The presence of these isomers explains the complexity of the MS/MS spectra, with at least nine identified fragmentation pathways (Table 3a) belonging to one of the two fragmentation patterns. The regularity of the different frag-10
mentation pathways and the strict repetition of the two described fragmentation pat-terns suggest that the isomers follow the same structural principle. Therefore, in Fig. 8, isomers of the pseudomolecular ion [X-(46)n-Y+H]+ are symbolized by the addition of two more pseudomolecular structures [A-(46)n-Z+H]+ and [B-(46)n-W+H]+. As is schematically shown in Fig. 8, MS/MS spectra thus contain the fragmentation path-15
ways of all isomers [X-(46)n-Y+H]+, [A-(46)n-Z+H]+ and [B-(46)n-W+H]+ of a pseudo-molecular ion according to the two fragmentation patterns depicted in Fig. 8. Note that the proton ionizing the oligomer molecule is suggested in Fig. 8 to remain attached to the fragment ions. This is however an arbitrary decision for illustration purposes, as the determination of the exact fragmentation mechanism needs further investigation. 20
3.3.6 Elemental composition and minimum number n of the chain units 46 and 60 Possible elemental compositions of parent ions, fragment ions and fragmented neu-tral molecules were determinated from the m/z values measured during MS/MS ex-periments. Resulting elemental compositions are given exemplarily in Figs. A4a–d for those ions and neutrals that are part of one of the three fragmentation pathways 25
demonstrated in violet, red and green colours in the MS/MS spectra of oligomer (a) ions. Detailed results of the calculations are given for two of these pathways in Ta-bles 4a and b: for the red-coloured fragmentation of the pseudomolecular ion 399
ACPD
6, 5629–5670, 2006
Ozonolysis of enol ethers: formation of
SOA and oligomers A. Sadezky et al. Title Page Abstract Introduction Conclusions References Tables Figures J I J I Back Close
Full Screen / Esc
Printer-friendly Version Interactive Discussion
EGU
formed from EPE (see MS/MS spectrum in Fig. A4b) and for the violet-coloured frag-mentation of the pseudomolecular ion 389 formed from PVE (MS/MS spectrum in Fig. A4c). Similar calculations from MS/MS spectra of several other pseudomolecu-lar oligomeric ions formed from the diverse AVE and from EPE, for the three green-red- and violet-coloured fragmentation pathways, as well as for other fragmentation 5
pathways listed in Tables 3a and b, are given in Sadezky (2005) and show the repro-ducibility of these results.
Measured m/z values allow a rather doubtless determination of the elemental com-positions of the fragmented neutral molecules, in particular of the chain units 46 and 60. Analysis of the calculated mass errors in Tables 4a and b show a strong and systematic 10
preference of the elemental compositions CH2O2 (theoretical mass 46,0046 u) for the chain unit of mass 46 (AVE) and C2H4O2 (theoretical mass 60,0211 u) for the chain unit of mass 60 (EPE). The only other elemental compositions, which make chemical sense as neutral molecules in order to represent the chain units, C2H6O for mass 46 and C3H8O for mass 60, usually show much larger mass errors.
15
Further work is needed to elucidate the structures of parent and fragment ions. For their chemical compositions, the elements C, H and O and a single positive charge are taken into account. The fact that good fragmentation spectra are obtained from pseudomolecular ions during MS/MS experiments disagree with Na+ adducts.
The existence of different isomers of the pseudomolecular ions further complicate a 20
precise determination of the oligomer structures. In the MS/MS spectra, according to Fig. 8, fragment ions representing the respective starting and end groups A, B, X, Z, W, and Y of all isomers of the pseudomolecular ion appear together. Even for the alkyl vinyl ethers AVE, for which the fragment ions containing the starting groups X, A, and B and those containing the end groups Y, Z and W can be distinguished, fragment ions 25
of different pathways cannot clearly be attributed to specific isomers so far. It is thus, for example, unknown whether two of the three fragmentation pathways discussed in detail in the sections above and demonstrated in violet, red and green colours (Table 3a and b and Figs. A4a–d) are complementary and generated by the same isomer, or if
ACPD
6, 5629–5670, 2006
Ozonolysis of enol ethers: formation of
SOA and oligomers A. Sadezky et al. Title Page Abstract Introduction Conclusions References Tables Figures J I J I Back Close
Full Screen / Esc
Printer-friendly Version Interactive Discussion
EGU
all three pathways originate from different isomers.
MS/MS experiments allow to determine the minimum number of chain units n com-prised in an oligomer molecule. n is derived from the number of successive losses of the chain unit as a neutral molecule which are directly observed in the MS/MS spectra. Its values are given in Table 2 and in the MS spectra of the oligomers in Figs. A1a–d, 5
and are between 2 and 9 for most oligomers. The most abundant pseudomolecular ions contain 3 to 4 chain units.
4 Discussion
It might be essential to consider the role of the Criegee Intermediate (CI) in the forma-tion of oligomers. Indeed, the linking chain units observed in this study of the different 10
oligomers have the same elementary composition as the CIs: CH2O2 (=CH2OO for C1-CI) of mass 46 for the alkyl vinyl ethers (AVE) and C2H4O2(=CH3CHOO for C2-CI) of mass 60 for ethyl propenyl ether (EPE).
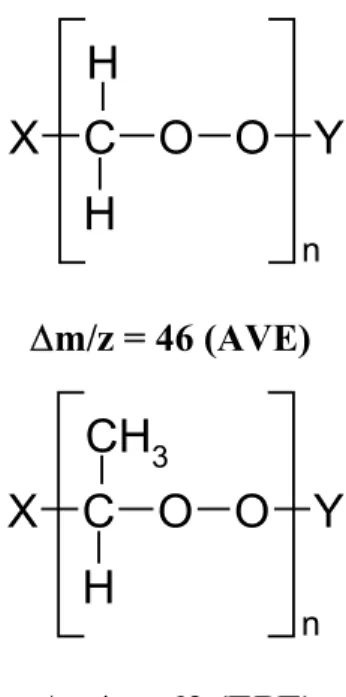
The structure of the oligomer, which is schematically shown in Fig. 8, is deduced from the fragmentation pattern of the main ions, obtained by ESI(+)/Q-TOF MS/MS, as 15
is displayed in Figs. A4a–d. The fragments, whose successive and systematic loss is observed in the fragmentation spectra, are neutral species with the chemical compo-sitions CH2O2 (mass 46) and C2H4O2 (mass 60), respectively for the AVE and EPE. Based on these observations, we suggest that the oligomer might have the following basic structure of an oligoperoxide shown in Fig. 9:
20
Moreover, the ozonolysis experiments performed in the presence of HCOOH, which is know to be an efficient Criegee Intermediate scavenger, have shown that the yield of SOA formation was drastically reduced, eventually suppressed, and that oligomers in detectable quantities are not formed. SOA formation is also strongly reduced in the presence of H2O (Sadezky, 2005). Consequently, this reaction obviously competes 25
with known reactions of the stabilized CI (SCI) with HCOOH or H2O, which lead to the formation of small gaseous peroxide compounds (Calvert et al., 2000). Oligoperoxide
ACPD
6, 5629–5670, 2006
Ozonolysis of enol ethers: formation of
SOA and oligomers A. Sadezky et al. Title Page Abstract Introduction Conclusions References Tables Figures J I J I Back Close
Full Screen / Esc
Printer-friendly Version Interactive Discussion
EGU
formation is thus another, so far unknown reaction of stabilized SCIs in the gas phase leading to SOA formation.
Oligomers have long time been recognized to be significant products of the ozonol-ysis in solutions (Barton et al., 2004; Lockley et al., 2001; and references therein). Early studies by Criegee (1957) speculated on the products of the ozonolysis incorpo-5
rated in the oligomeric structures, namely the CI, also called carbonyl oxide. Lockley et al. (2001) investigated the ozonolysis of tetramethylethylene (TME) at –60◦C and identified acetone cyclic di- and triperoxides, and substantial amounts of oligomeric peroxides of acetone carbonyl oxide. Both linear and cyclic oligomeric peroxides were inferred from GC-MS analysis. Also recently Barton et al. (2004) performed the ozonol-10
ysis of tetramethylethylene (TME) in pentane as a nonparticipating solvent at –60◦C yielding predominantly oligoperoxides with m/z up to 900 u, as identified by ESI/MS under soft ionization conditions. The peroxidic chain link of the mass peaks was of mass 74, which corresponds to the mass of the acetone carbonyl oxide (CH3)2COO, thus the CI formed in the ozonolysis of TME (Fig. 10). Up to 12 chain units were ob-15
served for different oligoperoxides. Moreover, these oligomeric compounds were found to be thermally stable when extracted and refluxed in methanol for a few hours (Barton et al., 2004).
In liquid phase, the formation of small peroxidic compounds in the presence of pro-tonic solvents or additives, such as H2O, alcohols and organic acids, is also well known 20
(e.g. Bunnelle, 1991; Thamm et al., 1996). In the liquid-phase ozonolysis of TME, oligoperoxide formation was only observed in non-protonated solvents (pentane) by Barton et al. (2004). The suppression of SOA and oligomer formation in the presence of HCOOH observed in the gas phase in this work is in analogy to the liquid-phase chemistry.
25
It is to be concluded that the CIs play a pertinent role in the oligomerization also in the gas phase. The mechanism of formation of the oligoperoxides found in the ozonolysis of enol ethers remains an enigma, since this type of repetitive chain structure involving CH2OO and CH3CHOO units has not been observed previously in gas phase reactions.
ACPD
6, 5629–5670, 2006
Ozonolysis of enol ethers: formation of
SOA and oligomers A. Sadezky et al. Title Page Abstract Introduction Conclusions References Tables Figures J I J I Back Close
Full Screen / Esc
Printer-friendly Version Interactive Discussion
EGU
Several studies have reported the formation of SOA in the gas phase oxidation of VOC and identified polymerization reactions in the presence (Tolocka et al., 2004; Gao et al., 2004) and absence (Kalberer et al., 2004; Ziemann, 2002, 2003; Zahardis et al., 2005) of preexisting acid seed aerosols. Most of these studies invoked oligomerization by acid-catalysed aldol condensation and gem-diol formation of main carbonyl prod-5
ucts of the ozonolysis reaction. Tolocka et al. (2004) reported oligomers in the SOA produced in the ozonolysis of α-pinene, which are formed from such reactions of pinon-aldehyde. Gao et al. (2004) observed formation of large oligomers (up to m/z1600) in the ozonolysis of a series of cyclic alkenes, and reported similar condensation re-actions among carbonyl reaction products. Kalberer et al. (2004) detected oligomers 10
in SOA formed during photooxidation of 1,3,5-trimethylbenzene, and attributed them to hydration-condensation reactions involving the main reaction products glyoxal and methylglyoxal. Peroxidic products were taken into consideration by other previous stud-ies: Ziemann (2002) suggested the formation of diacylperoxides that act as nucleating agents in the ozonolysis of cyclic alkenes. A mechanism was presented involving the 15
cross reaction of acylperoxy radicals, formed upon isomerisation and decomposition of excited Criegee Intermediates in air. In the presence of alcohols Ziemann (2003) invoked the formation of alkoxyhydroperoxy aldehydes, which were generated from the reaction of SCI with alcohols, and subsequently undergo intermolecular reaction to form cyclic peroxyhemiacetals. The only other study that so far reported reactions 20
among Criegee Intermediates was recently published by Zahardis et al. (2005). The authors studied the ozonolysis of oleic acid and identified secondary ozonides and cyclic geminal diperoxides, the latter being formed through the recombination of two SCI.
5 Conclusion
25
In this work, we investigated secondary organic aerosol (SOA) formation from the gas phase ozonolysis of enol ethers. In spite of the fact that these compounds consist of
ACPD
6, 5629–5670, 2006
Ozonolysis of enol ethers: formation of
SOA and oligomers A. Sadezky et al. Title Page Abstract Introduction Conclusions References Tables Figures J I J I Back Close
Full Screen / Esc
Printer-friendly Version Interactive Discussion
EGU
only 5 to 7 carbon atoms, significant SOA formation was observed. Chemical analysis of the formed SOA allowed us to suggest a new reaction mechanism for new SOA par-ticle formation: the oligomerization of Criegee Intermediates leading to the formation of oligoperoxidic chains with molecular weights up to 300 to 500 u. The suggested mech-anism is in agreement with the formation of oligoperoxidic compounds from Criegee 5
Intermediates, which was observed during liquid phase ozonolysis in earlier studies. Thus, in this work, we report the first observation of a similar reaction during gas phase ozonolysis. It is suggested that in the gas phase, oligoperoxides are formed from reac-tions of stabilized Criegee Intermediates, the detailed mechanisms of these reacreac-tions, however, are so far unknown and need further investigation.
10
Earlier studies have shown that the main tropospheric degradation mechanisms of unsaturated ethers are their reactions with ozone and OH radicals (Thiault et al., 2002). The present study shows that mixing ratios of a few hundred ppb of enol ether and ozone are sufficient for significant formation of SOA. However, stabilized Criegee In-termediates are expected to react mainly with water vapour in the troposphere to form 15
gaseous hydroxyhydroperoxides (Calvert et al., 2000), a reaction that has been shown to compete with other known reactions of stabilized Criegee Intermediates as well as with SOA formation (Sadezky, 2005; Bonn et al., 2002). The relevance of the observed oligoperoxide formation for SOA formation in the atmosphere has thus to be further investigated. In contrast to the other mechanisms of oligomer formation suggested to 20
contribute to tropospheric SOA formation, which always involve heterogeneous or mul-tiphase reactions on preexisting aerosol particles (e.g. Tolocka et al., 2004; Gao et al., 2004), the oligoperoxide formation observed in the present work takes place in the gas phase and obviously leads to new SOA particle formation by homogeneous nucleation of its reaction products.
ACPD
6, 5629–5670, 2006
Ozonolysis of enol ethers: formation of
SOA and oligomers A. Sadezky et al. Title Page Abstract Introduction Conclusions References Tables Figures J I J I Back Close
Full Screen / Esc
Printer-friendly Version Interactive Discussion
EGU
References
Barton, M., Ebdon, J. R., Foster, A. B., and Rimmer, S.: Ozonolysis of tetramethylethylene: Characterization of cyclic and open-chain oligoperoxidic products, J. Org. Chem., 69, 6967– 6973, 2004.
Bonn, B., Schuster, G., and Moortgat, G. K.: Influence of water vapor on the process of new
par-5
ticle formation during monoterpene ozonolysis, J. Phys. Chem. A, 106, 2869–2881, 2002. Bunnelle, W. H.: Preparation, properties, and reactions of carbonyl oxides, Chem. Rev., 91,
335–362, 1991.
Calvert, J. G., Atkinson R., Kerr J. A., Madronich S., Moortgat G. K., Wallington, T. J., and Yarwood, G.: The mechanisms of atmospheric oxidation of the alkenes, Oxford University
10
Press, 2000.
Chaimbault, P., Elfakir, C., and Lafosse, M.: Comparison of the retention behavior of polyethoxy-lated alcohols on porous graphitic carbon and polar as well as apolar-bonded silica phases, J. Chromatogr. A, 797, 83–91, 1998.
Criegee, R.: The course of ozonation of unsaturated compounds, Record Chem. Prog., 18,
15
111–120, 1957.
Finlayson, B. J., Pitts, J. N., and Akimoto, H.: Production of vibrationnally excited OH in chemi-luminescent ozone-olefin reactions, Chem. Phys. Lett., 12, 495–498, 1972.
Gao, S., Nga, L. N., Keywood, M., Varutbangkul, V., Bahreini, R., Nenes, A., He, J., Yoo, K. Y., Beauchamp, J. L., Hodyss, R. P., Flagan, R. C., and Seinfeld, J. H.: Particle phase acidity
20
and oligomer formation in secondary organic aerosol, Env. Sci. Technol., 38, 6582–6589, 2004.
George, C., Sidebottom, H., Mellouki, A., Barnes, I., Pilling, M., Herrmann, H., Wortham, H., Kirchner, F., Wirtz, K., and Zetzsch, C.: Multiphase chemistry of oxygenated species in the atmosphere, Final report, EVK2-CT-2001-00114, July, 2005.
25
Horie, O., Neeb, P., and Moortgat, G. K.: The reactions of the Criegee Intermediate CH3CHOO in the gas-phase ozonolysis of 2-butene isomers, Int. J. Chem. Kin., 29, 461–468, 1997. Kalberer, M., Paulsen, D., Sax, M., Steinbacher, M., Dommen, J., Prevot, A. S. H., Fisseha, R.,
Weingartner, E., Frankevich, V., Zenobi, R., and Baltensperger, U.: Identification of polymers as major components of atmospheric organic aerosols, Science, 303, 1659–1662, 2004.
30
Keul, H., Choi, H. S., and Kuczkowski, R. L.: Ozonolysis of enol ethers. Formation of 3-alkoxy-1,2-dioxolanes by concerted addition of a carbonyl oxide to an enol ether, J. Org. Chem., 50,
ACPD
6, 5629–5670, 2006
Ozonolysis of enol ethers: formation of
SOA and oligomers A. Sadezky et al. Title Page Abstract Introduction Conclusions References Tables Figures J I J I Back Close
Full Screen / Esc
Printer-friendly Version Interactive Discussion
EGU
3365–3371, 1985.
Klotz, B., Barnes, I., and Imamura, T.: Product study of the gas-phase reactions of O3, OH and NO3radicals with methyl vinyl ether, Phys. Chem. Chem. Phys., 6, 1725–1734, 2004. Koch, S., Winterhalter, R., Uherek, E., Kolloff, A., Neeb, P., and Moortgat, G. K.: Formation
of new particles in the gas-phase ozonolysis of monoterpenes, Atmos. Environ., 34, 4031–
5
4042, 2000.
Lockley, J. E., Ebdon, J. R., Rimmer, S., and Tabner, B. J.: Polymerization of methyl methacry-late initiated by ozonates of tetramethylethene, Polymer, 42, 1797–1807, 2001.
Neeb, P., Horie, O., and Moortgat, G. K.: The ethene-ozone reaction in the gas phase, J. Phys. Chem. A, 102, 6778–6785, 1998.
10
Odum, J. R., Hoffmann, T., Bowman, F., Collins, D., Flagan, R. C., and Seinfeld, J. H.: Gas/particle partitioning and secondary organic aerosol yields, Environ. Sci. Technol., 30, 2580–2585, 1996.
Pankow, J. F.: An absorption model of gas/particle partitioning involved in the formation of secondary organic aerosol, Atmos. Environ., 28, 189–193, 1994.
15
R ¨ompp, A.: Analysis of organic compounds in atmospheric aerosol by liquid chromatography-high resolution mass spectrometry (LC/MS/MS-TOF): method development and applications, PhD thesis, Johannes-Gutenberg University of Mainz, 2003.
Sadezky, A.: Ozonolyse d’ ´ethers insatur ´es: Etudes des m ´ecanismes en phase gazeuse et de la formation d’a ´erosol organique secondaire, PhD thesis, University of Orleans, 2005.
20
Seinfeld, J. H. and Pandis, S. N.: Atmospheric chemistry and physics: From air pollution to climate change, John Wiley & Sons Inc., New York, p. 738, 1998.
Seinfeld, J. H. and Pankow, J. F.: Organic atmospheric particular material, Annu. Rev. Phys. Chem., 54, 121–140, 2003.
Thamm, J., Wolff, S., Turner, W. V., G¨ab, S., Thomas, W., Zabel, F., Fink, E. H., and Becker,
25
K. H.: Proof of the formation of hydroperoxymethyl formate in the ozonolysis of ethene: Synthesis and FTIR spectra of the authentic compound, Chem. Phys. Lett., 258, 155–158, 1996.
Thiault, G., Th ´evenet, R., Mellouki, A., and Le Bras, G.: OH and O3initiated oxidation of ethyl vinyl ether, Phys. Chem. Chem. Phys., 4, 613–619, 2002.
30
Tolocka, M. P., Jang, M., Ginter, J. M., Cox, F. J., Kamens, R. M., and Johnston, M. V.: For-mation of oligomers in secondary organic aerosol, Environ. Sci. Technol., 38, 1428–1434, 2004.
ACPD
6, 5629–5670, 2006
Ozonolysis of enol ethers: formation of
SOA and oligomers A. Sadezky et al. Title Page Abstract Introduction Conclusions References Tables Figures J I J I Back Close
Full Screen / Esc
Printer-friendly Version Interactive Discussion
EGU
Winterhalter, R., Neeb, P., Grossmann, D., Kolloff, A., Horie, O., and Moortgat, G. K.: Products and mechanism of the gas phase reaction of ozone with β-pinene, J. Atmos. Chem., 35, 165–197, 2000.
Zahardis, J., LaFranchi, B. W., and Petrucci, G. A.: Photoelectron resonance capture ionization-aerosol mass spectrometry of the ozonolysis products of oleic acid particles:
5
Direct measure of higher molecular weight oxygenates, J. Geophys. Res., 110, D08307, doi:10.1029/2004JD005336, 2005.
Ziemann, P. J.: Evidence for low-volatility diacyl peroxides as a nucleating agent and major component of aerosol formed from reactions of O3with cyclohexene and homologous com-pounds, J. Phys. Chem. A, 106, 4390–4402, 2002.
10
Ziemann, P. J.: Formation of alkoxyhydroperoxy aldehydes and cyclic peroxyhemiacetals from reactions of cyclic alkenes with O3in the presence of alcohols, J. Phys. Chem. A, 107, 2048– 2060, 2003.
ACPD
6, 5629–5670, 2006
Ozonolysis of enol ethers: formation of
SOA and oligomers A. Sadezky et al. Title Page Abstract Introduction Conclusions References Tables Figures J I J I Back Close
Full Screen / Esc
Printer-friendly Version Interactive Discussion
EGU
Table 1. SOA formation during ozonolysis of alkyl vinyl ethers (AVE): SOA mass yields a (Eq. 1) and SOA formation thresholds∆AV Ethreshin comparison with the yields αiand partitioning co-efficients Ki of a hypothetical semi-volatile SOA constituent i (Eq. 4), and estimated saturation vapour pressures Pi◦(Eq. 5) and Pv ap(Eq. 6) of main SOA constituents.
AVE a (%) SOA formation threshold αi Ki P
◦ i Pv ap ∆AV Ethresh (%) (m 3 /µg) (µTorr) (µTorr) EVE* 3.5±0.2 (173±6) µg/m3(58±2) ppb 3.5±0.1 0.17±0.02 0.27 1.48 PVE* 3.8±0.2 (190±6) µg/m3(54±2) ppb 3.8±0.2 0.14±0.02 0.33 1.50 BVE* 4.3±0.4 (223±45) µg/m3(54±11) ppb 4.4±0.2 0.10±0.01 0.46 1.70 TBVE* 1.6±0.3 (407±88) µg/m3(100±22) ppb 1.4±0.2 0.20±0.06 0.23 1.17 IBVE* 4.4±0.1 (151±19) µg/m3(37±5) ppb 4.7±0.2 0.13±0.01 0.36 1.19 IBVE 0.9±0.1 (202±7) µg/m3(49±1) ppb 0.9±0.1 0.60±0.08 0.08 0.32 + excess of C6H12* MVE# 0.66±0.07 (162±38) µg/m368 ppb 0.66±0.13 0.98±0.27 0.05 0.33 * this work # Klotz et al. (2004)
ACPD
6, 5629–5670, 2006
Ozonolysis of enol ethers: formation of
SOA and oligomers A. Sadezky et al. Title Page Abstract Introduction Conclusions References Tables Figures J I J I Back Close
Full Screen / Esc
Printer-friendly Version Interactive Discussion
EGU
Table 2. Oligomer pseudomolecular ion series detected by ESI(+)/MS-TOF in the SOA formed during ozonolysis of enol ethers (n: minimum number of chain units determined by MS/MS experiments) (MW: molar weight [g/mol]).
Ether Ion Series (m/z)
n n=1 n=2 n=3 n=4 n=5 n=6 n=7 n=8 n=9 n = 10
Ethyl Propenyl Ether (MW 86 g/mol) EPE, C2H5OCH=CHCH3 265 293 339 325 353 399 357 385 413 459 417 445 473 489 519 477 533 549 579 609 639 669 699 729 759 789 (a) (B) (C) (D) (E)
Ethyl Vinyl Ether (MW 72g/mol) EVE, C2H5OCH=CH2 283 329 345 375 391 421 437 467 483 513 (a) (b)
Propyl Vinyl Ether (MW 86 g/mol) PVE, C3H7OCH=CH2 297 343 359 389 405 435 451 481 497 527 573 (a) (b)
n-Butyl Vinyl Ether
(MW 100 g/mol) BVE, C4H7OCH=CH2 295 341 293 357 387 339 403 433 385 449 465 479 431 495 511 525 477 541 557 571 523 587 603 617 633 649 663 679 695 (a) (b) (c) (d) iso-Butyl Vinyl Ether
(MW 100 g/mol) IBVE, (CH3)2CHCH2OCH=CH2 247 311 341 293 357 373 387 339 403 419 433 385 449 465 479 431 495 511 525 541 567 571 587 603 633 (a) (b) (c) (d) t-Butyl Vinyl Ether (MW 100
g/mol) TBVE, (CH3)3COCH=CH2 265 295 247 311 341 293 357 387 339 403 433 385 449 479 427 495 473 541 519 565 611 (a) (c) (d) (e)
ACPD
6, 5629–5670, 2006
Ozonolysis of enol ethers: formation of
SOA and oligomers A. Sadezky et al. Title Page Abstract Introduction Conclusions References Tables Figures J I J I Back Close
Full Screen / Esc
Printer-friendly Version Interactive Discussion
EGU
Table 3. (a) Ions of fragmentation pathways consisting of successive loss of chain unit∆m/z46, with or without conservation of the ether group RO, which were observed for the oligomer of type (a) formed in the ozonolysis of alkyl vinyl ethers (AVE) (MW: molar weight [g/mol]).
Ether
Parent Ions (m/z) Fragment Ion series (m/z) conserving RO Fragent Ion series (m/z) not-conserving RO
Ethyl Vinyl Ether (MW 72 g/mol) (EVE, C2H5OCH=CH2)
329, 375, 421, 467
403, 357, 311, 265, 219, 173, 127
339, 293, 247, 201, 155 374, 328, 282, 236, 190
Propyl Vinyl Ether (MW 86 g/mol) (PVE, C3H7OCH=CH2)
343, 389, 435, 481
417, 371, 325, 279, 233, 187, 141
353, 307, 261, 215, 169 388, 342, 296, 250, 204
n-Butyl Vinyl Ether (MW 100 g/mol)
(BVE, C4H7OCH=CH2)
357, 403, 449, 495
iso-Butyl Vinyl Ether (MW 100 g/mol)
(IBVE, (CH3)2CHCH2OCH=CH2)
357, 403, 449, 495
t-Butyl Vinyl Ether (MW 100 g/mol)
(TBVE, (CH3)3COCH=CH2) 357, 403, 449, 495 431, 385, 339, 293, 247, 201, 155 367, 321, 275, 229, 183 402, 356, 310, 264, 218 253, 207, 161, 115 313, 267, 221, 175, 129, 83 315, 269, 223, 177, 131, 85 225, 179, 133 329, 283, 237, 191, 145, 99 286, 240, 194, 148, 102