pISSN 1598-2254 eISSN 2093-9280 © The Korean Society of Plant Pathology
Aggressiveness in
Plasmopara halstedii (sunflower downy mildew)
Nachaat Sakr
INRA-UBP, UMR 1095, 234 Avenue du Brézet, 63100 Clermont-Ferrand, France (Received on November 22, 2010; Accepted on February 22, 2011)
Aggressiveness was studied in seven Plasmopara halstedii (sunflower downy mildew) pathotypes: 100, 300, 304, 314, 704, 710 and 714. Aggressiveness criteria including percentage infection, latent period, sporulation density and reduction of hypocotyl length (dwarfing) were ana-lysed in one sunflower inbred line showing a high level of quantitative resistance. Genetic relationships were detected between the seven pathotypes using 12 EST-derived markers. Pathotypes 100, 300, 304 and 314 were characterized with shorter latent period and higher sporulation density than pathotypes 710, 704 and 714. All pathotypes showed high percentage infection values and caused a large reduction in seedling size except for pathotype 314 involved in dwarfing. Pathotypes 714, 704 and 314 had an intermediary genetic position between the pathotypes 100 and 710. No correlation was detected between aggressiveness traits and EST geno-types.
Keywords : EST-derived markers, Helianthus annuus, quantitative resistance
Sunflower downy mildew is caused by Plasmopara halstedii ((Farl.) Berl. et Toni), an Oomycete specific to sunflower (Helianthus annuus L.), infected by soil- and seed- borne dissemination. Different physiological races (pathotypes) can attack a variable range of sunflower genotypes (Tourvieille de Labrouhe et al., 2000). To date, there are at least 35 races in different parts of the world (Gulya, 2007). Disease resistance in sunflowers to P. halstedii can be classified into one of two categories. The first is qualitative resistance which is conferred by the major Pl genes and tends to produce a disease-free plant (Tourvieille de Labrouhe et al., 2000). The second is quantitative resistance which is controlled by minor genes and tends to impact the rate of disease development (rate reducing) rather than producing a disease-free plant (Tourvieille de Labrouhe et al., 2008).
Concerning this pathosystem, several studies have been carried on virulence (Delmotte et al., 2008; Gulya, 2007; Spring et al., 2006; Tourvieille de Labrouhe et al., 2000, 2010) and more recently on aggressiveness (Sakr, 2009; 2010). Virulence has been defined as specific, causing abilities and aggressiveness as non-specific, disease-causing abilities (Van der Plank, 1968). Sakr (2009) found differences between two groups of 100, 300, 304 and 314 races and 710, 704 and 714 races by using two criteria of aggressiveness: latent period and sporulation density. More-over, Sakr (2010) noted that percentage infection and dwarfing could be used to differentiate aggressiveness in P. halstedii, but these criteria played a limited role in defining P. halstedii isolates according to their aggressiveness. Regarding genetic research in P. halstedii, the interaction of avirulence genes of P. halstedii and sunflower genotypes carrying Pl effective genes led a new virulence to appear in pathogen isolates. Today, the total P. halstedii races can overcome the resistance genes in seven of the nine downy mildew differential lines of H. annuus, and the Pl2 and Pl6 genes have each been overcome by eight races (Tourvieille de Labrouhe et al., 2000). Moreover, Spring et al. (2006) differentiated between populations of pathotypes 100, 310 and 330 and a group of populations representing pathotypes 700, 701, 703, 710 and 730. Also, Delmotte et al. (2008) identified three genetically differentiated groups of isolates organized around the first three races described in France: 100, 710 and 703. However, no studies on the correlation between aggressiveness traits and groups based on mole-cular markers for P. halstedii have been carried out. There-fore, our aim was to analyze the variation of aggressiveness in seven P. halstedii pathotypes belonging to several races in order to generate information about aggressiveness vari-ability of P. halstedii. The genetic relationships between the seven pathotypes were also analyzed using 12 EST-derived markers (Giresse et al., 2007) to clarify the correlation between aggressiveness traits and EST genotypes.
Materials and Methods
Fungal pathotypes. The seven P. halstedii pathotypes used in this study were collected in France and maintained at INRA, Clermont-Ferrand. Manipulation of this quarantine
*Corresponding author.
Phone) +963-11-2132580, FAX) +963-11-6112289 E-mail) [email protected]; [email protected]
Present address: Department of Agriculture, Syrian Atomic Energy Commission, Damascus, P.O. Box 6091, Syria
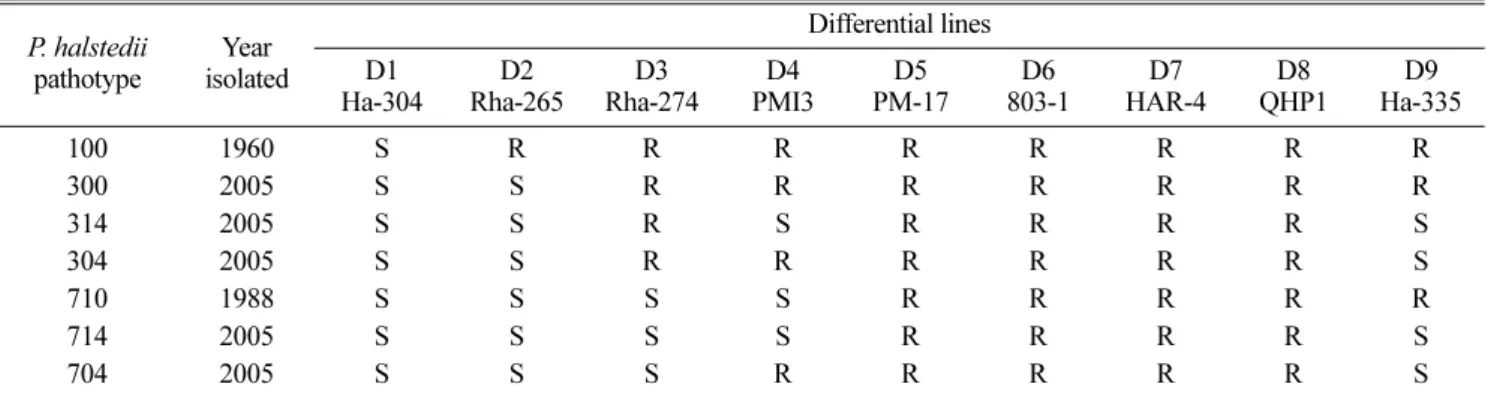
parasite was in compliance with European regulations (No 2003/DRAF/70). All pathotypes samples were taken from naturally infected sunflower plants. There were three replications for each differential line (10 plants in each replication) and the entire experiment was repeated twice for each P. halstedii pathotype. Pathotypes 100, 300, 304, 314, 710, 704 and 714 were determined using the method reported by Tourvieille de Labrouhe et al. (2000) (Table 1).
Measurement of aggressiveness in P. hasltedii pathotypes. To characterize aggressiveness of P. halstedii pathotype, one INRA inbred line FU was used. It carried no Pl gene, but is known to have a high level of quantitative resistance (Tourvieille de Labrouhe et al., 2008). Percentage infection was considered as successful when the seedlings showed sporulation of the pathogen on the shoot surface. Obser-vations were made 13 days after infection and expressed as the percentage of seedlings showing sporulation, whatever the plant parts concerned and the amount of the sporulation observed. Latent period was defined as the number of days of incubation necessary to obtain the sporulating pathogen on 80% of the plants. Sporulation density was defined as the number of zoosporangia of the pathogen produced on a cotyledon. Reduction of hypocotyl length (dwarfing) corre-sponded to the distance from the stem base to cotyledon insertion and was measured after 13 days of infection on diseased plants showing sporulation of the pathogen on the shoot (Sakr, 2009; 2010). All the pathogenic tests were carried out in growth chambers regulated at 18hrs of light, 18 °C ± 1 and RH of 65−90%. All statistical analyses of the aggressiveness data were performed using Stat Box 6.7® (GimmerSoft) software. The values obtained were sub-mitted to a one-way analysis of variance (ANOVA). The Newman-Keuls test (Snedecor and Gochran, 1989) was used to compare the means at P = 0.05. The sample correlation coefficients (Pearson r) were calculated at P = 0.01 and P = 0.05.
DNA extraction and molecular typing. The 12 EST-derived markers were used because the other molecular markers were non-specific, insufficiently polymorphic within P. halstedii and no genetic structure in P. halstedii popula-tions was identified by using these markers (Delmotte et al., 2008). For each pathotype, DNA was isolated from infected plant tissue as previously described for Plasmopara viticola by Delmotte et al., (2006). The 12 polymorphic EST-derived markers (Giresse et al., 2007) were then used to genotype the P. halstedii pathotypes. The polygenetic relations bet-ween the seven pathotypes were obtained by building a Neighbour-joining (NJ) tree (Jin and Chakraborty, 1993) and by using Populations 1.2.28 Software (Langella, 1999). A Bootstrap analysis was performed on 10.000 replicates. It is possible that no genetic structure in P. halstedii popula-tions was identified in previous studies
Results
Analysis of aggressiveness criteria
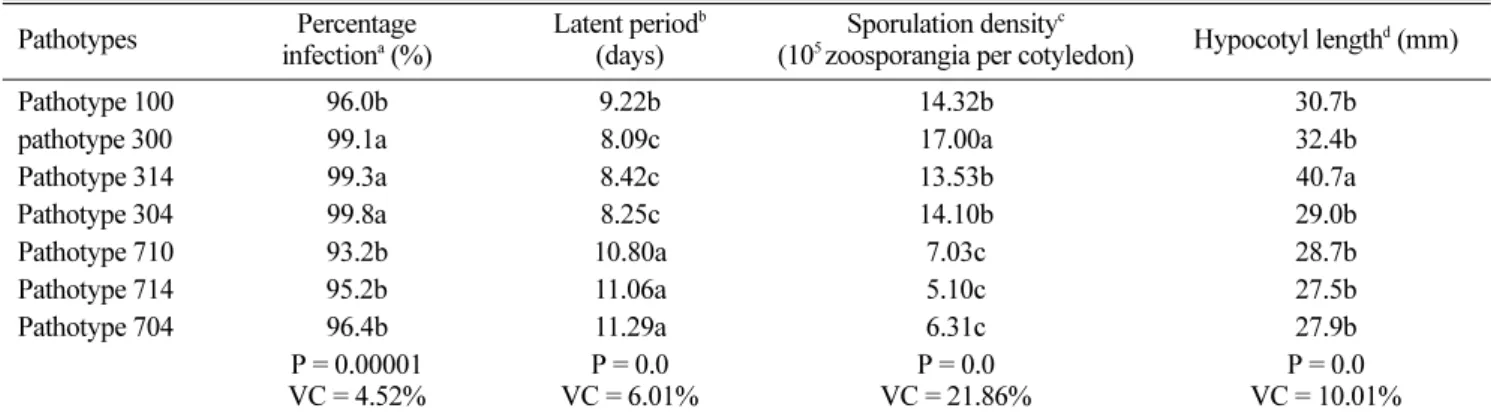
Percentage infection. The analysis of variance indicated highly significant differences (Probability = 0.00001; Vari-ation coefficient = 4.52%) between P. halstedii pathotypes (Table 2). The Newman-Keuls test showed that the patho-types formed two very distinct groups. The first group con-taining the pathotypes 300, 304 and 314 showed a higher infection level than the second group containing the pathotypes 100, 710, 704 and 714.
Latent period. Analysis of the relation between sporu-lation percentage based on incubation period (Fig. 1) showed differences in behaviour among P. halstedii patho-types. There were two main groups from day 8 onwards: pathotypes 100, 300, 304 and 314 sporulated faster than pathotypes 710, 704 and 714. All infected plants with pathotypes 100 and 3xx showed more than 80% sporulation 9 days after incubation, whereas pathotypes 7xx needed 11
Table 1. Virulence of seven Plasmopara halstedii isolates on nine sunflower differential lines P. halstedii pathotype Year isolated Differential lines D1 Ha-304 D2 Rha-265 D3 Rha-274 D4 PMI3 D5 PM-17 D6 803-1 D7 HAR-4 D8 QHP1 D9 Ha-335 100 1960 S R R R R R R R R 300 2005 S S R R R R R R R 314 2005 S S R S R R R R S 304 2005 S S R R R R R R S 710 1988 S S S S R R R R R 714 2005 S S S S R R R R S 704 2005 S S S R R R R R S
days after incubation to reach the same level of sporulation. There were highly significant differences between P. halstedii pathotypes (Probability = 0.0; Variation Coefficient = 6.01%). The Newman-Keuls test classified the patho-types into three distinct groups (Table 2). Those with the shortest length of latent period (< 9 days) were the patho-types 300, 304 and 314. Pathotype 100 was intermediate. The pathotypes 710, 704 and 714 were grouped together and showed longer latent periods (> 10 days).
Sporulation density. Fig. 2 shows that the quantities of zoosporangia produced increased with time. There were two main groups from day 9 onwards: pathotypes 100, 300, 314 and 304 produced more zoosporangia than pathotypes 710, 714 and 704 (Fig. 2). The quantity of zoosporangia produced was at a maximum 12 days after incubation.
There were large differences between the pathotypes; sporulation density varied from 5 × 10⁵ zoosporangia per ml for pathotype 714 to 17 × 105 zoosporangia per ml for
Table 2. Aggressiveness among seven Plasmopara halstedii pathotypes measured on the sunflower inbred line FU Pathotypes Percentage
infectiona (%)
Latent periodb (days)
Sporulation densityc
(105 zoosporangia per cotyledon) Hypocotyl length
d (mm)
Pathotype 100 96.0b 9.22b 14.32b 30.7b
pathotype 300 99.1a 8.09c 17.00a 32.4b
Pathotype 314 99.3a 8.42c 13.53b 40.7a
Pathotype 304 99.8a 8.25c 14.10b 29.0b Pathotype 710 93.2b 10.80a 7.03c 28.7b Pathotype 714 95.2b 11.06a 5.10c 27.5b Pathotype 704 96.4b 11.29a 6.31c 27.9b P = 0.00001 VC = 4.52% P = 0.0 VC = 6.01% P = 0.0 VC = 21.86% P = 0.0 VC = 10.01%
aNumber of replications = 3, 60 plants per replication, bNumber of replications = 3, 10 plants per replication, cNumber replication = 2, 18 counts
per replication and dNumber of replications = 3, 10 plants per replication (Sakr, 2009; 2010); according to the Newman-Keuls test, means fol-lowed by the same letter are not significantly different at P = 0.05, Probability (P), Variation Coefficient (VC).
Fig. 1. Sporulation of seven Plasmopara halstedii pathotypes of different races on the sunflower inbred line ‘FU’, based on incubation period.
Fig. 2. Sporulation density of seven Plasmopara halstedii pathotypes of different races on sunflower inbred line ‘FU’, based on incubation period.
pathotype 300 (Table 2). Differences were highly signifi-cant (Probability = 0.0; Variation Coefficient = 21.86%). The Newman-Keuls test classified the pathotypes into three very distinct groups (Table 2). Pathotypes 710, 704 and 714 showed the lowest sporulation density (< 7.05 × 10⁵ zoo-sporangia per cotyledon). Pathotypes 100, 304 and 314 were intermediate. Pathotype 300 had the highest sporulation density.
Reduction of hypocotyl length. Diseased plants had hypocotyls with only one third the mean lengths of healthy plants (30.9 ± 2.9 mm and 90.0 ± 2.3 mm respectively) whatever the pathotype of P. halstedii. Analysis of variance showed highly significant differences between pathogen pathotypes (Probability = 0.0; Variation coefficient = 10.01%). However, these results were mainly due to pathotype 314 (Table 2) which caused less reduction in hypocotyl length (40.7 mm) than the other six pathotypes (mean 29.4 mm). There was significant correlation among some aggressive-ness criteria (Table 3). Latent period was negatively corre-lated with sporulation density at P = 0.01 and with percent-age infection at P = 0.05.
Molecular analysis
The combination of 12-EST derived markers revealed five multilocus genotypes (MLG) among seven P. halstedii pathotypes (Table 4). Pathotypes 100 and 710 were differ-ent for all genomic markers excepting Pha54. Furthermore,
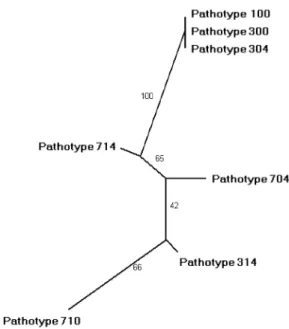
pathotypes 100, 300 and 314 had the same genetic back-ground. The Neighbour-joining tree showed that pathotype 714, 704 and 314 had an intermediary genetic position between pathotypes 100 and 710 (Fig. 3).
Discussion
Understanding the interaction between pathogen and its host plant requires knowledge of the variability of patho-genicity. With this in mind, the variability of aggressiveness and its alternation with genetic variation was studied by using seven Plasmopara halstedii pathotypes of several races. Differences in aggressiveness of P. halstedii patho-types are indicated when pathopatho-types vary in the amount of damage that they cause in sunflower plants. Some aggre-ssiveness criteria measured in the present study showed significant correlation with each other (Table 3). These
Table 3. Correlation coefficients on inbred line FU among criteria of aggressiveness for seven pathotypers of Plasmopara halstedii
Sporulation density Latent period Hypocotyl length Percentage infection Sporulation density 1.000 −0.959** 0.533 ns 0.743 ns Latent period 1.000 −0.609 ns −0.832* Hypocotyl length 1.000 0.222ns Percentage infection 1.000 *P = 0.05, **P = 0.01, ns = no significant
Table 4. Multilocus genotypes (MLG) characterized using 12 EST-derived genomic markers on the pathotypes of Plasmopara halstedii
Pathotype EST-derived markers
Pha6 Pha39 Pha42 Pha43 Pha54 Pha56 Pha74 Pha79 Pha82 Pha99 Pha106 Pha120
100 2/2 2/2 1/1 1/1 1/1 1/1 1/1 3/3 2/2 2/2 1/1 2/2 304 2/2 2/2 1/1 1/1 1/1 1/1 1/1 3/3 2/2 2/2 1/1 2/2 300 2/2 2/2 1/1 1/1 1/1 1/1 1/1 3/3 2/2 2/2 1/1 2/2 314 1/1 2/2 1/1 2/2 1/1 2/2 2/2 3/3 2/2 1/1 2/2 1/1 704 2/2 2/2 2/2 1/1 1/1 1/1 2/2 3/3 1/1 1/1 2/2 1/1 714 1/1 2/2 1/2 1/1 1/1 1/1 1/1 3/3 2/2 1/1 2/2 1/1 710 1/1 1/1 2/2 2/2 1/1 2/2 2/2 1/1 1/1 1/1 2/2 1/1
Fig. 3. Phylogenetic tree according to Neighbour-joining analysis of 12 EST-derived markers. Figures on branches indicate bootstrap values (10.000 replicates).
results are not in accordance with those found by Carlisle et al. (2002) for another Oomycete Phytophthora infestans. They showed a strong correlation among the four criteria of aggressiveness: latent period, frequency of infection, area under the lesion expansion curve and sporulation capacity, were strongly correlated. In this study, the correlation between latent period and sporulation density (r =−0.959) could be explained by specialisation in aggressiveness towards tissue invasion and sporulation. The frequency of sporulated plants based on incubation period reflected the speed of appearance of symptoms on the plants (Fig. 1) (latent period), and the number of zoosporangia produced by cotyledons reflected the level of invasion of infected tissues (Fig. 2).
High percentage infection, short latent period, high sporulation density, and significant reduction in the length of the hypocotyl represent high aggressiveness (Sakr, 2009; 2010). Our results show that two criteria, latent period and sporulation density, differentiated seven pathotyes. Patho-types 100, 300, 314 and 304 had a shorter latent period and higher sporulation density than pathotypes 710, 714 and 704. In the pathosystem Phytophthora infestans/potato, Montarry et al. (2006) showed that the most highly aggre-ssive isolates had a shorter latent period and higher sporulation capacity than the less aggressive isolates. The very high percentages of infection can be explained by the ideal test conditions for the parasite (Meliala et al., 2001). Similar to our results, Tourvieille de Labrouhe et al. (2010) found that values of percentage infection varied between 98.7 and 100% for P. halstedii isolates. However, Carlisle et al. (2002) found that values of infection frequency for different P. infestans isolates, measured on a potato variety showing high level of quantitative resistance, ranged bet-ween 27 and 85%. Table 2 shows that all the pathotypes caused a large reduction in seedling size except for patho-type 314, compared to the growth of P. halstedii-free sun-flower inbred line FU. Regarding the same pathosystem, Tourvieille de Labrouhe et al. (2010) showed that this character may be used to differentiate aggressiveness in a pathogen. Our results differ from those found by Sinclair and Griffiths (2000) for ash yellow phytoplasmas. They reported that various strains caused growth suppression ranging from slight, intermediate to severe in comparison to growth of phytoplasma-free plants. Based on important differences in the two aggressiveness criteria, latent period and sporulation density, between P. halstedii pathotypes (Table 2), we were able to divide them into two main groups. The first (more aggressive) group includes isolates of races 100 and 3xx, while the other group (less aggre-ssive) is composed of isolates of races 7xx. These results are comparable with those found by Sakr (2009, 2010), who demonstrated that latent period and sporulation density
could be used to define aggressiveness in P. halstedii populations. The other two criteria used in the present study played a limited role in the differentiation of aggressive-ness.
By using the same EST-derived markers, Delmotte et al., (2008) found that races 100, 300 and 304 had the same genetic clade as observed in our study (Fig. 3). Delmotte et al. (2008) grouped races 710, 704 and 714 together in the same genetic clade; however, this association was not identified in the present work. Either the isolates used in our study were different from the ones used by Delmotte et al. (2008), or the intrarace variance in the EST-derived marker may explain the different results reported. However, the distinctiveness of the 7xx races compared to those of races 100 or 3xx has recently been shown based on ITS sequence data (Spring et al., 2006). No correlation was detected between aggressiveness traits (Table 2) and EST genotypes. The lack of matching between aggressiveness traits and groups based on molecular markers was not surprising. Indeed, Montarry et al. (2006) did not find a clear corre-lation between phenotypes (aggressiveness) and genotypes based on AFLP markers for Phytophthora infestans. Aggre-ssiveness is known to evolve through mutation without highly altering molecular fingerprints (Goodwin, 1997). Because most molecular markers used for fingerprinting are selectively neutral, they can be used to assess evolu-tionary forces other than selection (such as gene flow or genetic drift). However, regarding Sphaeropsis sapinea, De Wet et al. (2003) found that aggressiveness groups A, B and C were separated into three differential clades. Further studies will be necessary to investigate aggressiveness and genetic variability on a large collection of P. halstedii pathotypes with different races from several parts of the world in order to provide better insight into interactions between this obligate parasite and its host.
Aacknowledgements
I would like to thank Elizabeth Eshom Nicolas for critical reading of this manuscript.
References
Carlisle, D. J., Cooke, L. R., Watson, S. and Brown, A. E. 2002. Foliar aggressiveness of Northern Ireland isolates of Phytoph-thora infestans on detached leaflets of three potato cultivars. Plant Pathol. 51:424−434.
De Wet, J., Burgess, T., Slippers, B., Preisig, O., Wingfield, B. D. and Wingfield, M. J. 2003. Multiple gene genealogies and microsatellite markers reflect relationships between morpho-types of Sphaeropsis sapinea and distinguish a new species of Diplodia. Mycol. Res. 107:557−566.
D., Giresse, X., Mondorgenson, G. and Corio-Costet, M. F. 2006. Microsatellite DNA markers for Plasmopara viticola, the causal agent of downy mildew of grapes. Mol. Ecol. Notes 6:379−381.
Delmotte, F., Giresse, X., Richard-Cervera, S., M’Baya, J., Vear, F., Tourvieille, J., Walser, P. and Tourvieille de Labrouhe D. 2008. Single nucleotide polymorphisms reveal multiple intro-ductions into France of Plasmopara halstedii, the plant patho-gen causing sunflower downy mildew. Infect. Genet. Evol. 8: 534−540.
Giresse, X., Tourvieille de Labrouhe, D., Richard-Cervera, S. and Delmotte, F. 2007. Twelve polymorphic EST-derived markers for Plasmopara halstedii, the causal agent of sunflower downy mildew. Mol. Ecol. Notes 7:1363−1365.
Goodwin, S. B. 1997. The population genetics of Phytophthora. Phytopathology 87:462−473.
Gulya, T. J. 2007. Distribution of Plasmopara halstedii races from sunflower around the world. Proc. II International Downy Mildew Symposium. Palcky University in Olomouc and JOLA, Czech Republic, July 2−6. pp. 135−142.
Jin, L. and Chakraborty, R. 1993. Estimation of genetic distance and coefficient of gene diversity from single-probe multilocus DNA fingerprinting data. Mol. Biol. Evol. 10:1112−1114. Langella, O. 1999. Populations 1.2.28 software. Available on line
in http:// www.pge.cnrsgif.fr/bioinfo/populations.
Meliala, C., Vear, F. and Tourvieille de Labrouhe, D. 2000. Rela-tion between date of infecRela-tion of sunflower downy mildew (Plasmopara halstedii) and symptoms development. Helia 23:35−44.
Montarry, J., Corbiere, R., Lesueur, S., Glais, I. and Andrivon, D. 2006. Does selection by resistant hosts trigger local adaptation
in plant-pathogen systemes?. J. Evolution Biol. 19:522−531. Sakr, N. 2009. Variation in aggressiveness of Plasmopara
halste-dii (sunflower downy mildew). J. Plant Dis. Protect. 116:247− 251.
Sakr, N. 2011. Can percentage infection and dwarfing be used to differentiate aggressiveness in Plasmopara halstedii? Arch. Phy-topathol. Plant Protect. DOI: 10.1080/03235408.2010.499692. Sinclair, W. A. and Griffiths, H. M. 2000. Variation in
Aggressive-ness of Ash Yellows Phytoplasmas. Plant Dis. 84:282−288. Snedecor, G. W. and Gochran, W. G. 1989. Statistical Methods.
The Iwoa State University Press, Iowa, USA. 528 pp. Spring, O., Bachofer, M., Thines, M., Riethmuller, A., Goker, M.
and Oberwinkler, F. 2006. Intraspecific relationship of Plas-mopara halstedii isolates differing in pathogenicity and geo-graphic origin based on ITS sequence data. Eur. J. Plant Pathol. 114:309−315.
Tourvieille de Labrouhe, D., Bordat, A., Tourvieille, J., Mestries, E., Walser, P., Sakr, N., Ducher, M., Delmotte, F. and Vear, F. 2010. Impact of major gene resistance management for sun-flower on fitness of Plasmopara halstedii (downy mildew) populations. Oleagineux Corps Gras Lipides 17:56−64. Tourvieille de Labrouhe, D., Pilorge, E., Nicolas, P. and Vear, F.
2000. Le mildiou du tournesol. CETIOM-INRA, Versailles, France. 176 pp.
Tourvieille de Labrouhe, D., Serre, F., Roche, S., Walser, P. and Vear, F. 2008. Quantitative resistance to downy mildew (Plas-mopara halstedii) in sunflower (Helianthus annuus). Euphyt-ica 164:433−444.
Van der Plank, J. E. 1968. Disease resistance in plants. Academic Press, New York and London, USA and UK. 206 pp.