*fl3~
COOLING OF HIGH-POWER-DENSITY COMPUTER COMPONENTS A. E. Bergles N. Bakhru J. W. Shires, Jr.FEB
.5 1969
RARIES Report No. DSR 70712-60Department of Mechanical Engineering Engineering Projects Laboratory
Massachusetts Institute of Technology
November 1968
ENGINEERING PROJECTS LABORATORY 7NGINEERING PROJECTS LABORATOR
4GINEERING PROJECTS LABORATO' IINEERING PROJECTS LABORAT'
NEERING PROJECTS LABORA 'EERING PROJECTS LABOR
ERING PROJECTS LABO RING PROJECTS LAB'
ING PROJECTS LAj 4G PROJECTS L F PROJECTS PROJECTr OJECK '~)JEr TT
COOLING OF HIGH-POWER-DENSITY COMPUTER COMPONENTS
A. E. Bergles N. Bakhru
J. W. Shires, Jr.
for
Heat Transfer Development Laboratory Systems Development Division
International Business Machines Corporation Poughkeepsie, New York 12602
November 1968
DSR Projects 70148 and 70712
Heat Transfer Laboratory Engineering Projects Laboratory Department of Mechanical Engineering
Massachusetts Institute of Technology Cambridge, Massachusetts 02139
ABSTRACT
This report summarizes work carried out during the first two years of a research program sponsored by IBM Corporation. This study has elucidated a number of the heat-transfer characteristics of several fluorochemicals which have potential application as coolants for high power density computer components.
Single-phase heat-transfer coefficients have been determined for Freon-113 and FC-78 flowing in a rectangular channel with one of the wide sides heated. Heat-transfer coefficients for the short channels are sig-nificantly higher than those predicted by conventional correlations due
to entrance effects and superimposed free convection. Uncertainties as to the actual values of certain thermophysical properties introduce cor-responding uncertainty in correlation.
Subcooled flow boiling data were taken with the rectangular channel for a wide variety of fluid-surface combinations, and over a wide range of flow conditions. These data should facilitate a close estimate of surface temperatures in actual systems. Data taken with an annular test section delineated hysteresis effects which were tentatively identified in the rectangular channel tests.
Pool boiling tests indicated large temperature overshoots in the boiling curve with Freon-113. It was found that conventional correlations
do not adequately describe critical heat flux data for horizontal circular heaters. The critical heat flux increases as diameter decreases, and in-creases as the wall thickness inin-creases.
The observed hysteresis effects in pool and flow boiling were examined in detail. It is suggested that the phenomenon of temperature overshoot hysteresis is due to two causes: a) the existence of metastable bubbles which are triggered only at sufficiently high disturbance level, and b) the deactivation of larger nucleation sites by displacing the vapor
by liquid during subcooling. Under conditions of low velocity or pool
boiling, a) is probably most important, but at high velocity b) should be controlling. Increased heat-transfer coefficients observed prior to nucleation appear to be due to thermocapillary circulation induced by
the metastable bubbles.
It is demonstrated that a random array of Teflon pits on the surface is effective in augmenting heat transfer for pool boiling or low velocity flow boiling of water; however, there is no improvement in heat transfer with boiling of Freon-113 or FC-78. The mechanism of augmentation is
examined from the standpoint of incipient boiling, and a plausible explana-tion for this behavior is suggested.
An investigation of the factors controlling the void fraction for subcooled boiling was carried out with a horizontal visual section using Freon-113 and Freon TA. The observed point of net vapor generation was much farther upstream than that indicated by a recent prediction, due primarily to the dominance of the buoyant force. An examination of the void collapse in the unheated downstream portion of the tube revealed
that bubble collapse theory cannot be used to predict the void fraction. The large void fractions produced by boiling fluorochemicals can be minimized by using twisted-tape inserts.
TABLE OF CONTENTS Title Page 1 Abstract 2 List of Figures 6 Nomenclature 8 1. Introduction 10 2. Experimental Facilities 173 2.1 Test Stands 13
2.1.1 High Power Freon Loop 13
2.1.2 High Power Water Loop 15
2.1.3 Pool Boiling Apparatus 16
2.1.4 Freon Visual Loop 17
2.2 Test Sections 18
2.2.1 Rectangular Channel 18
2.2.2 Annulus 19
2.2.3 Pool Boiling Test Sections 21
2.2.4 Visual Test Section 21
2.2.5 Specialized Instrumentation for Visual Test Section 23
3. Rectangular Channel Studies 25
3.1 Experimental Procedure and Data Reduction 25
3.2 Nonboiling Results 27
3.3 Subcooled Boiling Results 30
3.3.1 Boiling Curve Trends 30
3.3.2 Effect of Surface Finish on Flow Boiling 32
3.3.3 Effect of Material on Flow Boiling 33
3.3.4 Effect of Fluid on Boiling Heat-Transfer Characteristics 33
3.3.5 Effect of Pressure on Flow Boiling 33
3.3.6 Composite Boiling Curve 34
3.3.7 Influence of Teflon Spots on Boiling Heat Transfer 35
4. Annulus Studies 37
4.1 Experimental Procedure and Data Reduction 37
4.2 Freon Tests 38
4.2.1 Non-Boiling Results 38
4.2.2 Subcooled Boiling Results 39
4.3 Water Tests 39
4.3.2 Subcooled Boiling Results 40 4.3.3 Influence of Teflon Spots on Boiling Heat Transfer 40
15. Pool Boiling Studies 42
5.1 Experimental Procedure and Data Reduction 42
5.2 Freon-113 Tests 42
5.2.1 Boiling Curves for Standard Surface 42 5.2.2 Influence of Teflon Spots on Boiling Heat Transfer 44
5.3 Water Tests 44
5.3.1 Boiling Curves for Standard Surface 44 5.3.2 Influence of Teflon Spots on Boiling Heat Transfer 44
5.4 Critical Heat Flux for Circular Heaters 45
5.4.1 Introduction 45
5.4.2 Experimental Procedure 46
5.4.3 Effect of Diameter on CHF 47
5.4.4 Effect of Wall Thickness on CHF 48
6. Discussion of Hysteresis and Augmentation 49
by Means of Teflon Spots
6.1 Hysteresis Effects in Pool and Flow Boiling 49
6.1.1 Introduction 49
6.1.2 The Case for Metastable Bubbles 50
6.1.3 Thermocapillarity 52
6.1.4 The Role of Cavity Deactivation 53
6.2 Augmentation of Boiling Heat Transfer by Means of 55
Teflon Spots
6.2.1 Pool Boiling 55
6.2.2 Flow Boiling 58
7. Subcooled Void Fraction Observations in Freon-Type Liquids 59
7.1 Introduction 59
7.2 Void Fraction Characteristics Within the Heated Section 60
7.2.1 General Considerations 60
7.2.2 Experimental Procedure 61
7.2.3 Results and Discussion 62
7.3 Bubble Collapse Downstream of Heated Section 63
7.3.1 Bubble Collapse Theory 63
7.3.2 Experimental Procedure 64
7.3.3 Results and Discussion 65
8. Conclusions 69
Acknowledgments 72
Appendix 1 Physical Property Sources 73
Appendix 2 Analytical Predictions for Flow Between 76
Parallel Plates With One Plate Heated
Appendix 3 Contact Angle Measurements 79
Appendix 4 Tabulation of Critical Heat Flux Data 81
Appendix 5 Tabulation of Data for Subcooled Void 82
Fraction Observations
"Figures 84
-6-LIST OF FIGURES
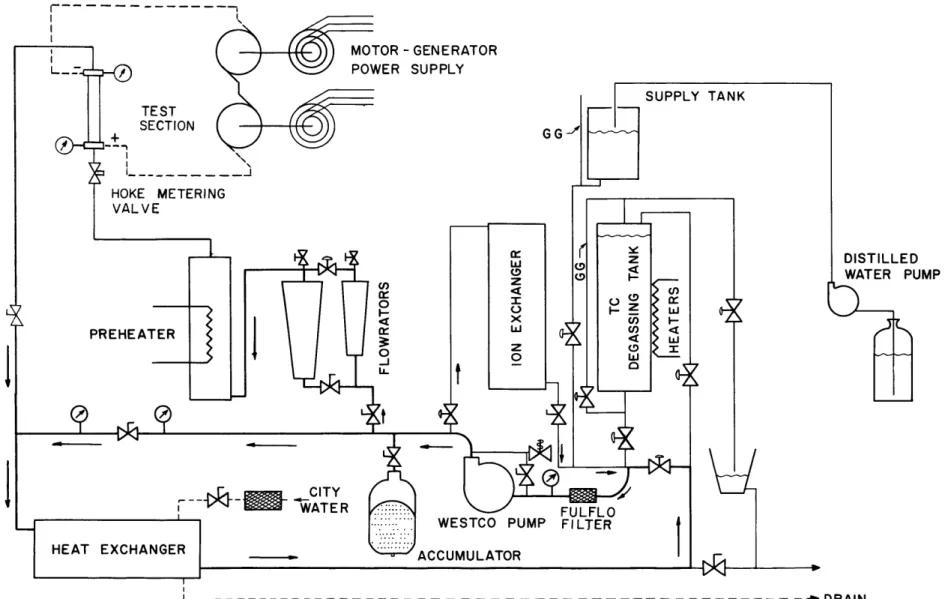
1. Schematic Layout of High Power Freon Loop
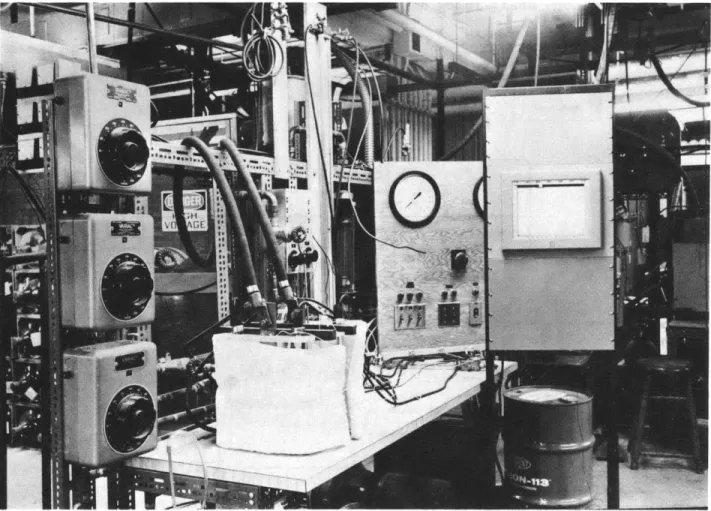
2. High Power Freon Test Stand, Rigged for Pool Boiling Experiments
3. Schematic Layout of High Power Water Loop
4. Pool Boiling Apparatus
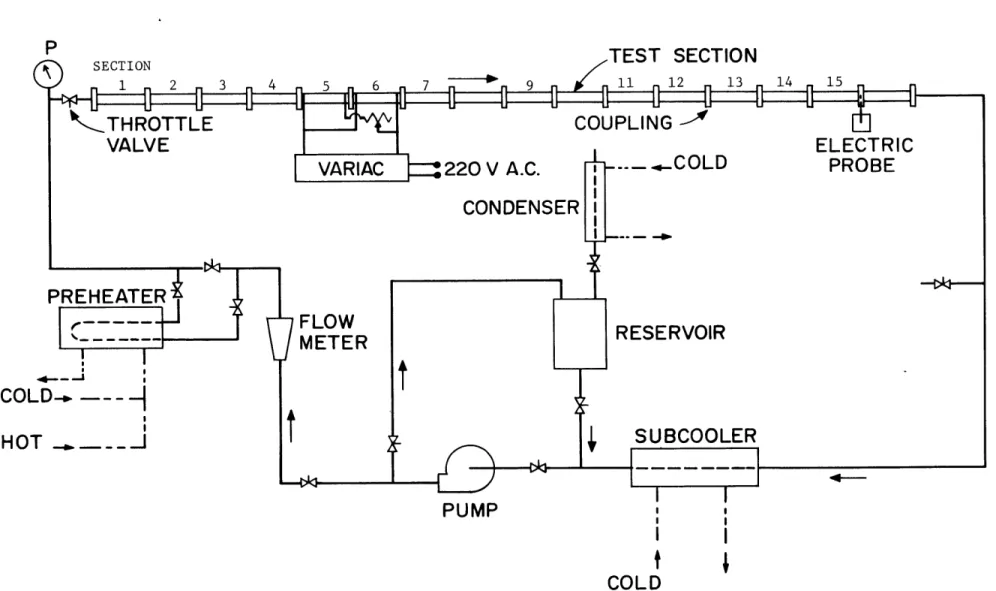
5. Schematic Layout of Freon Visual Loop 6. Annular Test Section
7. Pool Boiling Test Section and Instrumentation 8. Photograph of Freon Visual Loop, Showing Details
of Visual Test Section
9. Probe Circuit Diagram
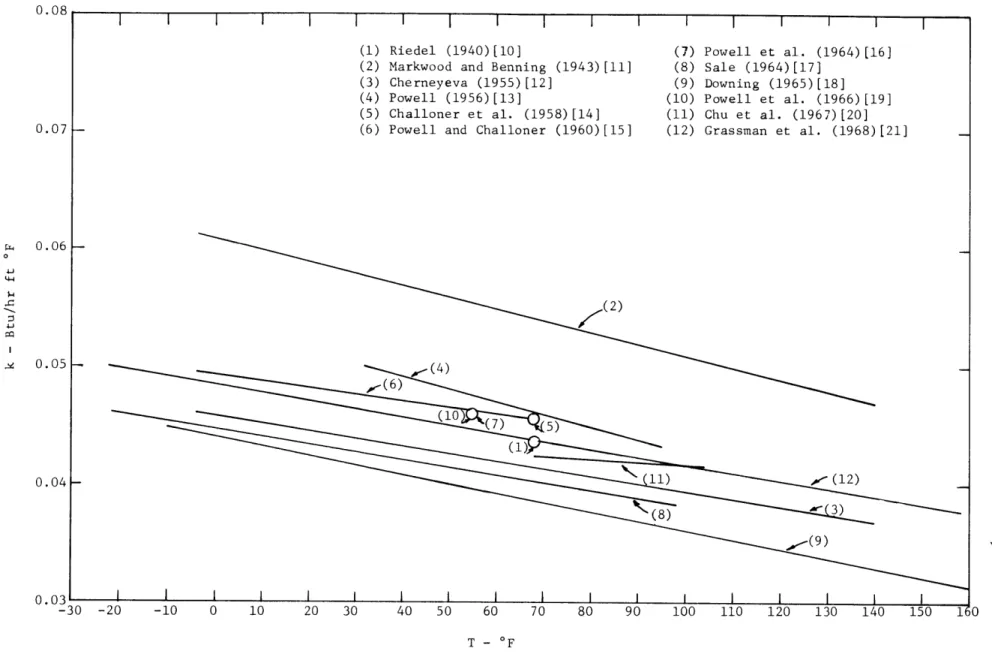
10. Composite of Data for Thermal Conductivity of Freon-113 11. Test-Section Temperature Profiles for Non-Boiling Conditions
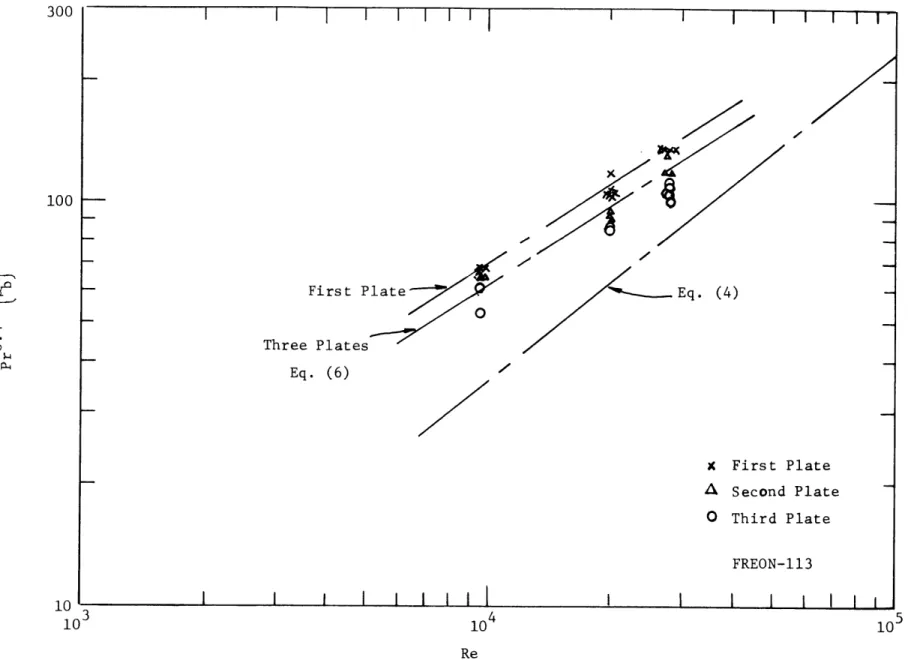
12. Correlation of Non-Boiling Data for Three Plates
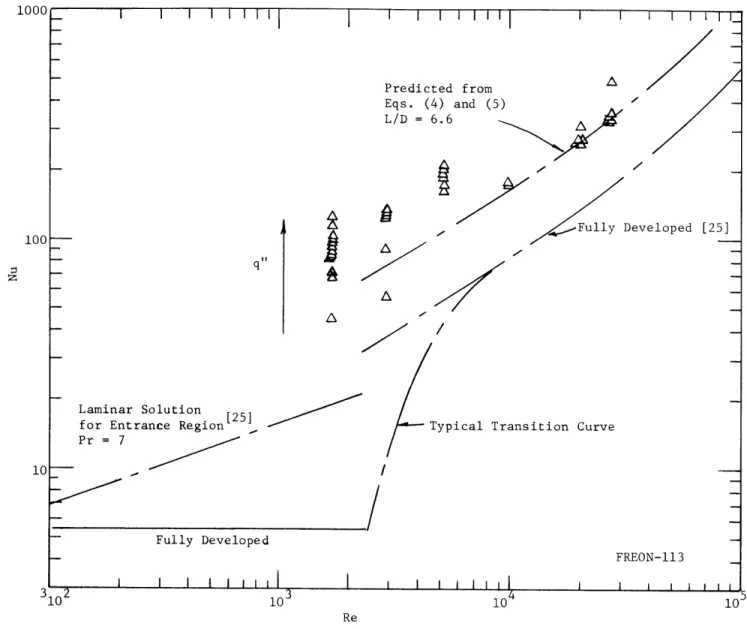
13. Comparison of Non-Boiling Data for a Single Plate
with Predictions for Flow in a Tube
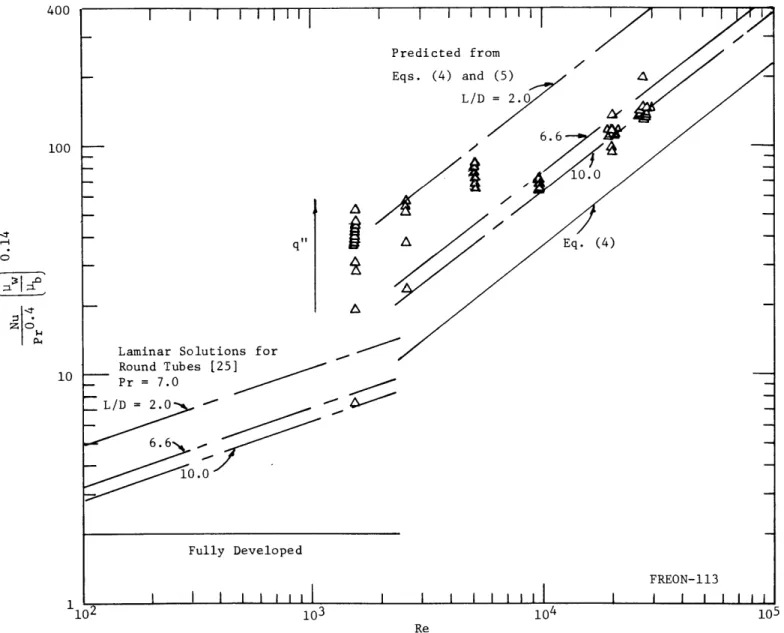
14. Comparison of Non-Boiling Data for a Single Plate with Predictions for Flow Between Parallel Plates
15. Non-Boiling Data for FC-78
16. Flow Subcooled Boiling - Average of Three Plates
17. Flow Subcooled Boiling - Single Plate
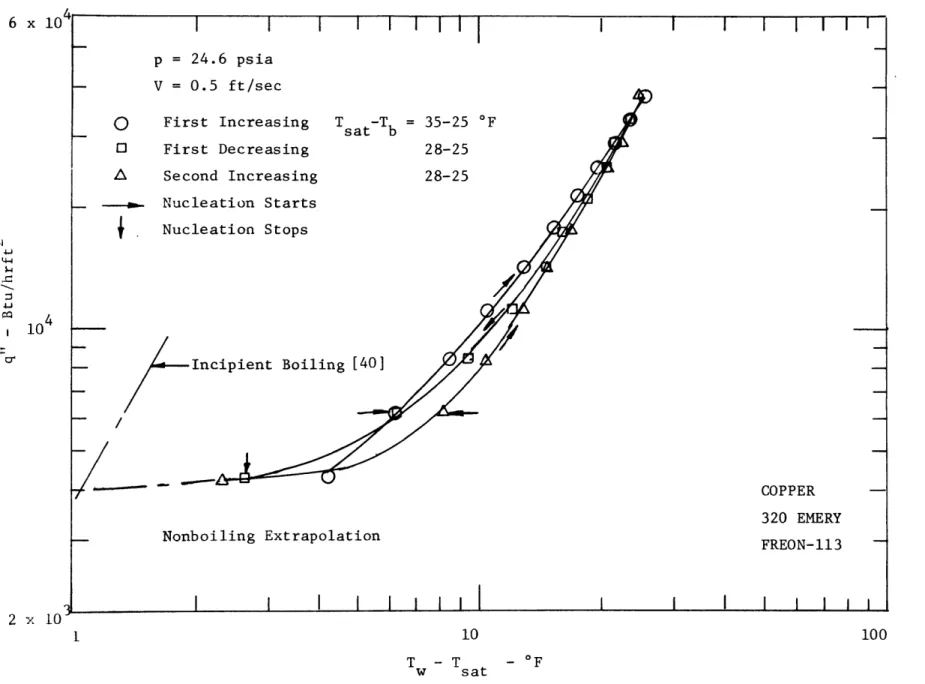
18. Reproducibility and Nucleation Hysteresis in
Flow Boiling - Freon-113
19. Reproducibility and Nucleation Hysteresis in
Flow Boiling - FC-78
20. Expected Influence of Surface Finish -Pool Versus Flow Boiling
21. Effect of Surface Roughness on Flow Boiling 22. Comparison of Boiling Curves for Copper and
Stainless Steel Surfaces
23. Comparison of Boiling Curves for Freon-113 and FC-78
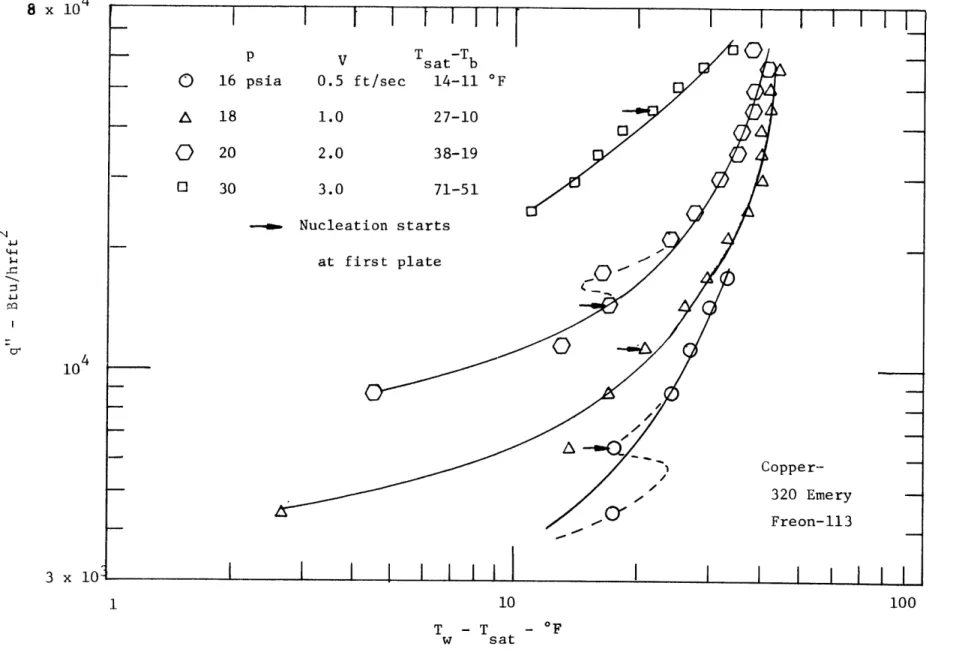
24. Effect of Pressure on Flow Boilingof Freon-113
25. Composite of Flow Boiling Data
26. Influence of Teflon Pits on Flow Boiling of Freon-113 and FC-78 27. Correlation of Non-Boiling Data for Freon-113
28. Flow Boiling of Freon-113 in an Annulus 29. Correlation of Non-Boiling Data for Water
Flowing in an Annulus
30. Flow Boiling of Water in an Annulus
31. Influence of Teflon Pits on Flow Boiling of Water 32. Pool Boiling of Freon-113
33. Pool Boiling of Freon-113
34. Influence of Teflon Pits on Pool Boiling of Freon-113
35. Pool Boiling of Water
36. Influence of Teflon Pits on Pool Boiling of Water
37. Typical Data Reported for Hysteresis in Pool Boiling [38] 38. a The Development of a Metastable State for a Nucleus
b The Metastable State in Terms of Boiling Coordinates 39. Thermocapillarity in Pool Boiling
40. Typical Data Reported for Hysteresis in Flow Boiling of Water [45]
41. Schematic of Bubble Growth From a Teflon Pit (From Motion Picture Observations) [36] 42. General Presentation of Incipient Boiling
Characteristics for Present Water Tests
43. Typical Photographs of Sessile Drops in Equilibrium with Vapor
44. Influence of Tube or Wire Diameter on Pool Boiling CHF 45. Influence of Tube Wall Thickness on Pool Boiling CHF
46. Non-Equilibrium Void Fraction in Subcooled Boiling
47. Subcooled Voidage in Heated Visual Section with Freon-113 48. Oscilloscope Recordings Used to Estimate Bubble
Length and Spacing
49. Illustration of Bubble Collapse with Small Bubbles Initially - Run No. 9
50. Void Fraction as a Function of Distance
Along Unheated Section - Run No. 9
51. Illustration of Bubble Collapse with Large Bubbles
Initially - Run No. 7
52. Void Fraction as a Function of Distance Along
Unheated Section - Run No. 7
53. Augmentation of Bubble Collapse in Freon-113
NOMENCLATURE
A area
A cross-sectional area of tube C
a local acceleration (ft/sec2)
cp specific heat (Btu/lbm *F)
D diameter (ft or in.)
D equivalent diameter (4 x flow area/wetted perimeter, ft or in.)
E voltage (volts)
g local gravitational acceleration (ft/sec2
)
2 g conversion factor (32.174 ibm ft/lbf sec ) h heat-transfer coefficient (Btu/hrft2*F) h latent heat of evaporation (Btu/lbm)I current (amperes)
Ja Jakob number, defined by Eq. (20)
k thermal conductivity (Btu/hrft*F) L heated length (ft or in.)
L unheated length (ft or in.) Nu Nusselt number (h D /k)
N/A number / unit area
p pressure (lbf/ft2 abs or psia) Pr Prandtl number (c y/k)
q rate of heat transfer (Btu/hr)
q"I heat flux (Btu/hrft2)
q" i critical heat flux (Btu/hrft2) cr
R gas constant (ft lbf/lbm*R)
R variable electrical resistor (ohms)
v
Re Renolds number (pVDe/y) r bubble radius (ft)
rc cavity radius (ft or in.) T temperature (*F or *R) t time (hr)
t tube wall thickness (in.)
AT temperature difference (*F)
V average velocity for single-phase liquid at test-section inlet (ft/sec)
VI voltage in electrical probe circuit read by instrument (volts)
v velocity component in x direction (ft/hr) x
w flow rate (lbm/hr)
w mass of air in cavity (lbm)
g
x distance along x-axis or heated length (ft)
y distance along y-axis (ft)
a void fraction
2
Ot thermal diffusivity (k/pc ,ft /hr) p
contact angle (degrees)
b volume coefficient of expansion (*Fl
Y defined by Eq. (20) p density (lbm/ft3
)
Pe electrical resistivity P dynamic viscosity (lbm/hrft) V kinematic viscosity (ft 2/hr) a surface tension (lb f/ft) T defined by Eq. (20) TH defined by Eq. (20) Subscriptsb bulk liquid condition i inside radius
in taken at inlet to heated section
k liquid condition
m average condition o initial condition
o. outside radius or plate boundary out taken at outlet to heated section r rough surface
s smooth surface
sat saturation condition v vapor condition
w heated surface condition ** fully developed condition Superscript
- average value
Liquid properties are evaluated at the bulk condition unless otherwise indicated.
-10-1. INTRODUCTION
In his classical 1942 paper, Mouromtseff [1] noted that "Without exaggeration one may state that in designing electronic tubes there are many more mechanical, metallurgical, and heat engineering problems than those of pure electronic character." This statement is still valid today in that the final reliable design of many electronic devices is limited
by non-electronic considerations, such as the thermal problem.
All electronic devices operate with "losses" which are dissipated
as heat. From the thermodynamic viewpoint, these devices undergo irre-versible processes which result ultimately in the generation of heat wi-th a corresponding increase in temperature of the device over the
ambient temperature. This temperature difference, from device to environ-ment, is the driving potential for the heat-transfer rate required to dissipate the losses to a thermal sink. The designer of electronic com-ponents has always been faced with the problem of designing the internal
and external thermal characteristics of a component so as to permit operation at its electronic rating.
Early electronic technology was such that most devices operated with low rates of volumetric heat generation and large available external surface areas. Thus, cooling could be accomplished simply by the natural
circulation of air. With subsequent miniaturization of components, however, heat-generation rates increased and surface areas decreased, with the
re-sult that forced flow of air and even liquids has been required. High-speed digital computers have undergone this miniaturization to an extreme degree. In the vacuum-tube era, air cooling was adequate for accommodating
2
typical heat fluxes of 0.05 w/in. without overheating the tubes. Current computers utilizing solid-state devices operate with heat fluxes of about 2 w/in. 2, which is still within the capability of forced flow of air. However, it is anticipated that future designs will require heat fluxes
of 200 w/in. 2; thus, liquid cooling will be required.
The projected heat-flux requirements are modest compared with those required in current heat-exchange equipment, such as nuclear reactors utilizing boiling water. However, computers have the additional require-ments that the coolant must be dielectric and inert, and that the tempera-ture of the devices must be uniform. The dielectric property can be
satisfied by many of the heat-transfer media which have been developed Numbers in brackets designate references at end of report.
recently by the major chemical companies. For the most part, these fluids are also compatible with the usual materials of construction. Uniform temperature is harder to achieve since a panel consisting of hundreds of components will be exposed to a single cooling channel along which there is usually a substantial gradient in the coolant temperature, as well as variations in heat flux. Under these conditions, it is possible to have a reasonably uniform heated-surface temperature only by operating under boiling conditions. For practical reasons, the preferred mode is sub-cooled nucleate boiling. At the present time, however, there is little published data available on the boiling characteristics of dielectric fluids, particularly at high heat fluxes.
In September 1966, the IBM Corporation initiated a research program at the M.I.T. Heat Transfer Laboratory, oriented primarily toward obtaining the heat-transfer characteristics of dielectric liquids suitable for
cooling of computer components. This report summarizes the studies carried out during the first two years of the research program.
The liquids that have been considered for computer applications in-clude FC-78 (Minnesota Mining and Manufacturing Co.), C51-12 (E.l. Du Pont de Nemours & Co.),anda number of the Freons (Du Pont). A number of tests were made with FC-78; however, the major portion of the experimental
pro-gram was carried out with Freon-113, since it was more readily available and was but one-tenth the cost of the FC-78 or C51-12. While the chemical structure of FC-78 and C51-12 is more favorable than that of Freon-113, that ismore stable and inert, the thermophysical properties are similar. Thus, use of the less expensive fluid was felt to be justified.
The test program has involved a wide range of pool and forced con-vection conditions. Both single-phase and nucleate boiling (including critical heat flux) heat-transfer characteristics have been obtained. The possibility of augmenting boiling heat transfer by means of specially prepared surfaces with nonwetting nucleation sites was also considered.
A preliminary investigation of the collapse of vapor bubbles generated
during subcooled flow boiling has been carried out.
The test configurations and test parameters have to some extent been oriented toward computer applications; however, much of the information is of general interest. For example, the generalizations and correlations for boiling heat transfer have primarily been developed from data for water. It has been shown in the past that these generalizations may not
-12-be valid for other fluids, such as liquid metals or cryogens. The Fteon-type liquids constitute another test of the general correlations.
There is currently great interest in the development of scaling laws for boiling heat transfer. Several investigations are aimed at establishing the scaling parameters to the point where complex reactor cores may be
"non-destructively" tested to critical heat flux in a low pressure, low power Freon rig to estimate performance under high pressure boiling water conditions. This approach clearly requires an assessment of the boiling behavior of the Freons.
2. EXPERIMENTAL FACILITIES
In order to accommodate the diverse objectives of the test program, it was necessary to use several test stands. The High Power Freon Loop was designed and constructed under this program, and used to obtain forced
convection heat-transfer data. Comparative data for water were obtained with the existing High Power Water Loop. Pool boiling measurements with either Freon or water were obtained with a pool set-up which utilized the central direct-current power supply. Qualitative and quantitative ob-servations of subcooled voids were made with the existing low Power Freon Visual Loop. Brief descriptions of the test stands and the various test sections are given in this chapter. The operating procedure is outlined in subsequent descriptions of each test program.
2.1 Test Stands
2.1.1 High Power Freon Loop
This test facility was constructed in the M.I.T. Heat Transfer
Laboratory. The hydraulic system provides for circulation of relatively 2V large flow rates of faeon-type liquids, and permits a range of pressures
at the test section. The total contained volume is, however, small to minimize the cost of the test fluids. Control of the gas content for
the test fluid is provided for. A variety of test sections can be accom-modated, and they can be installed in any orientation. Either a-c or d-c
power can be applied to the test section depending on the type and amount of power required. Generalized instrumentation for the loop and a variety of test sections is provided. The facility is shown in Figs. 1 and 2.
The pump chosen was an Ingersol-Rand centrifugal pump, Model 1-1/2 RVH - 7-1/2, which is rated for 40 gpm of FC-78 (sp. gr. 1.7) at 90 psi
head. The pump speed is 3450 rpm and a mechanical seal is utilized. A bronze casing and impeller were chosen to eliminate possible corrosion problems. The drip-proof motor operates on 220V, 3 phase, 60 cycle power. Teflon gaskets 1/8 in. thick were used for specially fabricated flange connections. A 3-1/2 in. Helicoid compound gage, 30 in. vacuum, 0-15 psig, was installed on the suction side of the pump to aid in maintaining positive suction pressure.
-14-has a nominal rating of 30 gpm of water on either side with a heat load of 100,000 Btu/hr. It was put in the loop with the shell side connected to the loop and tube side to the city water supply.
A stainless steel tank 10 in. dia. and 10 in. length was fabricated.
The tank holds about 3 gallons of liquid, which is sufficient to provide make-up liquid for any leakage during long periods of operation. Two
de-rated 2000-w Chromalox immersion heaters were installed near the bottom of the tank. The power to these heating elements is regulated by a variac mounted on the control panel bench. This arrangement makes it possible
to degas (FC-78, for example, contains 5 gm of air/1000 gm of liquid at
77 *F, 1 atm) and preheat the liquid. In order to prevent excessive loss
of liquid during degassing, a condenser was mounted on the top of the tank. The condensing surface consists of coiled Tygon tubing carrying cold water.
A valve was introduced between the condenser and the tank to prevent
evapor-ation when not in operevapor-ation. The tank was fitted with a gauge glass to indicate the liquid level. The tank was kept at a conveniently high posi-tion to keep the whole system above atmospheric pressure.
A stainless steel FulFlo filter with a rated capacity of 10 gpm was
installed in the tank line. This was provided with a cartridge of viscose filter media having a nominal rating of 20 microns. The filter was pro-vided with shell gasket 31300 which is suitable for Freons.
The support framework for the test stand was constructed of Dexion slotted angles. The main piping is 1 in. nominal copper tubing, and high strength 95-5 solder was used for sweated joints. Jamesbury ball valves with double Teflon seals were used as On-Off valves, whereas Henry dia-phragm valves were used as throttle valves. Two such diadia-phragm valves were provided just before and after the test section to control the flow and pressure level for the test section. Green Rubber Supreme hose was used for flexible connections such as pump inlet and outlet. All unions were provided with Teflon or neoprene gaskets to insure tight joints with a minimum of galling.
The loop was arranged to permit the flexibility of putting the heat exchanger before or after the test section. In the former location, the test-section pressure level can be maintained near 1 atm. The alternate
location is more desirable in general, however, since vapor should be condensed before entering the pump. A by-pass line with a diaphragm globe valve was provided to allow most of the flow to by-pass while
using small test sections. The lines to the degassing tank are relatively small since only a bleed flow is required.
Two flowrators by Fisher & Porter Co., 4.25 and 37 gpm water maximum with percentage scales, were installed in parallel with appropriate shut-off valves. These flowrators covered the desired range of flows through test sections of rectangular or small tubular form. Flowrator readings were corrected for use with Freon-113 or FC-78 according to the manu-facturer's recommendations.
Two Helecoid 8-1/2 in. pressure gauges, with an accuracy of ± 1/4 of 1%, were mounted on the main panel, and connected to a pressure manifold having a bleeder valve on the top to bleed the pressure gauge connector. Two points on the test section were connected to this mani-fold by Swagelock fittings. The gauges were provided with snubbers to isolate the gauges from any pressure oscillations inside the test section.
2.1.2 High Power Water Loop
The experimental facility used was the low-pressure test loop located in the M.I.T. Heat Transfer Laboratory. The basic apparatus was designed and constructed in 1961 [2].
A schematic of the loop is presented in Fig. 3. The piping and
fittings are made of brass and stainless steel for corrosion resistance. Rayon-reinforced rubber hose is used where flexible connections are re-quired. Distilled water is circulated by a Westco bronze, two-stage, regenerative pump providing a discharge pressure of 260 psig at 3.6 gpm. The pump is driven through a flexible coupling by a 3-hp Allis-Chalmers induction motor. A Fulflo filter is installed at the pump inlet. Pressure fluctuations at the outlet of the pump are damped out by means of a
2.6-gal Greer accumulator charged with nitrogen to an initial pressure of 40 psig. This accumulator contains a flexible bladder-type separator which prevents the nitrogen from being absorbed by the system water.
After the accumulator, the flow splits into the by-pass line and the test-section line.
In the test-section line, fluid flows through a Fischer-Porter flow-rator followed by a preheater, thence through a Hoke metering valve and the test section, after which it merges wit-h fluid from the by-pass line. The flow then goes through the heat exchanger and returns to the pump. The preheater consists of four Chromalox heaters with an output of 24 kw,
controlled by switches and a variac. Quick-action Jamesbury ball valves are installed before the inlet to the flowrator and after the exit from the test section. The exit valve is also used to adjust the test-section pressure.
Flow through the by-pass line is controlled by a ball valve, on each side of which there is a 300-psig pressure gauge. Pump operating pressures, and hence the pressure upstream of the test section, is con-trolled by this valve.
The heat exchanger is a counterflow type with system water flowing in the inner tube and city water in the outer annulus. A Fulflo filter is installed on the city water line to reduce scale formation in the exchanger.
The distilled water was deionized continuously by passing a portion of the flow through four mixed-bed resin demineralizer units. A 4.7-gal degassing tank is provided with five electrical heaters (3-200 vac and 2-100 vac). This tank also serves as a surge tank. A 15-gal stainless-steel storage tank for filling the system is mounted directly above the degassing tank, and can be filled with distilled water from standard 5-gal bottles with a small Hypro pump.
Test-section electrical power is provided by two 36-kw dc generators connected in series. Each generator is rated at 12 volts and 3000 amperes. The power control console permits coarse or fine control from 0 to 24 volts. Power is transmitted from the main bus to the test section by water-cooled power leads. Rubber hose connected both inlet and exit
chamber plenums to the main loop in order to electrically isolate the test section. The same power supply was connected to the Freon loop when running experiments with tubular heaters.
A variety of metering tubes and floats, which could be installed
interchangeably in the basic Fischer-Porter flowmeter housing, provided measurement of the test-section flow from 1.5 to 4000 lbm/hr.
All pressures were read on Bourdon-type gages located as shown in
Fig. 3. The test-section inlet and exit pressures were measured with Helicoid 8-1/2 in. gages of 200 psig and 100 psig, respectively. Both
are specified to an accuracy of ± 0.25% of full scale.
2.1.3 Pool Boiling Apparatus
stainless steel test section located horizontally in a beaker of saturated water or Freon-113. The stainless steel tube was held between two copper bars, which in turn were connected to the water cooled bus cables from the d-c power supply. The tank was insulated on the outside by glass fiber sheets, and covered on the top by a Pyrex sheet. Four auxiliary heaters, each of 450 w, were suspended inside the beaker to bring the
liquid to saturation temperature. A sketch of the system is shown in Fig. 4. 2.1.4 Freon Visual Loop
The basic test apparatus is located in the Engineering Projects Laboratory at M.I.T. A schematic diagram of the complete loop is shown
in Fig. 5. Many of the components used by Coumou [3] and Dickson [4] are employed in this apparatus.
The fluid medium passes through a flow meter after leaving the pump. From the flow meter the fluid is passed through a preheater and a 1-in. throttling valve before entering the test section. On leaving the test section the flow passes through a heat exchanger where it is highly sub-cooled to ensure that there is no cavitation in the pump. The reservoir serves as a make-up, expansion, and degassing tank. A by-pass loop from the pump outlet enables a portion of fluid to be sprayed into the reservoir for degassing.
Copper tubing is used throughout the system. Sweated joints were either soft or silver soldered, and all threaded joints were sealed with Teflon tape. Aluminum-backed glass fiber insulation was used to thermally insulate the heat exchangers and copper tubing. All valves, except for the globe valve used for throttling, were ball valves with Teflon seats.
The pump is a centrifugal canned rotor type Dynapump #810 E. The speed of the pump is controlled by varying the voltage supply by means of a variac. It was found that the flow rate would remain more stable if also controlled by the throttle valve at the entrance of the test section.
The subcooler is a Ross BCF 603 single-pass tube and shell heat exchanger, with the Freon flowing through the tubes. Cooling was ac-complished by using city water. The minimum temperature which could be obtained at the inlet to the test section was 80 *F; however, this was adequate since it allowed a reasonable range of subcooling at the exit of the heated section.
-18-The temperature of the fluid approaching the test section could be adjusted to within 1 *F by means of the preheater. The preheater is a Ross BCF shell and tube heat exchanger. Cold and hot water from the supply lines are mixed to obtain the desired preheat temperature. The hot water was less stable than steam would have been; however, it proved
quite adequate for degassing before any tests.
A Corning model 2560 Graham type glass condenser was mounted
ver-tically on the reservoir to reduce the loss of fluid during degassing. The Freon vapor and non-condensable gas passed through the spiraled glass
tube. City water was used for cooling.
A Brooks Rotameter, model #1110, with a range of 0-800 lbm/hr of
Freon-113, is located upstream of the preheater to measure the test fluid liquid flow rate. The density and viscosity of the two Freon fluids used in this loop were not appreciably different; therefore, the flow meter
was used for both fluids without recalibration. The flow meter is specified to an accuracy of ± 2 percent of the maximum scale length, and the float type RV was used to give maximum immunity to viscosity variations.
2.2 Test Sections
2.2.1 Rectangular Channel
A rectangular test section with one of the wide sides heated was
chosen to approximate one of the possible cooling arrangements for the electronic components. The general configuration of this test section is indicated in Fig. 1; this test section was used only with the new Freon loop. Three heater plates form a nearly continuous heated surface. The plates can be easily removed to modify the surface finish.
The test-section frame is made of brass, 24 in. long x 5 in. wide x 1/2 in. thick with a central cut-out of 17 in. x 3 in. x 1/4 in. Around this cut-out is an 0-ring groove 0.21 in. wide and 0.16 in. deep. At the two ends are two 1.31 in. dia holes for inflow and outflow of liquid. Soldered unions provide the connections to the system piping. The channel has a window opening of 3 in. x 3 in. for a Plexiglas plate secured by machine screws and sealed with an 0-ring (0-ring seals were generally of buna rubber). Twelve tapped holes of 1/8 in. NPT were provided on the brass frame for carrying thermocouples and pressure taps. The test-section
accommodates three copper heater plates which are 3 in. x 3 in. A 1/4 in. thick G-5 sheet, which supports the copper plates, is bolted to the brass channel and sealed with an 0-ring. The plate assemblies are in turn se-cured to the G-5 sheet with an 0-ring seal.
On each copper plate, six holes of 0.020 in. diameter were drilled to within 0.050 in. of the boiling surface. Corresponding grooves were cut to bring the thermocouples out. The thermocouples are of 36 gage iron and constantan, Teflon insulated wire (0.007 in. 0.D.). A
calibra-tion indicated very insignificant deviacalibra-tions from NBS values. The assemolc couples were inserted in the plate and sealed with Eccobond
276, a high temperature epoxide adhesive and sealant capable of 500 *F.
The copper plates and strip heaters were then tinned on the top surface in an oven at 450 *F using eutectic weld solder paste. The Hotwatt strip heaters were custom made to 3 in. x 3 in. with stainless steel casing and had a rating of 1600 w, 220 v (cooled from one side only). Using liquid
flux, the heaters and plates were bonded together in the oven at 450 *F.
The heaters were connected to the 220 v supply through individual variacs. The power is monitored through individual, calibrated voltmeters and
ammeters. The heating elements were sized to give a maximum heat flux 2
of approximately 180 w/in. .
Thermocouples for measuring the temperature of the liquid were made from iron-constantan 30 gage duplex wire. The wires were sealed inside stainless-steel tubes of 0.072 in. O.D. with Eccobond 276. The thermo-couple beads were left exposed about 1/16 in. These tubes were then in-serted inside Conax adapters with neoprene sealants so that the tip was at the channel centerline. Two or three thermocouples were provided be-fore and after each heater section to insure that a representative average temperature is measured.
2.2.2 Annulus
The annular test sectionas shown in Fig. 6, was used with both the Freon loop and the water loop. The test section was constructed from a 304 stainless tube, 0.5 in. O. D., 0.020 in. wall and 18 in. long. Stain-less steel was chosen for the heater since its properties, e.g. specific resistance and thermal conductivity, are known to good accuracy and it matches the motor-generator power supply. Two copper shorting rods were
soldered inside the test section at either end leaving a heated length of 10.4 in. This shorting bar arrangement minimizes the flow distur-bances at the inlet to the heated portion. In addition, the heating starts in the visual portion of the test section, thus insuring an ob-servation of the beginning of nucleation. Before soldering the upper rod,
the thermocouple assembly was placed through a central hole in the rod. The test-section surface was rubbed with 320 emery and cleaned with
ace-tone before assembly.
The heated section and precision bore Pyrex tubing, 1.00 in. O.D.,
0.812 in. I.D., and 12 in. long, were fitted to brass end pieces with
Veeco couplings. Neoprene and Teflon 0-rings were used to seal the joints. Both the inlet and outlet blocks have two tapped holes for Conax fittings, one for a liquid thermocouple and another for a pressure tap. The as-sembly was clamped in between bus bars which were connected to the d-c power supply.
For the initial tests, a traversing thermocouple was used to measure the axial temperature inside the tube. The 36 gauge Fe-Cn thermocouple was put in a small stainless tube with the bead exposed between two Teflon
discs. The space between the discs was filled with insulating powder. An axial temperature traverse could readily be made with this arrangement.
For the later runs, four 30 gage Cu-Cn thermocouples were taped in a groove in a micarta rod. The thermocouples were placed such that when the micarta rod is placed inside the tube, the thermocouples were 4, 6, 8
and 10 in. from the beginning of the heated length.
The inlet and outlet temperatures of the liquid were measured by two thermocouples placed in the inlet and outlet blocks. These thermocouples were placed through two Conax fittings and arranged to be well inside
the liquid. Inlet and outlet pressures were measured by the two Helecoid pressure gauges which were connected to two pressure taps placed in the inlet and outlet blocks.
Two Leeds and Northrup rotary switches, each with 12 positions, were made to which all the thermocouples were connected. The switch in turn is connected to an icebath, then to a recorder or potentiometer for measuring the signals. The recorder used is a Leeds and Northrup Speedo-max Multipoint Recorder with Cleertrend printing.
current and voltage drop across the test section. Current is read by the recorder in millivolts as voltage developed across a standard shunt
(1 my = 60.17 amps). The voltage across the test section was measured
by a Digitec voltmeter.
2.2.3 Pool Boiling Test Sections
The test section employed for detailed heat-transfer measurements was a 304 stainless steel tube, 0.25 in. O.D. and .01 in. wall with heated length of 6 in. The arrangement of the instrumentation for this test section is shown in Fig. 7. Three 30 gauge Cu-Cn thermocouples were led inside a groove on a Teflon rod, at equal spaces, by Hysol epoxy and the rod inserted inside the test section. Teflon sleeving was placed on thermocouple beads to
insulate them electrically from the tube. These thermocouples recorded the inside wall temperature. Another stainless steel arm was placed on the extension of the Teflon rod, and both the rods were joined together by Hysol epoxy. The arm was then filled with insulating powder. The heated surface was then prepared with emery 320 and acetone.
The test arrangement was considerably simpler for the critical heat flux measurements since no wall temperature instrumentation was necessary. Stainless steel tubes (with ends blanked off) or wires were secured to the bus rods with appropriate adapter fittings.
The power supplied to the test section was measured as before by noting the current and voltage drop across the test section. Current is read by the recorder in millivolts as voltage developed across the standard shunt. The voltage across the test section was measured by the Digitec voltmeter. The fluid bulk temperature is measured by two thermometers and one thermocouple suspended inside the fluid.
2.2.4 Visual Test Section
The test section (Fig. 8) consisted of 16 Pyrex 7740 glass tubes, 15 inches long, coated on the outside, over a length of 13 inches, with an elec-trically conducting film. These tubes are approximately 70 percent optically transparent so that visual observation can be carried on while electric
power is applied to the tubes. The manufacturer, Corning Glass Works, gives the nominal thickness of the film as 16 microinches. The tubes are precision ground to an I.D. of 0.433 in. and an 0.D. of 0.510 in. There were 15 Plexiglas couplings, each of thickness 0.5 in., giving a total
length of 247.5 in. for the entire test section.
Although Dickson [4] found that some non-uniformity of film thick-ness exists in both the axial and circumferential directions, the heat
flux was assumed to be uniform throughout the coated sections. Eight variable transformers delivered a-c power to the tubes, with each trans-former supplying two sections. Variable trimming resistors were connected in series with the tube with the lower overall resistance to compensate for the resistance difference between pair members. An electrically con-ducting silver-based paint was applied at each end of the tubes to ac-commodate the electrical connections from the transformers. Thermocouples were placed on the tubes to permit an estimate of the heat loss from
those segments that were heated.
The Plexiglas couplings were drilled to the I.D. of the tubes. Holes were drilled and tapped in the couplings at right angles to
ac-commodate thermocouple connections and pressure taps. Since the pressure remained approximately constant for all test conditions studied, most of the pressure connections were plugged to avoid possible sources of leaks. For rigidity, all the couplings were fastened to the frame by three
1/2-in. drill rods running the full length of the test section. The couplings were sandwiched by end plates fitting over the tubes, and holding 0-ring
seals in position. Three 1/4-in. bolts held the end plates tightly in place. The distance between couplings was approximately 15 in., which allowed for thermal expansion of the test section when heated.
Two Westinghouse portable single-phase wattmeters, type PY-5, were used to measure the power input to the heated tubes. Gauge #14 wires were used for the power leads, the electrical resistance of which was considered negligible compared to the instrument error. To avoid thermal stresses in the glass, the maximum power input did not exceed 9,000
2
Btu/hr-ft2. The heat loss from outside of the uninsulated tubes to the ambient was determined from McAdams [5] correlation of natural convection from horizontal cylinders. No correction was made for the heat loss in the unheated tubes.
A Conax thermocouple gland, with three thermocouples, was used to
measure the temperature of the fluid entering the test section. The
bulk temperature of the fluid in the test section was measured by 1/16-in. diameter stainless steel sheathed copper-constantan thermocouples. These thermocouples were inserted midway into the test section through the
couplings, and held in place by 1/16-in. Conax fittings. Although these thermocouples could be withdrawn, it was reported by Hwang [6] that the presence of these thermocouples did not appear to affect the flow.
All temperatures were read on a Leeds and Northrup model 8690
milli-volt potentiometer. A system of rotary switches was used to allow a
selection of thermocouples.
2.2.5 Specialized Instrumentation for Visual Test Section
Photographic Equipment
The vapor bubbles in the test section were photographed with a Polaroid model 110B camera, using the auxiliary closeup lens set. A General Radio type 1531-A Strobotac was used to back-light the test
section. Several sheets of tracing paper were used to diffuse the light. The strobotac was coupled to the shutter release on the camera through a triggering circuit.
To avoid any possible distortion due to the curvature of the test section, a trough-like Plexiglas jacket was installed around the tube and was filled with Nujol, a heavy mineral oil with an index of refraction very close to that of Pyrex.
A C-12 Tektronix oscilloscope camera was used to photograph the
os-cilloscope recordings produced by the electric probe. Electric Probe (Fig. 9)
An electric resistance probe was installed in the test section to determine the size and distance between the bubbles flowing along the top of the tube. Although the electric probe has been used, for the most part, to determine the flow regime in two-phase flow [7,8], it has been used successfully in special cases [9] to determine information on void fraction. In this study, a stratified bubbly or slug flow was
found to exist in all of the test runs; thus the probe could be used to detect the void fraction.
The probe consisted of a 0.014-in. diameter tempered stainless steel spring wire, covered by Teflon sleeving. The tip of the probe was left bare to obtain better contact wtih the fluid. The Teflon sleeving was
fabricated by stretching two pieces of Teflon tubing until they fit
tightly around the wire. The double thickness was necessary to facilitate sealing against leakage. The final diameter of the probe was 0.027 in.
The probe was installed through a 1/16-in. Conax fitting which was drilled for clearance. A small 0-ring placed in the Conax fitting
pro-vided adequate sealing for the pressures encountered in this study. To allow the probe to traverse the test section, a micrometer spindle was mounted on a spring loaded bracket and bolted to the stationary frame. From the Conax fitting, the probe was aligned by a brass sleeve and clamped between two Plexiglas plates. The probe assembly was installed vertically upwards in the Plexiglas coupling connecting the last two test sections.
The Plexiglas coupling was drilled to accommodate a 1/2-in. O.D. copper bushing, which was installed to complete the circuit to ground. Another 1/16-in. Conax fitting held a brass rod snugly against the copper bushing to allow electrical connections to be made more easily.
A diagram of the probe circuit is shown in Fig. 9. When the test
section is entirely filled with liquid, there is a closed circuit between the probe and ground. This gives the maximum voltage across the variable resistor, Rv , which is recorded by the oscilloscope. When the vapor bubble passes through the tip of the probe and ground, this essentially
creates an open circuit, giving a voltage reading across R of practically zero. The length or diameter of a bubble can be determined from the time during the bubble-probe contact if the velocity of the bubble is known.
3. RECTANGULAR CHANNEL STUDIES
3.1 Experimental Procedure and Data Reduction
For each run, the copper test-section surface was prepared with the
required finish (emery 320 unless otherwise specified) and then secured to the rectangular channel and insulated. The wall temperature thermo-couples were then hooked to the rotary switches. City water was allowed
to flow through the heat exchanger and tank condenser, and tank immersion heaters switched on to degas the liquid circulating through the tank. About 30 to 40 minutes were allowed for degassing. The pump was started, and flowrate set at the required level with the valve. Power was supplied to the test-section heaters through variacs, and readings of the ammeters and voltmeters were noted. Enough time was allowed to assure equilibrium conditions before taking data, and then surface, inlet, and outlet temper-atures were recorded by means of a potentiometer or continuous recorder.
During the first several months of loop operation with Freon-113, a brownish paste-like substance was observed leaking through most of the threaded joints. The fluid also assumed a reddish-brown color. This deposit was apparently due to the soldering flux (Nokorode) which entered the system during fabrication. Before testing, the loop was flushed thoroughly with hot Freon; however, the flux was apparently not removed. Eventually the leaking stopped and the discoloration was less. Some yellowish discoloration of the Freon still persisted which has been
at-tributed by IBM chemists to the formation of phosgene gas. The FC-78 was added later in the test program when the loop was clean, and no discolora-tion of any sort was noted.
For each run under nonboiling conditions, the power input to the heaters,
q = 3.413 EI, (1)
was compared with the rate of heat input to the liquid,
q = w c (Tb - Tb ). (2) out in
The agreement was generally within 10 percent, with the power input usually exceeding the heat input to the liquid. This trend is to be
expected since the heater assemblies could not be thoroughly insulated against heat loss to the test frame and the environment. There was, however, some difficulty in obtaining a reliable indication of the fluid bulk temperatures. The exit thermocouples, in particular, tended to
in-dicate that the liquid was not thoroughly mixed at the measuring point.
A mixing chamber further downstream would only invite more uncertainty
due to heat loss to the massive piping. In view of the apparent tempera-ture stratification and the fact that the liquid temperatempera-ture rise was small anyway, it was felt that the power input to the heaters would pro-vide a more reliable indication of the actual power. Equation (1) was therefore used throughout, although it is recognized that the heat fluxes are slightly high and the heat-transfer coefficients slightly low as a consequence of this assumption.
The inside wall temperature was calculated by applying a correction to the wall temperature measured by the wall thermocouple embedded in the test section. The thermocouple was 0.05 in. from the boiling surface, hence the correction is
AT = 25) . (3)
This correction was below 1 *F for the largest heat fluxes encountered in this study. Further correction for the thermocouple lead conduction was not considered to be necessary.
As will be discussed later, the heater surface temperatures were essentially uniform. The heat-transfer coefficients were therefore com-puted on an average basis for each plate using the power input and test-section inlet temperature to calculate the average liquid bulk temperature.
The greatest uncertainty in the data reduction lies with the physical properties of the test fluids, which are necessary to form the usual
dimensionless groups. This is demonstrated by an examination of available data for the thermal conductivity of Freon-113. As shown in Appendix 1, the published data for the conductivity at room temperature range from
0.0382 to 0.054 Btu/hr ft *F, and it appears that the probable value is
different from that currently suggested by the manufacturer. There is similar confusion regarding the properties of 3M FC-78. Due to lack of information, however, it was necessary to rely almost entirely on manu-facturers' data; the sources used are indicated in Appendix 1. As further
revisions in the property values become available, it may become necessary to alter the correlations given in this report.
3.2 Nonboiling Results
The nonboiling data are of particular interest since it is probable that the initial application of forced flow liquid cooling for computers will be restricted to nonboiling conditions.
Typical wall temperature profiles presented in Fig.11 indicate that there was little variation in wall temperature within each plate. Nor-mally a significant axial increase in temperature would be expected on each plate due to boundary layer development. In the present case, however, the plate had such a high conductivity and was so massive that temperature gradients were virtually eliminated. The boundary condition actually ap-proximates a uniform wall temperature rather than the intended uniform heat flux. Under these conditions, it is possible only to obtain an
average heat-transfer coefficient for the plate.
An attempt was made to reduce the conduction within the plate by fabricating it from stainless steel. As shown in Fig.11 the wall tempera-tures are also quite uniform which indicates that there was still consider-able axial conduction.
Fig.12 presents the data for Freon-113 taken with all three plates at various velocities and heat fluxes. The conventional dimensionless parameters for fully developed turbulent flow in tubes are utilized. The viscosity correction, (pi/pb
014
, was included since it reduced thespreading of the data with heat flux. It is seen that the Nusselt numbers for the first plate are generally above those for the other plates; however, there is no consistant trend since the third plate has higher Nusselt
numbers than the second plate. An indefinite length effect is entirely reasonable due to the geometry of the leading edge of the plate. It was not possible to precisely control the gap between the G-5 and the plate. A wider gap, possibly together with some plate protuberence,
could cause additional turbulence and an increase in the heat-transfer coefficient. Furthermore, it can be seen from Fig. 11 that the plates were far enough apart to act almost independently. In other words, the
thermal and hydraulic boundary layers develop at each plate in a manner strongly dependent on the leading edge geometry. Subsequent data were
thus taken with a single plate located at the upstream end of the channel. All of the data for this plate are shown in Fig. 13 ,together with values predicted by various correlations.
For fully developed turbulent tube flow, the expected correlation would be
Nu0.14
Nu__ pw -- = 0.023 (Re 0.8
) , (4)
Pr0.4
b-if the constant and Pr exponent are according to the McAdams formulation [22]. If the Sieder-Tate expression is used, the Pr exponent is 0.333 and the constant 0.027. The difference between the modified McAdams and
Sieder-Tate expressions is less than 5 percent for the present conditions due to the compensating effects of the Pr function and the constant. It is clear that present data lie well above the expected correlation.
It is felt that the experimental technique is quite precise and the physical properties utilized are reasonably accurate. If these possibil-ities are excluded, the high heat-transfer coefficients might be explained
by the following factors: the rectangular geometry, entrance effects,
free convection, and heating on one side only. It is desirable to examine these factors in some detail in order to explain the data and establish guidelines for application of the data to other situations.
There is considerable disagreement regarding the appropriate correla-tion for uniformly heated rectangular channels for fully developed turbu-lent flow. Levy et al. [23] reported heat-transfer coefficients generally
50 percent below those predicted by Eq. (4), while Gambill and Bundy [24]
found that the coefficients were 50 percent higher than predicted. The
present aspect ratio (12:1) was more comparable to that of Gambill (9:1) than Levy (25:1); however, it still appears that the published data are of little help in determining the reference correlation line for this study.
The present channel has a heated length to hydraulic diameter ratio of only 6.58; thus, entrance effects should dominate. The following en-trance correction [5] was applied to Eq. (4) and plotted on Fig. 13 for various L/D:
Nu
Nu= 1 + 7.0 (5)
There is no generally accepted entrance region correlation; however,
Eq. (5) should be reasonable for the present geometry where the flow
enters at a right angle upstream of the first plate. For Reynolds num-bers of about 104, this entrance correlation is in good agreement with
the data. For lower Re the agreement is poor; however, this is to be expected since these Re are in the transition region between laminar and turbulent flow. The laminar entrance region data for tubes as predicted
by Kays [25] are also indicated on Fig. 13. Now, it would be expected that the data would follow the laminar prediction until Re ~2000, and then swing upward to join the turbulent prediction. It is evident, however, that this is not occuring.
The data are generally higher than expected in the transition region, and furthermore indicate a strong spread with heat flux. It appears that this is due to natural-convection effects. Since the heated plates were facing up in the horizontal channel, a significant secondary flow could be developed by the buoyant forces. The free convection increases as
the heat flux, or temperature difference, increases. The free convective effect could increase the heat-transfer coefficient by several hundred percent [26]. In addition, the secondary flow can produce a premature transition to full turbulent flow. Thus, the observed behavior of the data at low Re is consistent with current understanding of the effects of free convection on duct flow. As Re increases, the superimposed free convection is overshadowed by the normal turbulence, and the data merge with the turbulent prediction.
The predicted heat-transfer coefficients in Fig.13 were based on correlations developed primarily for round tubes. In order to confirm that these predictions are reasonable for the present geometry,
pre-dictions for flow between parallel plates were examined. These analytical predictions for laminar and turbulent flow are summarized in Appendix B. Fully developed laminar flow with one plate heated is solved here and the results are in excellent agreement with an asymptotic solution [27]. The solution for fully developed turbulent flow was taken from Kays [25]. Since entrance region solutions for laminar flow with one plate heated are not available, these predictions were taken for uniform heating from
[25]. No solution for the turbulent entrance region is available; however, Eq. (5) can be applied. These predictions are compared with the data in
Fig.14 . It is seen that the relation of the data to the predictions is essentially the same as given in Fig. 12. Thus, the nonuniform heating cannot be considered of particular significance in interpreting the present results.
A number of tests with FC-78 were also run under nonboiling con-ditions. As shown in Fig.15 , the data are in very close agreement with those obtained for Freon-113 for a similar range of Reynolds numbers and heat fluxes. This suggests that the property values used, in particular the thermal conductivity, are at least in the correct ratio for the two fluids.
It is evident from the foregoing that the test configuration selected for the present tests is quite different from the usual simple geometrics employed in heat-transfer studies. There is therefore some question as
to whether thesedata can be accurately correlated over a side range of flow conditions. However, a correlation can be recommended for this type of cooling channel for the restricted range of conditions anticipated in the computer application: Freon-113 or FC-78, D ei.' 0.5 in., L % 3 in.,
V % 1-5 ft/sec, Tb 1 100 *F, and q" < that required for incipient boiling at p < 30 psia. The correlation of data for all three plates as shown on
Fig. 12 would represent a conservative design equation:
Nu pw -,.40.64
Pr o.4 L 1 0.172 Re
- (6)
3.3 Subcooled Boiling Results 3.3.1 Boiling Curve Trends
Typical boiling curves for copper - Freon-113 are presented in Fig. 16 for the three plate assembly, and in Fig. 17 for a single plate. The boiling curves exhibit the usual trends. As shown on Fig. 17 for V = 2
ft/sec, the low heat flux data follow the forced-convection extrapolation, q" = h [(Tw Tsat) + (TsatTb)] (7)
where h was obtained from the data given in Fig.13 . At higher heat fluxes the data depart from the forced-convection prediction and tend to merge with the data for other velocities. This is in accordance with
the usual observation that subcooling and velocity do not influence the fully developed boiling curve. The maximum heat flux was kept below
70,000 Btu/hr ft2 so as to avoid heater burnouts.
As each boiling curve was generated, the surface of the first heater (only one with visual port) was carefully observed for the onset of ebul-lition. Occasionallythe visible bubble activity occurred at a relatively high heat flux, well above that corresponding to the departure from single-phase forced convection. Since the bubble size is relatively large for Freon-113 at low pressures, there was little reason to doubt that the
visual observation represents the actual onset of boiling. This phenomenon will be considered further in Section 6 after corroborating data for other
test geometries have been presented.
Figure 18 illustrates boiling data obtained when the system was just filled with Freon-113. Entrained air was removed by circulation, but the preparatory degassing operation was not performed (degassing was carried out during the test sequence, however). The boiling curves for increasing
*
and decreasing traverses are not significantly different ; however, a definite "nucleation hysteresis" was observed. The nucleation disappeared at much lower values of heat flux and wall superheat than when it started. Essentially the same results were obtained for FC-78 (Fig.19 ). During all of these tests at least 10 minutes was allowed before taking data after the power was reset; thus, the nucleation hysteresis is not due to the rather long time constant of the plate.
For certain runs, the usual boiling curve hysteresis could be noted. That is, the wall temperature would increase as the heat flux was increased, but at some point a pronounced decrease in wall temperature would be
noted (Figs. 16 and 19). The point at which this occurred corresponded approximately with the observed onset of nucleation. When the heat flux was decreased, the wall temperature decreased monatonically.
Further investigation of these hysteresis effects could not be carried out with the rectangular channel geometry since the massive heater blocks tended to average out local temperature variations caused
by local variations in nucleate boiling. The test geometries considered
*
The insensitivity of data to degassing suggests that dissolved air is not a problem with Freon-113.
in Sections 4 and 5 are more suitable for examination of these effects; thus, further discussion will be deferred to Section 6. Subsequent tests with the rectangular channel geometry involved determination of gross boiling characteristics which could be accurately obtained with this test section.
3.3.2 Effect of Surface Finish on Flow Boiling
It is well known that surface finish has a strong influence on pool boiling. An extensive series of tests with polished and chemically etched surfaces was recently reported by Vachon et al. [28]. In this study it was demonstrated that the roughest surface does not necessarily give the most favorable boiling curve. Brown [29] appears to be the only one to
report a systematic study of the influence of surface finish on subcooled flow boiling. He found that there was a decrease of about 15 *F in the boiling curve for pool boiling of water when the surface was moderately roughened. However, when the same surfaces were used in flow boiling, the difference was only about 2 *f at V = 0.5 ft/sec.
Brown appears to have a satisfactory explanation for this behavior. Consider Fig. 20a for the pool boiling case. The lower plot gives
qualitative curves for the cavity size distribution for smooth and rough surfaces. The upper plot schematically represents the temperature dis-tributions representing equilibrium of a vapor bubble and the liquid condition. If the liquid temperature profile were T kr when pool boiling was taking place on a rough surface, the number of active nucleation sites would be shown as the shaded area on the right of the lower plot. In
order to activate the same number of nucleation sites for the smooth
surface, and thereby accomodate the same heat flux, the liquid temperature profile T k5 must intersect at a higher temperature level. A higher wall superheat is thus required for the smooth surface. Figure 20b presents the same construction for flow boiling. Due to the elevation of the heat flux level, the liquid temperature profiles are steep. This results in a relatively small difference between the superheats required to activate the same number of cavities for the rough and smooth surfaces.
The present data pertaining to the effect of surface condition are given in Fig. 21. In the region of fully developed boiling where the influence of subcooling is negligible, the rougher surface has a wall superheat only about 5 *F less than that for the smooth surface. This is