HAL Id: hal-00765891
https://hal-polytechnique.archives-ouvertes.fr/hal-00765891
Submitted on 7 Feb 2013
HAL is a multi-disciplinary open access
archive for the deposit and dissemination of
sci-entific research documents, whether they are
pub-lished or not. The documents may come from
teaching and research institutions in France or
abroad, or from public or private research centers.
L’archive ouverte pluridisciplinaire HAL, est
destinée au dépôt et à la diffusion de documents
scientifiques de niveau recherche, publiés ou non,
émanant des établissements d’enseignement et de
recherche français ou étrangers, des laboratoires
publics ou privés.
Far infrared spectra of solid state aliphatic amino acids
in different protonation states.
A. Trivella, T. Gaillard, R.H. Stote, P. Hellwig
To cite this version:
A. Trivella, T. Gaillard, R.H. Stote, P. Hellwig. Far infrared spectra of solid state aliphatic amino
acids in different protonation states.. Journal of Chemical Physics, American Institute of Physics,
2010, 132 (11), pp.115105. �10.1063/1.3356027�. �hal-00765891�
Far infrared spectra of solid state aliphatic amino acids in different
protonation states
Aurélien Trivella,1Thomas Gaillard,2,3Roland H. Stote,2,4and Petra Hellwig1,a兲 1
Institut de Chimie, UMR 7177, Laboratoire de Spectroscopie Vibrationnelle et Électrochimie des Biomolécules, Université de Strasbourg, 1 rue Blaise Pascal, Strasbourg F-67070, France
2
Institut de Chimie, UMR 7177, Laboratoire de Biophysicochimie Moléculaire, Université de Strasbourg, 4 rue Blaise Pascal, Strasbourg F-67070, France
3
Department of Biology, Laboratoire de Biochimie (CNRS UMR 7654), Ecole Polytechnique, Palaiseau 91128, France
4
Department of Structural Biology and Genomics, Biocomputing Group, Institut de Génétique et de Biologie Moléculaire et Cellulaire, Université de Strasbourg, CNRS UMR 7104, INSERM U964, 1 rue Laurent Fries, Illkirch, France
共Received 26 October 2009; accepted 16 February 2010; published online 19 March 2010兲 Far infrared spectra of zwitterionic, cationic, and anionic forms of aliphatic amino acids in solid state have been studied experimentally. Measurements were done on glycine, L-alanine, L-valine, L-leucine, and L-isoleucine powder samples and film samples obtained from dried solutions prepared at pH ranging from 1 to 13. Solid state density functional theory calculations were also performed, and detailed potential energy distributions were obtained from normal mode results. A good correspondence between experimental and simulated spectra was achieved and this allowed us to propose an almost complete band assignment for the far infrared spectra of zwitterionic forms. In the 700– 50 cm−1range, three regions were identified, each corresponding to a characteristic set of normal modes. A first region between 700 and 450 cm−1mainly contained the carboxylate bending, rocking, and wagging modes as well as the ammonium torsional mode. The 450– 250 cm−1region was representative of backbone and sidechain skeletal bending modes. At last, the low wavenumber zone, below 250 cm−1, was characteristic of carboxylate and skeletal torsional modes and of lattice
modes. Assignments are also proposed for glycine cationic and anionic forms, but could not be obtained for all aliphatic amino acids due to the lack of structural data. This work is intended to provide fundamental information for the understanding of peptides vibrational properties. © 2010
American Institute of Physics. 关doi:10.1063/1.3356027兴
I. INTRODUCTION
Amino acids are the elementary units of proteins which are essential molecules for life. Having a good knowledge of low frequency vibrations of amino acids is of critical impor-tance for understanding protein reactivity and function. Early investigations were reported by Heintz1 and later by Genzel
et al.2–4During the last decade, the number of studies on the vibrational properties of amino acids strongly increased, in-cluding amino acids in the solid state,5–13 in aqueous solution,14–18 gas phase,19 cryogenic matrixes,20–23 or in a context mimicking a protein active site.24,25
Depending on their environment and physical state, the structural properties of amino acids will differ. In the gas phase, the uncharged form is predominant, while in aqueous solution and in solid state the zwitterionic form is present.26,27 In a charged medium or complex environments like a protein, protonated or deprotonated forms of amino acids can also be observed and changes in protonation states of amino acids are important in many enzymatic reactions.14 Whereas the amino acid conformation is well defined in solid state, it is more variable in aqueous solution and gas phase.
In addition, the solid state zwitterionic form, where the am-monium group of a molecule usually forms interactions with carboxylate groups of other molecules,28 has a different ori-gin than the zwitterionic form in aqueous solution, where hydrogen bonding occurs between amino acids and sur-rounding water molecules.29 These chemical and structural differences influence the infrared vibrational spectrum, in particular in the far infrared region, which is the most af-fected by intermolecular interactions. The solid state spec-trum of a molecular crystal is thus expected to include crys-tal lattice and hydrogen bond vibrations below 250 cm−1.12
This study focuses on aliphatic amino acids: glycine, L-alanine, L-valine, L-leucine, and L-isoleucine. These amino acids involve two main acid-base couples, CO2H / CO2− and NH3+/NH2, with corresponding pKa values
around pH 2.3 and 9.8, respectively.30 The 700– 50 cm−1 range of the infrared spectrum of these aliphatic amino acids is measured from film samples obtained after drying water solutions prepared at different pH values. Infrared spectrum measurement is also done on powder samples for compari-son. Solid state quantum mechanical vibrational calculations based on the density functional theory 共DFT兲 and a plane-wave pseudopotential approach are performed to comple-ment expericomple-mental infrared measurecomple-ments and enable
de-a兲Author to whom correspondence should be addressed. Electronic mail:
hellwig@unistra.fr.
THE JOURNAL OF CHEMICAL PHYSICS 132, 115105 共2010兲
tailed band assignments. Modeling the zwitterionic form of amino acids either requires implicit solvation, explicit water molecules, or a solid state environment to be taken into ac-count. In gas phase calculations, the zwitterion is not stable and reverts to the uncharged form.31The choice of solid state calculations in this work is based on the expected physical state of our dried film and powder samples when measured by the ATR technique.
Theoretical studies of the vibrational spectra of zwitteri-onic amino acids have been previously reported. Kumar and co-workers16,17 performed gas phase and implicit solvation vibrational calculations on glycine and alanine species, using semiempirical, ab initio, and DFT methods. Tortonda et al.32 and Gontrani et al.33explored the geometry and vibrations of glycine and alanine zwitterions with ab initio and DFT meth-ods and polarizable continuum models. Other ab initio or DFT studies employed a different approach by including ex-plicit water molecules around glycine or alanine zwitterions.15,34,35Some of these theoretical works were not successful in reproducing experimental geometries or had difficulties to sample all conformations accessible in liquid phase. They did not discuss the correspondence with experi-mental data below 400 cm−1. Very few studies focused on
the cationic and anionic forms of amino acids and the lowest wavenumbers were not explored.36,37 The plane-wave pseudopotential computational methodology employed in this work was shown by Jepsen and Clark38to give accurate predictions of terahertz vibrational modes of organic crystal-line systems, provided that stringent convergence criteria are employed. Calculations using a similar approach have re-cently been applied to the prediction of vibrational modes of solid state glycine and L-alanine by Chowdhry et al.39 The authors compared solid state and aqueous solution vibra-tional calculations with infrared and Raman experimental data. Assignments of solid state normal modes were realized by visual inspection. Williams et al.40employed an interest-ing scaled quantum mechanical harmonic force field ap-proach including anharmonic corrections to the study of polycrystalline L-alanine. Good agreement with experimen-tal spectra is obtained, however, scaling factors needed to be determined empirically.
In this study, experimental far infrared measurements of glycine, L-alanine, L-valine, L-leucine, and L-isoleucine are presented showing the spectra pH-dependence over a 1.0– 13.0 pH range. DFT calculations are performed on the amino acid zwitterion crystals. We concentrate on the far infrared, lowest frequency normal modes, which require the most pre-cision and convergence in calculations. Analysis of the com-putational results and potential energy distributions 共PEDs兲 of modes allows detailed and almost complete assignments of experimental spectra bands. This study is in line with the growing use of far infrared spectroscopy 共FIR兲 measure-ments applied to biomolecules.
II. EXPERIMENTAL METHODS
Glycine 共purity ⱖ99%兲, L-alanine, L-valine, L-leucine, and L-isoleucine 共purities ⱖ98%兲 were obtained from Sigma-Aldrich and used without further purification.
Solu-tions were prepared by dissolving amino acid powders in distilled water to a final concentration of 0.10 mol L−1
共⫾0.01兲. Solutions at pH values ranging from 1.0 to 13.0 were obtained by addition of HCl or NaOH, and control by a pH electrode.
Far infrared measurements were carried out at room tem-perature on a Vertex 70 共Bruker兲 Fourier transform spectrom-eter equipped with a globar source, a RT-dTGS detector and a silicon beam splitter. The sample compartment was purged with dry air to reduce interference of H2O and CO2. Spectra
were recorded from 700 to 50 cm−1 with an ATR cell 共Har-rick兲 equipped with a diamond crystal 共6 mm2兲 as reflecting element. Films of aliphatic amino acids were obtained by drying 2 L of water solution in a stream of warm air on the diamond surface. Resolution was 4 cm−1 and 128 scans were accumulated for each spectrum. The instrument and the sample chamber were purged with dry air to avoid contribu-tions from humidity. Residual absorption of gas water on the spectra was subtracted. All spectra were smoothed with nine points.
III. COMPUTATIONAL METHODS
Starting coordinates and lattice parameters were ex-tracted from the Cambridge Structural Database41 共CSD兲. Entries were GLYCIN,42 GLYCIN02,43 LALNIN,44 LVALIN01,45 LEUCIN01,46 and LISLEU0247 for  poly-morph glycine, ␣ polymorph glycine, L-alanine, L-valine, L-leucine, and L-isoleucine crystals, respectively. All these entries contained hydrogen atom positions. Because of the uncertainty on glycine polymorphic state, we performed cal-culations on two states,␣and. A glycinium chloride struc-ture was also extracted from the CSD, entry GLYHCL01,48 and the coordinates of a lithium glycinate structure were taken as published by Müller et al.49The lithium cation was replaced by a sodium cation to match experimental condi-tions.
Plane-wave pseudopotentials DFT calculations were done with the CASTEP program.50 The PW91 functional51 was employed along with norm-conserving pseudopotentials and a kinetic energy cutoff of 1200 eV. Brillouin zone inte-gration was performed using a k-point set defined by a 2 ⫻2 ⫻ 2 Monkhorst–Pack grid.52 Electronic minimization was performed using the conjugate gradient method to a con-vergence criterion of 10−10 eV/atom. Geometry optimization
was carried out using the Broyden–Fletcher–Goldfarb– Shanno optimization scheme until atomic forces were lower than 10−5 eV/ Å. Cell optimization was performed until the
maximum component of the stress tensor was lower than 0.1 GPa. Density functional perturbation calculations53 were then performed on optimized structures. The zone center phonon modes were calculated, as well as corresponding fre-quencies and infrared intensities.
A set of nonredundant local symmetrical internal coordi-nates was defined for each molecule according to the Pulay methodology.54 This provides a more useful description of the vibrational potential energy than working with Cartesian coordinates, making comparisons between similar molecules easier. PEDs of each mode were calculated with theMOLVIB
program.55 Modes with similar molecular components but different phase relationships between the individual mol-ecules were grouped together by calculating the squared dot products between all mode molecular components and maxi-mizing it within a group of modes. Simulated infrared spec-tra were obtained by convolution of computed mode intensi-ties with Gaussian functions of 10 cm−1 width.
IV. RESULTS AND DISCUSSION
Far infrared spectra 共700– 50 cm−1兲 of aliphatic amino acids powder samples and film samples obtained from dried solutions prepared at different pH are presented. The respec-tive spectra of zwitterionic, cationic, and anionic forms can be identified based on spectra pH-dependence. For pH values near the respective pKa values, spectra display absorptions of two species 共anion and zwitterion or zwitterion and cation兲.56 At very high and very low pH, presence of the counterion is not negligible and can explain some additional changes in the spectrum 共sharpening of bands below 250 cm−1兲.57
Solid state quantum chemistry vibrational cal-culations results are reported and employed to interpret ex-perimental spectra based on the order of modes, relative in-frared intensities, PEDs, and symmetry considerations. Additional details as well as annotated comparisons of ex-perimental and theoretical spectra in higher resolution are available in supplementary material58and can help the reader to follow band assignments.
In the following, amino acid heavy atom names follow IUPAC nomenclature 共N , C , C␣, C, . . .兲. Abbreviations em-ployed for vibrations are共stretching兲,␦共bending兲, 共rock-ing兲, t 共twist共rock-ing兲,共wagging兲, and共torsion兲.
A. Glycine
Glycine is the simplest amino acid. Far infrared spectra measured for the powder sample and homogeneous films ob-tained from aqueous solutions at different pH are presented in Fig.1. Based on spectra comparison as a function of pH, we attribute the 3.0–9.0 pH range to the zwitterionic form, the 1.1–2.1 pH range to the cationic form, and the 10.2–13.0 range to the anionic form.
Zwitterion. Glycine spectra measured from the dried so-lution prepared at pH 6.6 and from the powder sample pre-sented significant differences, in particular, in the low fre-quency region below 250 cm−1. It is known that glycine
zwitterionic crystals exist in three main polymorphic states, ␣,, and␥. Based on comparison in the mid-infrared region of our powder and film samples to␣,, and␥glycine spec-tra published by Chernobai et al.,59 we propose that the ␣ polymorph is the predominant form in glycine powder samples, and thepolymorph is predominant in glycine film samples. The␣ and  glycine crystals are both monoclinic but differ in their space groups, P21/n and P21, respectively.
Although glycine is known to be a metastable form,59 its presence in film samples would not require long time stabil-ity as the solid is formed in situ by drying the solution on the diamond cell and measured straight afterwards.
Glycine spectra in the 700– 450 cm−1range first showed a medium band centered at 606 cm−1for the powder sample,
and a medium band at 608 cm−1 for the dried film sample
prepared from the solution at pH 6.6. These bands are both attributed to the 共CO2−兲 wagging mode by us and earlier
works,39,60,61while Matei et al. assigned them to the␦共CO2−兲 bending mode.8 The assignment of the 共NH3+兲 torsional mode for glycine has been a source of controversy due to the difficulty to accurately predict its position with theoretical approaches.39 This was the case in our DFT calculations as well. The assignment was therefore based on experimental evidence.8,9,60,62
The film sample showed two well resolved bands at 521 and 483 cm−1. We attribute the film sample medium band at 521 cm−1 to the 共NH
3
+兲 torsional mode and the medium
band at 483 cm−1to the共CO2−兲 rocking mode. This assign-FIG. 1. Far infrared spectra of glycine powder sample and dried film samples prepared from solutions at different pH. Major experimental peaks are labeled. Calculated peaks for glycinezwitterion,␣zwitterion, cation, and anion are superposed on pH 6.6 film sample, powder sample, pH 1.1, and pH 13.0 film sample experimental spectra, respectively.
ment is supported by additional hydrogen-deuterium ex-change and low temperature experiments 共see supplementary material兲.58 A 31 cm−1 downward shift of the band at
521 cm−1was indeed observed after deuteration. Moreover,
by cooling the film sample to 14 K, a 12 cm−1 shift of the
band at 521 cm−1 toward higher frequencies was observed, whereas the band at 483 cm−1shifted only by 2 cm−1in the same direction. This is in agreement with previous results2,62 showing a strong temperature dependence of the共NH3+兲
vi-bration as opposed to the carboxylate deformation, and in contradiction with Murli et al.9
The powder sample displayed a broad band at 500 cm−1
with a shoulder at 523 cm−1. In other studies where samples
were cooled to liquid nitrogen temperature, splitting of the broad band at 500 cm−1 occurred and two bands centered at 493 and 520 cm−1 became clearly visible.9,62 Feairheller et
al.62 assigned the latter band to the 共NH3+兲 mode while
Murli et al.9assigned it to the共CO2−兲 mode. Based on
deu-teration and temperature effects observed by us on the film sample spectrum, we assign the共NH3+兲 mode to the shoulder at 523 cm−1and the共CO2−兲 mode to the band at 500 cm−1.
In the 450– 250 cm−1 range, only one medium broad
band at 352 cm−1 was observed for the glycine powder
sample and is assigned to the ␦共NC␣C兲 backbone bending mode.8,61The glycine pH 6.6 film displayed two shouldered bands centered at 377 and 354 cm−1. The relative intensity
of these two bands had a strong pH-dependence 共see Fig.1兲. An additional band at 335 cm−1was seen at pH 3.0 共shoul-der兲 and pH 2.1. We note that at pH values close to the glycine CO2H / CO2− pKa value of 2.35,
63
zwitterionic and cationic forms are in equilibrium and mixed spectra are ex-pected. We assign both bands observed for the pH 6.6 film spectrum at 377 and 354 cm−1 to the␦共NC␣C兲 mode.60
Spectra of powder and film samples presented significant differences below 250 cm−1. In this region, we observed for
the powder sample a very broad massif containing shoulders at 227 and 194 cm−1 and bands at 165, 134, and 62 cm−1.
Four thin and well defined bands centered at 207, 181, 153, and 61 cm−1 were observed for the film sample. Based on
our calculations, we assign all these bands to lattice modes with the exception of bands at 165 cm−1 共powder兲 and
153 cm−1共film兲 which are attributed to the共CO 2
−兲 torsional
mode. The band at 181 cm−1共film兲 was previously assigned
to the共CO2−兲 mode by Goryainov et al.,60
while the band at 134 cm−1 共powder兲 was assigned to hydrogen bond
N – H ¯ O elongation vibration by Matei et al.8 and Feairheller et al.62This latter attribution is not incompatible with our results since hydrogen bond parameters were not included in the set of nonredundant symmetry coordinates employed. Visual examination of the modes attributed to the band at 134 cm−1 indeed shows important contribution to
hydrogen bond elongations. We note a relatively good corre-spondence of experimental and calculated spectra overall shape below 250 cm−1for both forms. This is in favor of the
attribution of powder and film samples to glycine ␣ and  polymorphs, respectively.
Cation. The spectrum of the film sample at pH 1.1 is
taken as reference for the analysis of the glycine cationic form. As mentioned above, intermediate spectra observed at
pH 2.1 and 3.0 suggest that a mixture of zwitterionic and cationic forms are present at these pH values. Surprisingly, the film sample at pH 2.1 and zwitterion powder sample spectra present some similarities below 250 cm−1. It is
un-clear whether this resemblance is fortuitous or results from a change in polymorphic state of the zwitterionic part of the mixture. The cationic form displayed bands at 638 and 497 cm−1, which are, respectively, assigned to the␦共CO2H兲
and共CO2H兲 modes. The共NH3+兲 mode is predicted to have
a frequency around 460 cm−1 and to be coupled to the
a共Cl−H共N兲兲 chloride-ammonium hydrogen antisymmetric
stretching mode by calculations, however, no experimental band is visible in this region. By analogy with the frequency overestimation of the共NH3+兲 mode noticed in glycine
zwit-terion calculations, we propose that this mode corresponds to the weak experimental band near 375 cm−1, to the left of the
broad peak centered at 296 cm−1. This latter band is
as-signed to the ␦共NC␣C兲 vibration. Low frequency peaks at 166, 148, and 89 cm−1 are tentatively attributed to a rotational/共Cl−H共O兲兲 chloride-carboxylic acid hydrogen
stretching mode, a共CO2H兲 /共NH3+兲 mode, and a rotational
mode, respectively.
Anion. FIR spectra of the glycine anionic form were
measured at pH 10.2, 11.1, 12.1, and 13.0. Principal changes between these spectra were localized below 250 cm−1. The
very broad band centered at 202 cm−1 at pH 10.2 became refined at pH 13.0 and other maxima appeared. The spectrum of the film sample at pH 13.0 is taken as reference for the analysis of the glycine anionic form. Compared to zwitteri-onic and catizwitteri-onic forms, glycine anizwitteri-onic form spectrum con-tained more peaks in the 700– 50 cm−1 range, probably due
to more coupling of modes involving the alkaline cation in this region. Bands at 677 and 580 cm−1 are assigned to the
␦共CO2−兲 and共CO2−兲 modes, respectively. A medium band at 513 cm−1and two weak bands at 446 and 376 cm−1are then
observed. We tentatively attribute them to modes implicating the alkaline cation, namely, the 共ONa+兲 carboxylate
oxygen-sodium ion stretching mode, the rotational/ ␦共CONa+兲 carboxylate-sodium ion bending mode, and the
rotational/共CONa+兲 carboxylate-sodium ion torsional mode,
respectively. The band at 311 cm−1 is assigned to a ␦共NC␣C兲 /共CO2−兲 mode. Anticipating a frequency shift for the 共NH2兲 amine torsional mode, by analogy with the
fre-quency overestimation observed for glycine cation and zwit-terion ammonium torsional modes, we propose that the 共NH2兲 mode corresponds to the 256 cm−1 shoulder band.
The band at 211 cm−1 has a very strong infrared intensity, which appears significantly underestimated in the simulated spectrum. We assign this band to a translational/␦共CONa+兲
mode, based on cation replacement experiment. We indeed observed a 68 cm−1 shift of the 211 cm−1 band toward lower wavenumbers when KOH was employed instead of NaOH 共see supplementary material兲.58 This frequency shift can be explained by the mass increase in the cation coordi-nated to the carboxylate group when switching from Na+to
K+. Remaining bands at 163, 131, and 114 cm−1 are
tenta-tively assigned to the 共CONa+兲 mode, a translational/
rotational mode, and a共CO2−兲/rotational mode.
in different protonation states managed to identify several changes observed in experimental spectra as a function of pH. For example, going from the low pH of 1.1 to neutral pH and then to the high pH of 13.0, calculations reproduced well the shift of the peak attributed to the ␦共NC␣C兲 vibration, from 296 to 352 and then to 311 cm−1. In the low pH
spec-tra, no peaks were attributed in the range of 400 cm−1 and
no calculated peaks were identified. In the high pH spectra, both experimental and theoretical peaks were present at 376 and 446 cm−1. Finally, the low pH peak at 638 cm−1 was identified by the calculations. At high pH, this peak is not observed, however a peak at high frequency 共677 cm−1兲 ap-pears, which is well reproduced by the calculations. This coherence with experimental data as a function of pH sup-ports the utility of these calculations for peak attribution and suggests that calculations at this level can be used for pre-dictive purposes.
B. L-alanine
L-alanine is the simplest chiral amino acid. Far infrared spectra measured for the powder sample and homogeneous films obtained from aqueous solutions at different pH are presented in Fig.2. Based on spectra comparison as a func-tion of pH, we attribute the 2.9–10.3 pH range to the zwit-terionic form, the 1.1–2.0 pH range to the cationic form, and the 10.9–12.9 range to the anionic form.
Zwitterion. L-alanine spectra measured from the dried
solution prepared at pH 6.5 and from the powder sample presented some differences, in particular below 200 cm−1. There is only one known polymorphic state for the L-alanine zwitterionic crystal and limited variations in available crys-tallographic structures. Differences in the lowest frequency spectrum between powder and film samples could arise from changes in the size and quality of crystals at the microscopic level between the two forms. In the study of Rungsawang et
al.64 which applied angle-dependent terahertz time-domain spectroscopy to L-cysteine and L-histidine, such differences are explained by additional hydrogen bond peaks in the film spectrum as a result of a larger hydrogen-bond network in comparison to powder sample.
In the 700– 450 cm−1 range we observed a medium
band at 648 cm−1, which is attributed by us to a
␦共CO2−兲 /␦共NC␣C兲 coupled mode, but a 共CO 2
−兲 rocking
mode by Matei et al.8and Chowdhry et al.,39or to a共CO2−兲
wagging mode by Herlinger et al.61 and Wang et al.65 A strong band at 539 cm−1 is attributed to the共CO
2 −兲
vibra-tion. As for glycine, the frequency of the共NH3+兲 mode was overestimated by our calculations, around 570 cm−1, while a
weak experimental band centered at 486 cm−1 did not fit
with calculations. In previous reports the共NH3+兲 vibrational mode was attributed to the latter band.8,39,61,65,66 The 450– 250 cm−1 range showed a strong band at 409 cm−1,
which is attributed to the␦共NC␣C兲 bending mode,61,65 me-dium bands at 324 and 292 cm−1 are both assigned to a
␦共NC␣C兲 /共CO2−兲 coupled mode, the medium band at 278 cm−1is attributed to the␦共CC␣C兲 bending mode, and
the weak band at 259 cm−1 to the共CH
3兲 torsional mode.
This latter mode was assigned to the band at 292 cm−166or
at 278 cm−1 8,67
by previous works. Below 250 cm−1, some
changes appeared between zwitterionic samples obtained from powder and dried film prepared at pH 6.5. Bands at 221 and 201 cm−1 were common to both samples and are
as-signed to lattice rotational modes. The film band at 173 cm−1 is attributed to the 共CO
2
−兲 mode and probably
corresponds to the powder band at 160 cm−1. The powder
sample further displayed absorptions at 140, 102, 85, and 57 cm−1, whereas the film sample showed signals at 109 and
79 cm−1. These latter absorptions are assigned to lattice
modes.
Cation and anion. FIR spectra of L-alanine cationic
form could be observed at pH 2.0 and 1.1. The spectrum of the film sample at pH 1.1 is taken as reference for the analy-sis of the L-alanine cationic form. The main difference at pH FIG. 2. Far infrared spectra of L-alanine powder sample and dried film samples prepared from solutions at different pH. Major experimental peaks are labeled. Calculated peaks for the L-alanine zwitterion are superposed on the pH 6.5 experimental spectrum.
1.1 was the formation of a thin and very strong band at 175 cm−1. We tentatively assign this strong band at
175 cm−1to the共CO
2H兲 mode and the signal at 518 cm−1
to the共CO2H兲 vibrational mode.
We observed the spectra of the L-alanine anionic form at pHⱖ 10.9. Changes in the spectrum between pH 10.9 and 12.9 were moderate and mostly significant below 250 cm−1.
In particular, the strong and broad band around 200 cm−1
observed at pH 10.9 was sharpened at pH 12.9. The spectrum of the film sample at pH 12.9 is taken as reference for the analysis of the L-alanine anionic form. The medium band at 539 cm−1is tentatively assigned to the共CO2−兲 mode and the
strong band at 220 cm−1to the共CO 2 −兲 mode.
C. L-valine
L-valine far infrared spectra measured for the powder sample and homogeneous films obtained from aqueous solu-tions at different pH are presented in Fig.3. Based on spectra comparison as a function of pH, we attribute the 2.9–10.1 pH range to the zwitterionic form, the 1.0–2.0 pH range to the cationic form, and the 10.9–12.9 range to the anionic form.
Zwitterion. L-valine spectra measured from the dried so-lution prepared at pH 6.3 and from the powder sample are very similar. While for the glycine and L-alanine spectra discussed before, where film and powder samples showed some differences, the L-valine data were identical even at low wavenumbers. Only some changes on relative intensities have been observed. The presence of two L-valine molecules in the crystal asymmetric unit, each having a distinct confor-mation of the C␣-Ctorsion angle, complicates the analysis of modes at the single molecule level and gives rise to a more complicated spectrum with duplication of peaks.
As it was seen for glycine and L-alanine, the 700– 450 cm−1 region is typical of CO
2
− bending, rocking,
and wagging vibrations, and NH3+ torsion vibration. In the case of L-valine, contributions of an additional vibrational mode appeared. We assign the medium band at 663 cm−1 to
a ␦共NC␣C兲 /␦共CO2−兲 /共CO 2
−兲 mode. Vibrational coupling is
strong here and respective contributions of the ␦共NC␣C兲, ␦共CO2−兲, and 共CO
2
−兲 vibrations are only 18%, 16%, and
16%, respectively. The strong band at 540 cm−1 is assigned
to the 共CO2−兲 mode. This band was also attributed to the
共CO2−兲 mode in previous works.7,61,68
The position of the 共NH3+兲 mode of L-valine, as for smaller aliphatic amino ac-ids, is not correctly predicted by calculations. We propose that the weak band observed experimentally at 495 cm−1and
not predicted by the calculations corresponds to the共NH3+兲 vibration. This latter vibration was assigned to the band at 472 cm−1by Lima et al.,7
while we attribute the weak band at 472 cm−1to the␦共C␣CC␥兲 sidechain bending mode. In
the 450– 250 cm−1 range, major contributions were skeletal
bending modes. This result is in agreement with other works.7,61,68Bands at 440 and 427 cm−1are attributed to the
␦共NC␣C兲 mode, the medium peak at 399 cm−1 to the
␦共C␥CC␥兲 mode, bands at 374 and 333 cm−1 to the
␦共C␣CC␥兲 mode, the medium peak at 292 cm−1 to the
␦共NC␣C兲 vibration coupled to the 共CO2−兲 mode, and the medium peak at 279 cm−1 to the ␦共CC␣C兲 mode. In the
low frequency region, signals at 228, 218, 180, and 145 cm−1 are tentatively attributed to 共CO
2 −兲,
共C␣C兲 /共C␥H3兲, 共C␥H3兲/rot, and 共C␣C兲 torsional
modes, respectively. Remaining low frequency modes are at-tributed to lattice modes.
Cation and anion. FIR spectra of the L-valine cationic form were measured for pHⱕ 2.9. The spectrum obtained from the solution at pH 2.9 showed some overlap of the bands of cationic and zwitterionic forms. Significant changes in the absorptions are observed at lower pH. The spectrum of the film sample at pH 1.0 is taken as reference for the analy-sis of the L-valine cationic form. We tentatively attribute the band at 534 cm−1 to the 共CO
2H兲 mode and the band at
170 cm−1to the共CO
2H兲 vibrational mode.
Spectra of the L-valine anionic form were observed at FIG. 3. Far infrared spectra of L-valine powder sample and dried film samples prepared from solutions at different pH. Major experimental peaks are labeled. Calculated peaks for the L-valine zwitterion are superposed on the pH 6.3 experimental spectrum.
pHⱖ 10.9. Comparing spectra of the anionic form at pH 10.9, 11.8, and 12.9, we noticed several differences including the formation of a band centered at 519 cm−1at higher pH.
While we observed a strong and broad band at pH 10.9 and 11.8, a fine structure appeared at pH= 12.9 below 280 cm−1.
The spectrum of the film sample at pH 12.9 is taken as a reference for the analysis of the L-valine anionic form. The most intense band of this spectrum was centered at 199 cm−1 and is tentatively assigned to the 共CO2−兲 vibrational mode. We tentatively assign the band at 541 cm−1 to the 共CO2−兲
mode.
D. L-leucine
L-leucine far infrared spectra measured for the powder and film samples obtained from aqueous solutions at differ-ent pH are presdiffer-ented in Fig.4. Based on spectra comparison as a function of pH, we attribute the 3.0–10.2 pH range to the zwitterionic form, the 1.0–2.0 pH range to the cationic form, and the 10.9–13.0 range to the anionic form.
Zwitterion. Without considering the relative intensity of bands, the spectra of L-leucine powder sample and film sample prepared at pH 6.7 were very similar. As for L-valine, the presence of two molecules in the asymmetric unit com-plicates the calculated spectrum and the analysis.
In the 700– 480 cm−1 range we observed two intense
bands at 668 and 534 cm−1, which we assign to␦共CO 2 −兲 and
共CO2−兲 vibrational modes, respectively. Whereas the same
attribution has been proposed by Façanha et al.5 and Her-linger et al.61 for the band at 534 cm−1, they assigned the
band at 668 cm−1to the共CO 2
−兲 mode. For smaller aliphatic
amino acids, this domain also contained the 共NH3+兲 mode,
whose calculated frequency was generally to high. Although no other major bands could be observed in the FIR spectra of the L-leucine zwitterion, a careful examination shows that a very weak band/shoulder is present around 507– 502 cm−1,
on the low wavenumbers side of the band at 534 cm−1. We
assign this very weak band to the 共NH3+兲 torsional mode.
The 480– 280 cm−1 range displayed bands mostly
corre-sponding to skeletal deformation modes, in agreement with previous studies.5,61 The shoulder at 456 cm−1 is attributed
to the␦共C␦C␥C␦兲 mode, the medium band at 442 cm−1and
the strong band at 402 cm−1 to the ␦共CC␥C␦兲 vibration,
the medium band at 364 cm−1 to a ␦共NC␣C兲 /共CO 2 −兲
coupled mode, and the strong bands at 343 and 330 cm−1to
␦共C␦C␥C␦兲 /共CO2−兲 /␦共NC␣C兲 and ␦共C␦C␥C␦兲 /
␦共NC␣C兲 /␦共CC␥C␦兲 coupled modes, respectively. Based on the hypothesis of a frequency shift between calculated and experimental low frequency bands below 280 cm−1, we
tentatively assign the medium band at 223 cm−1 to a
␦共C␣CC␥兲/rotational mode, the strong band at 203 cm−1
to the 共C␦H3兲 torsional mode, the medium peak at
170 cm−1to the共CO 2
−兲 mode, the shoulder at 138 cm−1 to
a 共CO2−兲 /共C␣C兲 coupled mode, the strong band at 122 cm−1 to a rotational/共CO
2
−兲 /共CC␥兲 coupled mode,
and the shoulder at 107 cm−1 to the 共CC␥兲 torsional
mode. We note that the strong intensity of the band at
122 cm−1 relative to its neighbors is not well reflected in
calculations. Remaining bands are attributed to lattice modes.
Cation and anion. Spectra of the L-leucine cationic form were observed at pHⱕ 2.0. At pH 3.0 and 3.7 the main form was zwitterionic, although a band centered around 305 cm−1 seems to arise from the cationic form. The spectrum of the film sample at pH 1.0 is taken as reference for the analysis of the L-leucine cationic form. We tentatively assign the bands at 527 and 166 cm−1 to the 共CO
2H兲 and 共CO2H兲
vibra-tional modes, respectively.
FIR spectra of the L-leucine anionic form were observed at pHⱖ 10.9. A band observed at 308 cm−1 in the pH 10.2 spectrum could also reveal the presence of the anion at this pH. This band shifted at higher pH. We consider the spec-FIG. 4. Far infrared spectra of L-leucine powder sample and dried film samples prepared from solutions at different pH. Major experimental peaks are labeled. Calculated peaks for the L-leucine zwitterion are superposed on the pH 6.7 experimental spectrum.
trum of the film sample at pH 13.0 for the analysis of the L-leucine anionic form. Similarly to attributions proposed for smaller aliphatic amino acids, we tentatively assign the band at 547 cm−1to the共CO
2
−兲 mode and the strong band at
211 cm−1to the共CO 2
−兲 vibrational mode.
E. L-isoleucine
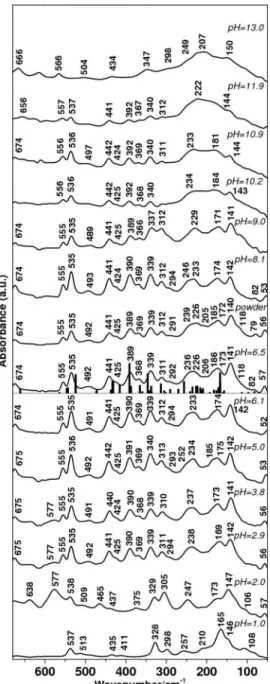
FIR spectra of L-isoleucine measured for the powder and film samples obtained from aqueous solutions at different pH are presented in Fig. 5. Based on spectra comparison as a function of pH, we attribute the 2.9–9.0 pH range to the zwitterionic form, the spectrum recorded at pH 1.0 to the cationic form, and the 10.2–13.0 range to the anionic form.
Zwitterion. Sample preparation did not influence peak
position in the FIR spectra of the zwitterionic form except
for relative intensity. The spectra of L-isoleucine powder and film prepared at pH 6.5 were similar. As for L-valine and L-leucine, the presence of two molecules in the asymmetric unit leads to a duplication of peaks and complicates the analysis of modes.
In the 700– 480 cm−1 range, we assign the medium bands at 674 and 555, and the strong band at 535 cm−1 to ␦共CO2−兲 /␦共NC␣C兲, 共CO
2
−兲 /␦共NC␣C兲, and
共CO2−兲 /共C␣C兲 coupled modes, respectively. The weak and
broad band observed at 492 cm−1was generally assigned in
previous studies to a␦共CCC兲 skeletal mode,6,61,69but to the 共NH3+兲 torsional mode by Matei et al.8Our calculations pre-dicted the position of the共NH3+兲 mode around 560 cm−1but
we have seen for other aliphatic amino acids that the fre-quency of this mode was systematically overestimated. On the other hand, a peak corresponding to the␦共C␣CC␥2兲 is predicted by our calculations around 473 cm−1, close to
492 cm−1. Additional data would be needed here to propose a definitive assignment between the 共NH3+兲 mode and the ␦共C␣CC␥2兲 mode for the weak band at 492 cm−1
experi-mental value. The 480– 280 cm−1 region of the spectrum
showed a particular pattern with three strong bands each flanked by a medium band on the low wavenumber side. These absorptions mostly correspond to skeletal bending modes, in agreement with previous studies.6,61,69 The strong band at 441 cm−1is assigned to the␦共C␥CC␥兲 mode, the
medium band at 425 cm−1 to the ␦共C␣CC␥2兲 mode, the
strong band at 389 cm−1 to a ␦共C␥CC␥兲 /␦共NC␣C兲
coupled mode, the medium band at 368 cm−1 to a
␦共CC␥1C␦兲 /␦共NC␣C兲 coupled mode, the strong band at 339 cm−1to a共CO
2
−兲 /␦共NC␣C兲 coupled mode, and the
me-dium peak at 311 cm−1 to a ␦共NC␣C兲 /␦共C␥CC␥兲 / ␦共NC␣C兲 coupled mode. Finally, a weak additional shoulder at 292 cm−1 is assigned to the ␦共C␣CC␥1兲
mode. Below 280 cm−1, based on the hypothesis of an overestimation of the frequency of rotational modes in the calculations, we attribute the strong band at 236 cm−1 to
the 共C␥2H3兲 mode, bands at 226 and 206 cm−1 to the
␦共CC␣C兲 mode, the shoulder at 186 cm−1to the 共CO 2 −兲
mode, the strong band at 173 cm−1 to the 共C␦2H3兲, the
strong band at 141 cm−1 to a rotational mode, and the shoulder at 118 cm−1to the共CC␥1兲 mode. The band at 236 cm−1 was also assigned to a 共CH兲 mode by Pawlukojc et al.69but the band at 173 cm−1was attributed to 共CO2−兲.6,69
Remaining bands at 82 and 57 cm−1 are attributed to lattice modes.
Cation and anion. FIR spectra of the L-isoleucine cat-ionic form are found at pHⱕ 2.0. We tentatively assign bands of the pH 1.0 cationic spectrum centered at 537 and 165 cm−1 to共CO2H兲 and共CO2H兲 vibrational modes,
re-spectively.
Spectra of the L-isoleucine anionic form were observed at pHⱖ 10.2. Anionic form FIR spectra of other aliphatic amino acids showed a sharpening of the strong band situated at low wavenumbers when increasing pH. This sharpening was less pronounced for the L-isoleucine anion. We tenta-tively assign the pH 13.0 anionic spectrum band at 566 cm−1 to the共CO2−兲 mode and the band at 207 cm−1to the共CO
2 −兲
vibrational mode. FIG. 5. Far infrared spectra of L-isoleucine powder sample and dried film
samples prepared from solutions at different pH. Major experimental peaks are labeled. Calculated peaks for the L-isoleucine zwitterion are superposed on the pH 6.5 experimental spectrum.
V. CONCLUSIONS
By means of a combined experimental and theoretical approach, involving far infrared measurements and quantum calculations, an almost complete assignment of low fre-quency vibrational modes of aliphatic amino acid zwitterions in solid state was presented. Good correspondence between simulated and experimental spectra confirmed that the film samples are in a well organized solid state and, at the same time, validated the theoretical approach. Deviations between theoretical and experimental spectra can arise from uncer-tainties on the exact microscopic state of experimental samples 共polymorphic state, crystallinity, presence of re-sidual water molecules, etc.兲 and limitations of the theoreti-cal approach 共normal modes theoreti-calculations are performed at 0 K, DFT method limitations, lack of anharmonic effects, etc.兲. The methodology employed in this work can be em-ployed to study other amino acids, in different physical states and environments. We insist here on the importance of a consistent definition of internal coordinates for the descrip-tion of normal modes. For example, the definidescrip-tion of the carboxylate wagging mode in the study of Tortonda et al.32 corresponds to the carboxylate rocking mode of other works.39,54Such inconsistencies can lead to confusion when comparing results between different authors.
From the complete analysis of far infrared amino acid zwitterion spectra, we could identify three characteristic do-mains. A first region between 700 and 450 cm−1mostly
con-tained rocking, bending, and wagging vibrations of the car-boxylate group as well as the torsional vibration of the ammonium group. The 450– 250 cm−1 region essentially contained skeletal backbone and sidechain bending deforma-tion modes. Finally, the lowest frequency region, below 250 cm−1, was characteristic of torsional vibrations
共car-boxylate, methyl groups, and sidechain skeletal torsions兲 as well as lattice modes.
Difficulties occurred for the correct prediction of the 共NH3+兲 torsional mode, the frequency of this mode being systematically overestimated. It can be noted that the NH3+ group of amino acid zwitterions in solid state is particularly involved in intermolecular hydrogen bonds, generally by the three hydrogen atoms. Hydrogen bonds are structural param-eters sensible to temperature effects and to the variations in unit cell dimensions of the crystal. Overestimation of the 共NH3+兲 frequency in calculations could be related to a slight
underestimation of hydrogen bond distances in optimized amino acid crystals. Chowdhry et al.39 proposed that exces-sive rigidity of the ammonium group in calculations was at the origin of the frequency overestimation.39
Below 250 cm−1, prediction of bands was difficult.
Fre-quency of modes was generally overestimated around 200 cm−1 and intensity was significantly underestimated. Correct predictions of modes with translational and rota-tional components are likely to highly depend on the inter-molecular arrangement of molecules and crystal cell dimen-sions. As for the 共NH3+兲 mode, possible reasons for frequency overestimation include temperature effects and theoretical model limitations. A possible explanation for the important underestimation of low frequency mode intensity
could be the presence of residual water molecules in crystals, which would cause high intensity bands in this region of the spectrum. Another explanation could be the lack of phonon dispersion contributions to lattice modes, as the calculations were done only at the gamma point.70In addition, the analy-sis of the lowest frequency modes in terms of individual contributions was complicated by important vibrational-rotational couplings. The main origin of such couplings is the network of intermolecular hydrogen bond and ionic interac-tions, which can couple individual molecule rigid-body de-grees of freedom to the vibrational motion of other amino acids in the crystal.
It was more difficult to propose a detailed analysis of cation and anion FIR spectra, due to the lack of available structural data that would be necessary to perform calcula-tions on all of these forms. We nevertheless identified some characteristic features of aliphatic amino acids FIR spectra at extreme pH. At pH values close to 1.0 we typically observed a strong and thin band around 170 cm−1while for pH close
to 13.0 we observed a strong and broad band around 210 cm−1.
Additional experimental and theoretical studies are still needed to improve our understanding of amino acid struc-tures and dynamics. Although a certain number of amino acid crystallographic structures is available in the zwitteri-onic form, systematic studies investigating the pH-dependence of amino acid structural properties, as well as the influence of coordinating ions and environment, would be beneficial. Such fundamental studies on individual amino ac-ids are basic pieces needed to later address the complex vi-brational properties of proteins.
ACKNOWLEDGMENTS
The authors acknowledge for financial and computa-tional support from the Université de Strasbourg, the Agence Nationale de la Recherche 共ANR, chaire d’excellence兲, the Centre National de la Recherche Scientifique 共CNRS兲, the Ministère de la Recherche, the Institut du Développement et des Ressources en Informatique Scientifique 共IDRIS兲, and the Centre Informatique National de l’Enseignement Supérieur 共CINES兲.
1E. Heintz, Compt. Rend. Hebd. Séances Acad. Sci. 201, 1478 共1935兲. 2J. Bandekar, L. Genzel, F. Kremer, and L. Santo,Spectrochim. Acta, Part
A 39, 357 共1983兲.
3L. Genzel, F. Kremer, A. Poglitsch, and G. Bechtold, in Coherent
Exci-tations in Biological Systems, edited by H. Fröhlich and F. Kremer 共Springer, Berlin, Heidelberg, 1983兲, pp. 58–70.
4L. Genzel, L. Santo, and S. C. Shen, in Spectroscopy of Biological
Mol-ecules, edited by C. Sandorfy and T. Theophanides 共Reidel, Boston, 1984兲, pp. 609–619.
5P. F. Façanha Filho, P. T. C. Freire, K. C. V. Lima, J. Mendes Filho, F. E.
A. Melo, and P. S. Pizani,Braz. J. Phys. 38, 131 共2008兲.
6F. M. Almeida, P. T. C. Freire, R. J. C. Lima, C. M. R. Remédios, J.
Mendes Filho, and F. E. A Melo,J. Raman Spectrosc. 37, 1296 共2006兲.
7J. A. Lima, Jr., P. T. C. Freire, R. J. C. Lima, A. J. D. Moreno, J. Mendes
Filho, and F. E. A. Melo,J. Raman Spectrosc. 36, 1076 共2005兲.
8A. Matei, N. Drichko, B. Gompf, and M. Dressel,Chem. Phys. 316, 61
共2005兲.
9C. Murli, S. Thomas, S. Venkateswaran, and S. M. Sharman,Physica B
364, 233 共2005兲.
10M. Rozenberg, G. Shoham, I. Reva, and R. Fausto,Spectrochim. Acta,
Part A 59, 3253 共2003兲.
11A. M. R. Teixeira, P. T. C. Freire, A. J. D. Moreno, J. M. Sasaki, A. P.
Ayala, J. Mendes Filho, and F. E. A. Melo,Solid State Commun. 116, 405 共2000兲.
12G. Dovbeshko and L. Berezhinsky,J. Mol. Struct. 450, 121 共1998兲. 13S. C. Shen, L. Santo, and L. Genzel,Int. J. Infrared Millim. Waves 28,
595 共2007兲.
14A. Barth,Prog. Biophys. Mol. Biol. 74, 141 共2000兲.
15N. Derbel, B. Hernández, F. Pflüger, J. Liquier, F. Geinguenaud, N.
Jaïdane, Z. B. Lakhdar, and M. Ghomi,J. Phys. Chem. B 111, 1470 共2007兲.
16S. Kumar, A. K. Rai, V. B. Singh, and S. B. Rai,Spectrochim. Acta, Part
A 61, 2741 共2005兲.
17S. Kumar, A. K. Rai, S. B. Rai, D. K. Rai, A. N. Singh, and V. B. Singh,
J. Mol. Struct. 791, 23 共2006兲.
18M. Wolpert and P. Hellwig,Spectrochim. Acta, Part A 64, 987 共2006兲. 19A. Kamariotis, O. V. Boyarkin, S. R. Mercier, R. D. Beck, M. F. Bush, E.
R. Williams, and T. R. Rizzo,J. Am. Chem. Soc. 128, 905 共2006兲.
20R. Ramaekers, J. Pajak, B. Lambie, and G. Maes,J. Chem. Phys. 120,
4182 共2004兲.
21S. G. Stepanian,,J. Phys. Chem. A 102, 1041 共1998兲.
22S. G. Stepanian, I. D. Reva, E. D. Radchenko, and L. Adamowicz,J.
Phys. Chem. A 102, 4623 共1998兲.
23S. G. Stepanian, I. D. Reva, E. D. Radchenko, and L. Adamowicz,J.
Phys. Chem. A 103, 4404 共1999兲.
24L. M. Miller, A. J. Pedraza, and M. R. Chance,Biochemistry 36, 12199
共1997兲.
25S. Dörr, U. Schade, P. Hellwig, and M. Ortolani,J. Phys. Chem. B 111,
14418 共2007兲.
26G. Albrecht and R. B. Corey,J. Am. Chem. Soc. 61, 1087 共1939兲. 27S. Xu, M. J. Nilles, and K. H. Bowen, Jr.,J. Chem. Phys. 119, 10696
共2003兲.
28M. S. Lehmann, T. F. Koetzle, and W. C. Hamilton,J. Am. Chem. Soc.
94, 2657 共1972兲.
29I. M. Degtyarenko, K. J. Jalkanen, A. A. Gurtovenko, and R. M.
Niem-inen,J. Phys. Chem. B 111, 4227 共2007兲.
30P. K. Smith, A. C. Taylor, and E. R. B. Smith, J. Biol. Chem. 122, 109
共1937兲.
31Y. Ding and K. Krogh-Jespersen,Chem. Phys. Lett. 199, 261 共1992兲. 32F. R. Tortonda, J. L. Pascual-Ahuir, E. Silla, I. Tuñón, and F. J. Ramírez,
J. Chem. Phys. 109, 592 共1998兲.
33L. Gontrani, B. Mennucci, and J. Tomasi, J. Mol. Struct. 500, 113
共2000兲.
34A. Chaudhari and S.-L. Lee,Chem. Phys. 310, 281 共2005兲.
35D.-S. Ahn, S.-W. Park, I.-S. Jeon, M.-K. Lee, N.-H. Kim, Y.-H. Han, and
S. Lee,J. Phys. Chem. B 107, 14109 共2003兲.
36A. R. Garcia, R. Brito de Barros, J. P. Lourenço, and L. M. Ilharco,J.
Phys. Chem. A 112, 8280 共2008兲.
37H. J. Himmler and H. H. Eysel,Spectrochim. Acta, Part A 45, 1077
共1989兲.
38P. U. Jepsen and S. J. Clark,Chem. Phys. Lett. 442, 275 共2007兲. 39B. Z. Chowdhry, T. J. Dines, S. Jabeen, and R. Withnall,J. Phys. Chem.
A 112, 10333 共2008兲.
40R. W. Williams, S. S. Schlücker, and B. S. Hudson,Chem. Phys. 343, 1
共2008兲.
41F. H. Allen,Acta Crystallogr., Sect. B: Struct. Sci. 58, 380 共2002兲.
42Y. Iitaka,Acta Crystallogr. 13, 35 共1960兲. 43R. E. Marsh,Acta Crystallogr. 11, 654 共1958兲.
44H. J. Simpson, Jr. and R. E. Marsh,Acta Crystallogr. 20, 550 共1966兲. 45B. Dalhus and C. H. Görbitz,Acta Chem. Scand. 50, 544 共1996兲. 46M. Coll, X. Solans, M. Font-Altaba, and J. A. Subirana,Acta
Crystal-logr., Sect. C: Cryst. Struct. Commun. 42, 599 共1986兲.
47C. H. Görbitz and B. Dalhus,Acta Crystallogr., Sect. C: Cryst. Struct.
Commun. 52, 1464 共1996兲.
48B. di Blasio, V. Pavone, and C. Pedone, Cryst. Struct. Commun. 6, 745
共1977兲.
49G. Müller, G.-M. Maier, and M. Lutz, Inorg. Chim. Acta 218, 121
共1994兲.
50S. J. Clark, M. D. Segall, C. J. Pickard, P. J. Hasnip, M. I. J. Probert, K.
Refson, and M. C. Payne,Z. Kristallogr. 220, 567 共2005兲.
51J. P. Perdew, J. A. Chevary, S. H. Vosko, K. A. Jackson, M. R. Pederson,
D. J. Singh, and C. Fiolhais,Phys. Rev. B 46, 6671 共1992兲.
52H. J. Monkhorst and J. D. Pack,Phys. Rev. B 13, 5188 共1976兲. 53K. Refson, P. R. Tulip, and S. J. Clark,Phys. Rev. B 73, 155114 共2006兲. 54P. Pulay, G. Fogarasi, F. Pang, and J. E. Boggs,J. Am. Chem. Soc.101,
2550 共1979兲.
55K. Kuczera and J. Wiorkiewicz-Kuczera,
MOLVIB, a program for analysis
of molecular vibrational spectra, 1992.
56A. A. Pradhan and J. H. Vera,Fluid Phase Equilib. 152, 121 共1998兲. 57G. Zundel,Methods Enzymol. 127, 439 共1986兲.
58See supplementary material at http://dx.doi.org/10.1063/1.3356027 for
geometry optimized structures of the different systems studied 共Fig. S1兲, crystal parameters 共Table S1兲, symmetrized Pulay coordinates 共Tables S2–S8兲, calculated frequencies, intensities, irreducible group representa-tion, and complete PEDs 共Tables S9–S16兲, far infrared experimental bands and assignments to group of calculated normal modes with major contributions to the PED 共Tables S17–S24兲, detailed comparison between experimental and annotated calculated spectra 共Figs. S2–S9兲, results from hydrogen-deuterium exchange 共Fig. S10兲, temperature effects 共Fig. S11兲, and counterion exchange 共Fig. S12兲 experiments on glycine.
59G. B. Chernobai, Y. A. Chesalov, E. B. Burgina, T. N. Drebushchak, and
E. V. Boldyreva,J. Struct. Chem. 48, 332 共2007兲.
60S. V. Goryainov, E. N. Kolesnik, and E. Boldyreva, Physica B 357, 340
共2005兲.
61A. W. Herlinger, S. L. Wenhold, and T. Veach Long II,J. Am. Chem. Soc.
92, 6474 共1970兲.
62W. R. Feairheller and J. T. Miller, Jr.,Appl. Spectrosc. 25, 175 共1971兲. 63B. B. Owen,J. Am. Chem. Soc. 56, 24 共1934兲.
64R. Rungsawang, Y. Ueno, I. Tomita, and K. Ajito,J. Phys. Chem. B 110,
21259 共2006兲.
65C. H. Wang and R. D. Storms,J. Chem. Phys. 55, 3291 共1971兲. 66M. Diem, P. L. Polavarapu, M. Oboodi, and L. A. Nafie,J. Am. Chem.
Soc. 104, 3329 共1982兲.
67M. Barthes, A. F. Vik, A. Spire, H. N. Bordallo, and J. Eckert,J. Phys.
Chem. A 106, 5230 共2002兲.
68A. Pawlukojc, L. Bobrowicz, and I. Natkaniec,Spectrochim. Acta, Part A
51, 303 共1995兲.
69A. Pawlukojc, K. Bajdor, J. C. Dobrowolski, J. Leciejewicz, and I.
Nat-kaniec,Spectrochim. Acta, Part A 53, 927 共1997兲.
70M. R. Johnson, K. Parlinski, I. Natkaniec, and B. S. Hudson, Chem.