HAL Id: hal-00089731
https://hal-insu.archives-ouvertes.fr/hal-00089731
Submitted on 23 Aug 2006
HAL is a multi-disciplinary open access archive for the deposit and dissemination of sci-entific research documents, whether they are pub-lished or not. The documents may come from teaching and research institutions in France or abroad, or from public or private research centers.
L’archive ouverte pluridisciplinaire HAL, est destinée au dépôt et à la diffusion de documents scientifiques de niveau recherche, publiés ou non, émanant des établissements d’enseignement et de recherche français ou étrangers, des laboratoires publics ou privés.
The effect of water and fO2 on the ferric–ferrous ratio of
silicic melts
Fabrice Gaillard, Bruno Scaillet, Michel Pichavant, Jean-Michel Bény
To cite this version:
Fabrice Gaillard, Bruno Scaillet, Michel Pichavant, Jean-Michel Bény. The effect of water and fO2 on the ferric–ferrous ratio of silicic melts. Chemical Geology, Elsevier, 2001, 174, pp.255-273. �10.1016/S0009-2541(00)00319-3�. �hal-00089731�
The effect of water and fO
2on the ferric–ferrous ratio of
silicic melts
Fabrice Gaillard, Bruno Scaillet, Michel Pichavant and Jean-Michel Bény
CRSCM-CNRS, 1A rue de la Férollerie, Orleans Cedex 02 45071, France – remplacé par UMR6113 - ISTO
Abstract
New experiments on the effect of dissolved water on the ferric–ferrous ratio of silicic melts
have been performed at 200 MPa, between 800°C and 1000°C and for fO2 between
NNO−1.35 and NNO+6.6. Water-saturated conditions were investigated. Compositions studied include six metaluminous synthetic melts, with FeOtot progressively increasing from
0.47 to 4.25 wt.%, two natural obsidian glasses (one peraluminous and the other peralkaline) and a synthetic rhyolitic glass having the composition of the matrix glass of the June 15, 1991 Pinatubo dacite. Ferrous iron was analyzed by titration and FeOtot by electron microprobe.
Variation of quench rate was found to have no detectable effect on the ferric–ferrous ratio of the hydrous silicic melts investigated. At NNO, no dependence of the ferric–ferrous ratio with temperature is observed. At fO2<NNO+1, metaluminous melts have ferric–ferrous ratios
higher than calculated from the Kress and Carmichael (KC) (Kress, V.C., Carmichael, I.S.E., 1991. The compressibility of silicate liquids containing Fe2O3 and the effect of composition:
temperature: oxygen fugacity and pressure on their redox states. Contrib. Mineral. Petrol. 108, 82–92.) empirical equation (i.e., water has an oxidizing effect relative to KC), whereas at
fO2>NNO+1, the experimental ferric–ferrous ratios are equal or lower than calculated. The
peralkaline samples show the same type of behaviour. A non-linear relationship between
XFe2O3/XFeO and fO2 implies that a term for dissolved water must be added to the KC equation
if it is to be applied to the calculation of ferric–ferrous ratios of hydrous silicic melts. Above NNO+1, the ferric–ferrous ratio is essentially controlled by the anhydrous melt composition and fO2. However, differences exist between measured and calculated ferric–ferrous ratios of
silicic melts that are not all attributable to the effect of dissolved water. Additional work is needed to describe more precisely the dependence of the ferric–ferrous ratio on anhydrous melt composition. The oxidizing effect of water is restricted to relatively reduced magmatic liquids. In oxidized calk-alkaline magma series, the presence of dissolved water will not largely influence melt ferric–ferrous ratios.
1. Introduction
Knowledge of the oxidation state of iron in silicate melts is a key for understanding the physical and the chemical evolution of magmas during differentiation (Osborn and Carmichael). The ferric–ferrous ratio plays an important role on melts properties such as density or viscosity (Lange; Dingwell and Dingwell). It also controls the appearance of iron-bearing oxides and ferromagnesian silicates, and the chemical composition of the coexisting melt. From a general point of view, the ferric–ferrous ratio of silicate melts is related to oxygen fugacity (fO2) by the following equilibrium:
K=aFe2O3/(aFeO)2(fO2)1/2.
Therefore, knowledge of the ferric–ferrous ratio of a given silicate melt should enable fO2 to
be calculated. However, several authors have pointed out that, in addition to fO2, the ferric–
ferrous ratio is dependent on the composition of the melt (e.g., Sack; Thornber and Dickenson). Empirical relations have been proposed to describe the effects of melt composition, fO2, temperature and pressure on the ferric–ferrous ratio of silicate melts (e.g.,
Sack; Kilinc; Mysen; Borisov and Kress; hereafter designated as KC). These equations have the following general form ( Sack and Kilinc; KC):
ln(XFe2O3/XFeO)=alnfO2+b/T+c+∑diXi+f(T,P),
where a, b, c are empirical constants, and Xi is the mole fraction of K2O, Na2O, Al2O3, FeO,
CaO in the melt (KC). The ∑diXi term expresses the compositional dependence of the ferric–
ferrous ratio. For instance, it is well known that, for a given fO2, peraluminous melts display
lower Fe3+/Fe2+ ratios than their peralkaline equivalents (Douglas; Dickenson and Dickenson). However, the compositional dependence of the ferric–ferrous ratio is presently established on the basis of experimental data for dry melts. Water is a major component of most natural magmas, with concentrations commonly exceeding 1 wt.% and reaching, in some cases, 7 wt.% (see Johnson et al. 1994), which corresponds to a mole fraction of up to 0.2 for a rhyolitic melt. Water strongly affects the physical and chemical properties of silicate melts and it might be anticipated that water also has an effect on melt Fe3+/Fe2+ ratios. Carmichael
(1991) found systematic differences between fO2 calculated from Eq. (3) and from Fe–Ti
oxides for several intermediate to silicic glassy lavas, and discussed the possibility that water dissolved in the lavas influences the ferric–ferrous calibration.
To date, only two experimental studies have investigated the effect of water on the oxidation state of iron in silicate melts (Moore and Baker). Moore et al. (1995) have carried out experiments under both H2O-saturated and dry conditions on three natural compositions (a
minette, an andesite and a peralkaline rhyolite). A total of 22 H2O-saturated experiments were
performed in the pressure range 50–200 MPa, between 950°C and 1130°C, and under oxidizing conditions (about 1–2log units above the Ni–NiO solid buffer, i.e., NNO+1–2). Dissolved water has no significant effect on the ferric–ferrous ratio under the experimental
conditions investigated by Moore et al. (1995). Baker and Rutherford (1996) presented data from 43 hydrous experiments, performed between 10 and 200 MPa (mostly at 200 MPa),
725°C and 1140°C and at fO2 ranging from NNO up to MNO (i.e., the MnO–Mn3O4 solid
buffer, equivalent to about NNO+2.5). Two rhyolitic compositions, one metaluminous and the other peralkaline, were investigated. In contrast to Moore et al. (1995), Baker and Rutherford (1996) observed that the addition of water increases the Fe3+/Fe2+ ratio of silicate melts in certain regions of the P–T–fO2 space. For metaluminous melts, this oxidizing effect of water
is well marked at NNO and for temperatures above 900°C, whereas at NNO+2.5 or at low temperatures, water has no effect. For peralkaline melts, an oxidizing effect of water was found both at NNO and NNO+2.5 (Baker and Rutherford, 1996), in contrast with the results of Moore et al. (1995) for similar melt compositions. It is worth emphasizing that the effect of water on the ferric–ferrous ratio has been determined to date for a narrow range of fO2, near
the oxidizing end of the spectrum of redox conditions for natural magmas (NNO to NNO+2.5; Moore and Baker), and that it remains unknown for moderately to strongly reducing
conditions (fO2<NNO). Important classes of melt compositions, such as peraluminous
compositions, are presently excluded from the available database for hydrous melts.
In this study, we report new experimental determinations of the ferric–ferrous ratio of hydrous
(H2O-saturated) silicic melts at 800°C, 930°C and 1000°C, and 200 MPa. In contrast to
previous studies (Moore and Baker), a wide range of fO2 conditions was investigated (from
NNO−1.35 to NNO+6.6). Both synthetic and natural melt compositions have been studied. The data enable the effects of iron concentration and A/CNK see Table 1 on the ferric–ferrous ratio of hydrous silicic liquids to be evaluated.
2. Starting products
Nine rhyolitic melt compositions were investigated (Table 1). A series of six metaluminous synthetic melt compositions in the system Si–Al–Na–K–H–Fe–O was prepared by adding increasing amounts of iron (from 0.47 to 4.25 FeOtot, Table 1) to the composition of the 200
MPa H2O-saturated minimum of the haplogranite system (Holtz et al., 1992). The other three
compositions studied are: a peraluminous obsidian glass from Macusani, Peru (Pichavant et al., 1987), a peralkaline obsidian from Ascension island (Harris, 1983), and a synthetic rhyolitic glass having the composition of the matrix glass of the June 15, 1991 Pinatubo dacite (Scaillet and Evans, 1999).
All synthetic compositions were prepared using a standard gel method (e.g., Pichavant, 1987). The fired gels were melted at 1400°C, 1 bar in air (fO2=0.2 bar). The resulting glasses, as well
as the two natural obsidians, were then ground in an agate mortar down to a mesh size of 20 μm. These glass powders were used as starting products in all the experiments. The capsules consisted of 150–200 mg of powdered starting material plus roughly 8 wt.% of distilled and
demineralized H2O loaded in Au tubes (25 mm length, ID: 5 mm, OD: 5.4 mm), which were
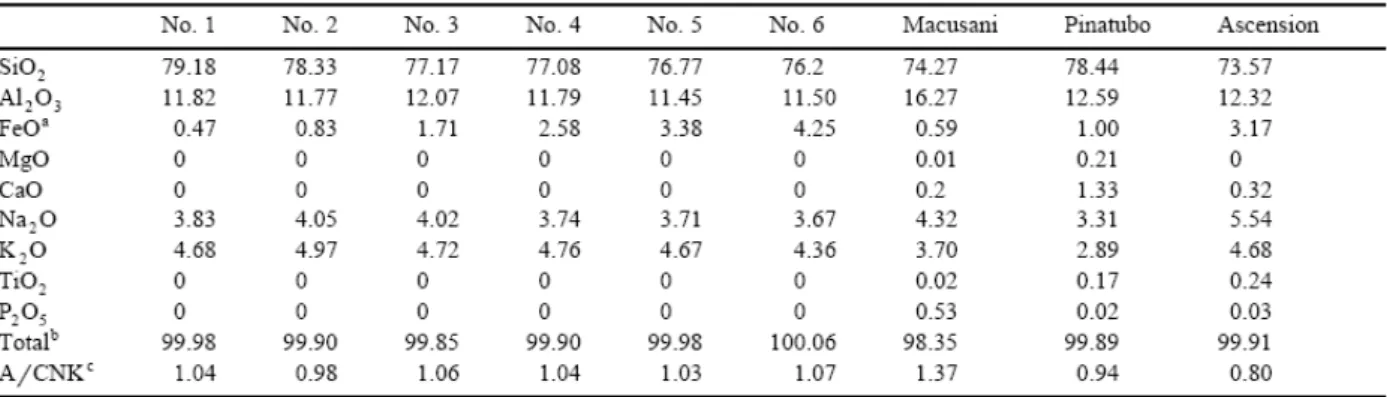
Table 1. Electron microprobe compositions of starting glasses
3. Experimental methods
Two internally heated pressure vessels (IHPVs) operating vertically were used in all experiments at 930°C and 1000°C. Temperature was controlled by means of two to three sheathed Ni–Cr thermocouples calibrated against the melting point of NaCl at 1 bar. The hot spot zone is 4–6 cm long and the temperature variation across the capsules never exceeded 2°C. Temperature fluctuation during the run was within 1°C of the setpoint. Overall, the maximum error on temperature is ±5°C. The vessels were pressurized either with pure Ar or with Ar–H2 mixtures, depending on the desired redox conditions (see Scaillet et al., 1995 for
additional details). Total pressure was monitored with transducers calibrated against an Heise Bourdon tube gauge and is known to within 2 MPa. Redox conditions were imposed and controlled by the fH2 prevailing in the pressure vessel. For fO2 below NNO+2 (runs 2–4,
Table 2), different Ar/H2 ratios were used to generate different fH2 values, which were
continuously monitored using a modified semi-permeable H2 membrane (Scaillet et al., 1992)
connected to a small pressure transducer calibrated against a Protais tube gauge. The uncertainty in H2 pressure reading is about 0.001 MPa for fH2=0.1 MPa, and 0.01 MPa for
fH2=5 MPa. For fO2 higher than NNO+2 (run 1, Table 2), experiments used pure Ar as the
pressurizing medium, and the redox conditions were fixed by the intrinsic fH2 of the pressure
vessels. In all but one experiment (run 3, Table 2), fH2 was also measured with either Ni–Pd–
O or Co–Pd–O solid sensors following the procedures of Taylor et al. (1992). The sensor material consisted of either Ni–Pd–NiO (fO2>NNO) or Co–Pd–CoO (fO2>Co–CoO or CCO
buffer) powdered mixtures loaded with distilled and deionized water in Pt capsules (length: 25
mm, ID: 2.5 mm; OD: 2.9 mm) lined with ZrO2 powder. After the experiments, the
composition of the metallic alloy was determined by electron microprobe, then the fO2 was
calculated from the empirical regression of Pownceby and O'Neill (1994) and finally, the fH2
computed from the water dissociation equilibrium (see below). The fH2 measured with the H2
membrane agreed to within less than 1% with that given by the sensor, in agreement with previous work (Scaillet and Evans, 1999). Experiments were ended by switching off the power supply which resulted in quench rates of about 1–3°C/s for the first 300°C. In these experiments, quenching was not isobaric and pressure dropped by about 30 MPa during the first 300°C.
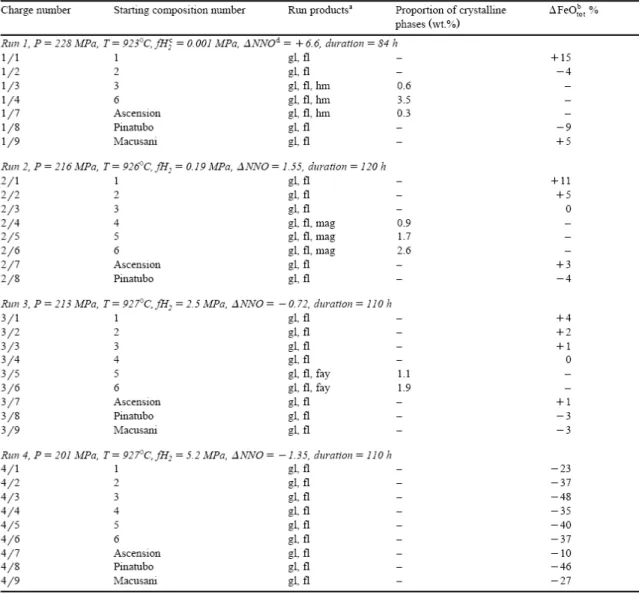
Table 2. Experimental conditions, run products and phase proportions
In order to test for potential quench effects on melt Fe3+/Fe2+ ratios, we performed a number
of test experiments both at 1000°C and 800°C. At 1000°C, the IHPV was fitted with a drop quench device modified after Roux and Lefèvre (1992) (see also Holloway et al., 1992), allowing quench rates of the order of 300°C/s. We used two compositions: Ascension and the synthetic metaluminous composition with 1.71 wt.% FeOtot (no. 3, Table 1). Because of the
limited room available in the pressure vessel when fitted with the rapid-quench device, fH2
and fO2 were determined from the sensor technique (Co–Pd–O) only. Four capsules (two for
each composition) were run together at 1000°C, 200 MPa for 4 days, then quenched under different rates. Two capsules (one for each composition) were drop-quenched by switching on the power supply on the hanging Pt wire (see Roux and Lefèvre, 1992), while the two other capsules remained attached in the hot spot zone and were quenched under normal rates. This procedure ensures that any difference in Fe3+/Fe2+ ratios can be interpreted unambiguously as due to different quench rates. At 800°C, externally heated hydrothermal pressure vessels (e.g., Pichavant, 1987) were used. Different quench rates were imposed by performing either a drop
quench of the capsule (rapid quench) or by leaving the vessel to cool in air (slow quench). In these experiments, redox conditions were controlled by the double capsule oxygen buffer technique, with either NNO or CCO buffer assemblages. Two compositions (Ascension and Pinatubo, Table 1) were tested.
All experiments were performed with a small amount of excess water and are considered water-saturated. Although the proportion of H2 present in the fluid phase increases along with
decreasing fO2 and reaches values up to the mole percent level in the most reduced
experiments (e.g., 1.2 mol% in run 4, Table 2), a pure water fluid phase has been assumed. Therefore, fH2O equals the fugacity of pure water at P and T. Oxygen fugacity is calculated
from the water dissociation equilibrium:
fO2=(KwfH2O/fH2)2,
where fH2O is taken from Burnham et al. (1969), fH2 is experimentally measured (with
membrane or sensor, see above), and Kw is taken from Robie et al. (1978).
Most experiments were carried out at 930°C. A few others were performed at 800°C and 1000°C (tests of the effect of quench rate on ferric–ferrous ratios). Pressure was kept constant at 210±2 MPa. The choice of 930°C as the main experimental temperature was guided by several practical reasons. First, it allows to use Au capsules as containers and thus reduces the iron loss problem. Second, it is a temperature high enough to prevent crystallisation of water-saturated rhyolitic melts. Third, 930°C is within the temperature range examined by Baker and Rutherford (1996) and only slightly lower than that of Moore et al. (1995), which facilitates comparison between the different studies. Finally, this is a temperature meaningful for silicic magmas (e.g., Martel et al. 1998), which ensures that our results are applicable to natural conditions without requiring extrapolation far outside the calibrated range. Run durations varied between 4 and 6 days, similar to previous studies (Baker and Rutherford,
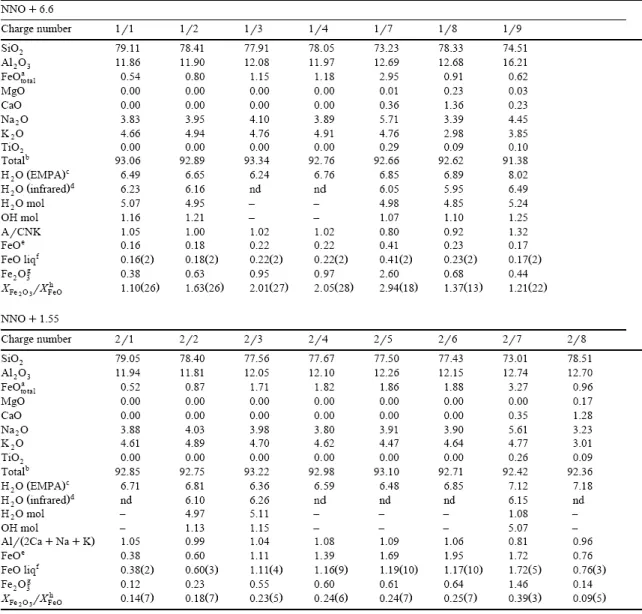
1996). At 930°C, four fO2 values were investigated: NNO+6.6, NNO+1.55, NNO−0.72,
NNO−1.35, at 800°C, two fO2 values: NNO, NNO−1.6 and at 1000°C, one fO2 value: NNO.
Reversals have not been performed in this study (but see Baker and Rutherford, 1996). Initial glass/melt Fe3+/Fe2+ ratios are either high (synthetic glasses prepared in air) or low (Macusani
glass; Pichavant et al., 1987) so that equilibrium Fe3+/Fe2+ ratios were attained from either sides depending on imposed fO2. A time series study at 200 MPa and 800°C on the Pinatubo
and Ascension compositions shows that redox equilibrium conditions are attained in 15 and 3 h, respectively, and both for low and high initial Fe3+/Fe2+ ratios (Gaillard et al., 1998).
4. Analytical techniques
After opening of the capsule, a glass fragment of about 20 mg was mounted in epoxy for electron microprobe analysis (EMPA). The remaining part of the sample was used for ferrous iron titration and infrared spectroscopy analysis.
4.1. EMPA
Glasses were analyzed for major elements with either a CAMEBAX or an SX50 electron microprobe from the BRGM-CNRS-UO Laboratories, Orléans. Operating conditions were: 15
kV acceleration voltage, 6 nA sample current, 10 s counting time on peak, beam size 10– 25×10–25 μm2 to minimize the migration of alkali (e.g., Pichavant and Devine). A set of hydrous rhyolitic glasses, whose water contents (2.42–6.38 wt.% H2O) were determined by
pyrolysis and subsequent Karl–Fischer titration (Behrens et al., 1996), was used both to correct the concentrations of alkalis (Pichavant, 1987) and to calibrate the difference to 100% of the glass EMPA analyses (Devine et al., 1995), thus providing a first estimate of the total water content. Mineral phases present in some of the glasses were analyzed under the same operating conditions except for the beam size, which was reduced to 1–2 μm. Analytical errors are: 1% (SiO2, Al2O3, CaO), 3% (FeO, MgO, TiO2), 5% (MnO, Na2O, K2O).
4.2. Ferrous iron determination
The ferrous iron content of the run products was determined by colorimetric microtitration following the method of Thornber et al. (1980) and also used by Baker and Rutherford (1996). Glass chips weighting 50–80 mg, ground under acetone down to 10–20 μm, were used for each analysis. Glasses were first dissolved for 3 min in boiling HF and H2SO4, and ferrous
iron in solution was titrated with K2Cr2O7. Our method of ferrous iron titration included, with
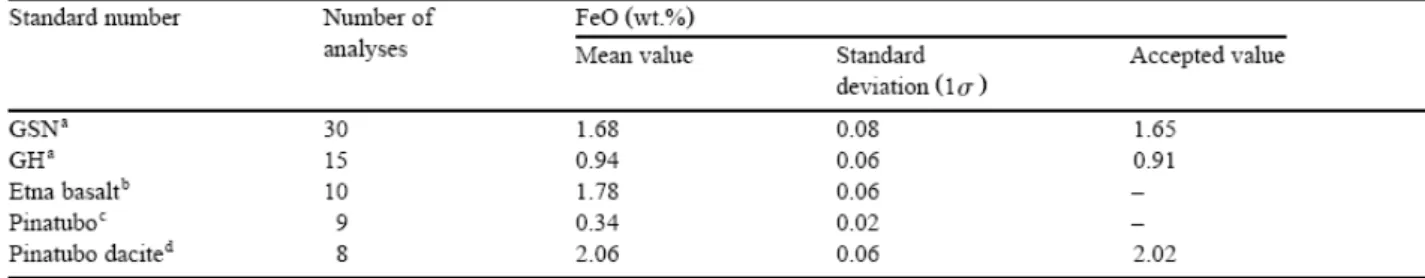
every set of unknown, the analysis of several internal standards. These included two granite international standards (Govindaraju, 1994) and a powdered sample of the June 1991 dacite from Mt. Pinatubo (FeO concentration from Bernard et al., 1991). In all cases, our results were within 1σ of the accepted values (Table 4). Other glass standards analyzed to test for the reproducibility of the ferrous iron titration method included the Pinatubo starting glass (1 wt.% FeOtot, Table 1) and an alkali basalt from Etna (10 wt.% FeOtot). Results of about 10
analyses carried out on each of these glasses show a maximum standard deviation (1σ) of 0.06 wt.% FeO (Table 3), slightly lower than that associated with the granitic rock powders, presumably because of the greater homogeneity of the glasses.
Several glasses were analysed in duplicate or triplicate to check for reproducibility and homogeneity of the iron redox ratio. For the 930°C charges, glasses with FeOtot<1 wt.% were
systematically duplicated. Glasses used to establish the effect of quench rate were also systematically duplicated/triplicated, depending on the mass of sample available. When multiple analyses are available, the mean of the titrations is given (Table 3 and Table 5). The standard deviations on glass analyses are, as expected, dependent on the ferrous iron content. For the Pinatubo glass standard (ferrous IRON=0.34 wt.%), the standard deviation is equal to 0.02 wt.% (Table 3) and analytical uncertainties of ±0.02 wt.% have been attributed to glasses with FeO<0.5 wt.% (Table 5). Differences between duplicate analyses for this group of samples never exceeded 0.01 wt.%, i.e., less than the attributed uncertainty. Glasses with 0.5<FeO<1 wt.% have differences between duplicate analyses of ±0.03 wt.% and this value was taken as the analytical uncertainty (Table 3 and Table 5). For glasses with higher FeO concentrations, analytical uncertainties were calculated from standard deviations on standard glasses from Table 4, and are given on Table 3 (differences between multiple analyses always<standard deviations) and Table 5.
Table 3. Effect of the quench rate on the speciation of iron and water
nd: not determined.
Fe2O3 (wt.%) was determined using the following equation :
where FeOtot is the total iron content, determined by EMPA (average of six to eight analyses
per glass). In this study, the redox state of iron in the glass is represented by the XFe2O3/XFeO
ratio, with concentrations of FeO and Fe2O3 in mole fractions. The error on this ratio is
calculated by propagating, using standard techniques, the independent analytical uncertainties on ferrous iron (titration) and total iron (EMPA). Results are given on Table 5.
4.3. Near-infrared spectroscopy (Fourier transform infrared spectroscopy, FTIR)
Water concentration and water speciation were determined in selected glasses by FTIR. Analyses were performed on doubly polished glass plates using a Nicolet 760 Magna FTIR spectrometer. Spectra were taken with 73 scans, resolution of 1.8 cm−1, gain of 32, a CaF2
beamsplitter, a visible light, and a liquid N2 cooled MCT/A detector which allows to
investigate in the field 11700–1200 cm−1. The concentrations of OH and H2O species were
determined by the peak heights of the absorption bands at 4500 and 5200 cm−1, respectively, using molar absorptivities from Newman et al. (1986) for rhyolitic compositions. Because of the presence of water-bearing bubbles due to water saturation, glass densities cannot be measured. Therefore, these were calculated using the model of Knoche et al. (1995) for all oxides except FeO, Fe2O3 (Lange and Carmichael, 1990), and H2O (12 cm3/mol; Holtz et al.,
1995). The thickness of each sample was measured with an optical microscope equipped with an automated X–Y stage enabling measurements to within ±1 μm.
5. Results
5.1. General
Experimental run conditions and results are given on Table 2 for 930°C and on Table 3 for 1000°C and 800°C. At these last temperatures, run products consist of glasses plus some bubbles. Only data on iron and water species concentrations are reported (Table 3) since the glasses have compositions identical to the starting products. Experimental results at 930°C are detailed on Table 5. Some of the experiments are affected by Fe loss and partial crystallization of Fe oxides and fayalite, and glass compositions may deviate from the starting compositions (Table 5).
Iron loss to the Au capsule is strongly dependent on fO2. The only experiment where iron loss
is systematic is that performed at 930°C, NNO−1.35 (the most reduced experiment at this temperature, Table 2). The synthetic compositions are affected by Fe losses of 40% on average, and the natural by losses of 10–30% (Table 2). None of the other experiments shows significant Fe losses, including the moderately reducing run 3 (NNO−0.72, Table 2). The main practical consequence of Fe loss in run 4 (NNO−1.35) is that experimental glasses have FeOtot contents of only half the starting compositions (Fig. 2). Formation of the Au–Fe alloy
produces oxygen by reduction of FeO and Fe2O3 from the melt. This oxygen is consumed by
reaction with H2 to generate a small amount of additional water at the capsule–melt interface.
Overall, this does not change fO2 since fH2 is buffered and H2O is in excess in all
experiments. Electron microprobe traverses of charges from run 4 show homogeneous Fe concentrations in both Au capsules and glasses, suggesting that bulk equilibrium has been attained between metal and melt and, therefore, that the iron redox equilibrium (Eq. (1) is also attained.
Run products were examined optically to check for the presence of crystals. No quench phases were detected. Crystals encountered at 930°C include haematite at NNO+6.6, magnetite at NNO+1.55 and fayalite at NNO−0.72 (Table 2). These phases appear in the most iron-rich synthetic metaluminous compositions and also in the Ascension composition at NNO+6.6. When present, they have euhedral shapes and are homogeneously distributed in the glasses. EMPA of magnetite shows that it contains minor amounts of Al2O3 (less than 1.5
wt.%). Haematite crystals could not be satisfactorily analysed by electron microprobe because of their small size but were identified on the basis of their Raman spectra. Fayalite has end-member composition. The proportions of crystals present, calculated by mass balance, never exceed 3.5 wt.% (Table 2). All glasses are optically homogeneous and, when multiple analyses are available on different chips from the same glass, there is no indication for heterogeneity in XFe2O3/XFeO.
The crystallization of Fe oxides and Fe silicates buffers the FeOtot concentration of the melt
for given T–fO2 conditions. Increasing the bulk FeOtot concentration of the charges only raises
the proportion of crystals present without changing the FeOtot concentration of the melt (Table
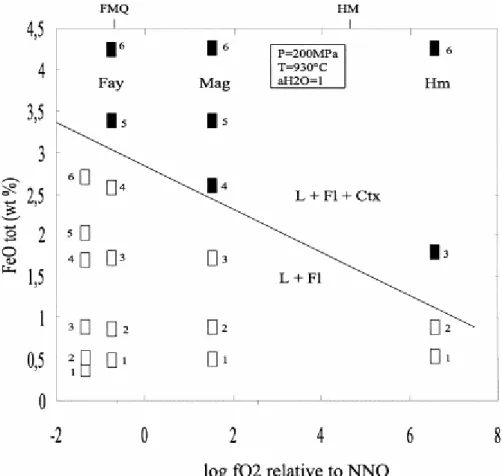
2, Fig. 1). Saturation of metaluminous silicic melts with Fe oxides or fayalite is a strong function of fO2 (Fig. 1). At NNO+1, the solubility of FeOtot in a water-saturated metaluminous
silicic melt is 1.7 wt.%, and it increases up to 3 wt.% at FMQ. The data suggest that, at
fO2<QFM, metaluminous silicic liquids can dissolve still higher amounts of iron (i.e., >3–4
wt.% FeOtot, Fig. 1). Owing to the iron loss problem encountered at NNO−1.35, saturation of
the melt with fayalite was not encountered at this fO2. Melt compositions from the NNO−1.35
experiment have FeOtot contents lower than those of the NNO−0.72 experiment (Table 5, Fig.
1).
Data on the effect of quench rate on the ferric–ferrous ratio are shown on Table 3. There is no effect of quench rate on the ferric–ferrous ratio whatever the temperature and the melt composition. We thus conclude that varying the quench rate between 300°C/s and 1–3°C/s has no detectable effect on the ferric–ferrous ratio of hydrous silicic melts. In contrast, the water speciation is clearly affected (Table 3). The decoupling of the kinetics of backreaction of water species and XFe2O3/XFeO during quench, as observed here, does not necessarily rules
out a structural interaction between water and iron in the melt (e.g., Baker and Rutherford, 1996).
Fig. 1. Influence of fO2 on saturation of metaluminous silicic melts with respect to Fe oxides (haematite,
magnetite) or fayalite. The plotted Fe concentrations (FeOtot) are the concentrations of the bulk charge, i.e., the
concentrations of the starting glasses except for the most reducing experiment where concentrations in the
experimental glasses are shown, because of Fe loss. The curve represents the solubility of FeOtot in the melt,
constructed from experimental glass compositions in bearing charges (Table 5). Open symbols: crystal-free charges; filled symbols: crystal-bearing charges. Abbreviations: L, silicate melt; Fl, vapour phase; Ctx,
crystals. The fO2 of FMQ, and HM oxygen buffers is calculated for 930°C, 200 MPa. Number adjacent to the
data points refer to the starting composition numbers (Table 1).
The lack of detectable effect of quench rate on XFe2O3/XFeO suggests that the iron redox ratio
re-equilibrates either relatively slowly (in greater than a few minutes) or, alternatively, extremely rapidly (in less than a few seconds) during quench. However, oxidation–reduction cycles performed in situ at 800°C, 200 MPa under water-saturated conditions on the Pinatubo and Ascension compositions (Gaillard et al., 1998) showed that XFe2O3/XFeO re-equilibrates
relatively slowly. For example, after an oxidation from NNO−1.5 to NNO+3 (corresponding to a fH2 drop from 50 to 0 bar), increases of only a few percentages XFe2O3/XFeO were
detected after 20 (Pinatubo) and 5 (Ascension) min, and steady-state XFe2O3/XFeO ratios were
attained after 15 and 3 h, respectively. Therefore, re-equilibrating the iron redox ratio is a relatively slow process for the compositions investigated here (see also Baker and Rutherford, 1996) and the XFe2O3/XFeO ratios measured in both normally and rapidly quenched glasses
reflect the redox state of iron in the melts at high P and T.
5.2. Iron redox ratio
The XFe2O3/XFeO ratio of all melt compositions at 930°C is plotted as a function of FeOtot for
the four fO2 values investigated (Fig. 2). For the few crystal-bearing charges, the ferric–
the contribution of the crystalline phases on the analyzed FeO content (Table 5). They have larger uncertainties due to mass balance calculations errors. The experimental XFe2O3/XFeO
ratios for the series of metaluminous synthetic compositions are compared with values
calculated from KC (Fig. 2). At NNO−1.35, the XFe2O3/XFeO ratio in the metaluminous
synthetic series is constant, irrespective of the FeOtot of the glass. From NNO−0.72 and
above, a positive linear dependence of this ratio with FeOtot is observed, the slope of the
correlation increasing with fO2. For the most oxidizing experiment (NNO+6.6),
approximately the same amount of FeO was measured in all the metaluminous synthetic compositions (Table 5). Thus, the increase of XFe2O3/XFeO with FeOtot essentially results from
the increase of the Fe2O3 species. Extrapolation of the NNO+6.6 trend toward low total iron
contents suggests that a hydrous metaluminous iron-poor (FeOtot<0.5 wt.%) rhyolitic melt will
have a substantial fraction of iron dissolved as FeO even under these extremely oxidizing conditions. The ferric–ferrous ratios of the metaluminous synthetic compositions converge to a common value with decreasing total iron content (Fig. 2), suggesting that, at low FeOtot, the
ferric–ferrous ratio of hydrous metaluminous rhyolitic melts is weakly dependent on fO2.
Experimental XFe2O3/XFeO ratios determined in this study for the metaluminous compositions
are either higher (NNO−1.35, NNO−0.72), subequal (NNO+1.55) or lower (NNO+6.6) than the values retrieved from the KC model. The synthetic Pinatubo composition has
experimental XFe2O3/XFeO ratios in marked contrast and much lower than the other
metaluminous compositions, except at the highest fO2 (Fig. 2). For all fO2 values, the
peralkaline Ascension composition has a XFe2O3/XFeO ratio higher than the series of
metaluminous compositions. In contrast, the peraluminous composition from Macusani is
characterised by values of XFe2O3/XFeO lower than for the metaluminous synthetic
compositions (Pinatubo excepted) and the peralkaline sample. The value for Macusani approaches those for the metaluminous compositions at the highest fO2 (NNO+6.6, Fig. 2).
Fig. 2. The XFe2O3/XFeO ratios of hydrous silicic melts as a function of their total iron content (FeOtot) for the four
fO2 values investigated at 930°C, 200 MPa. Data in Table 5. The line labelled KC shows XFe2O3/XFeO ratios
calculated after Kress and Carmichael (1991) for the synthetic metaluminous compositio1ns. XFe2O3/XFeO ratios
calculated after KC are weakly dependent on total iron content for the range investigated in this study and the KC line has been drawn horizontal. Solid lines are linear fits to the data points for the synthetic metaluminous glasses. Numbers adjacent to the data points refer to the starting composition number (see Table 1). M: Macusani; P: Pinatubo; A: Ascension (see Table 1).
5.3. Effect of temperature
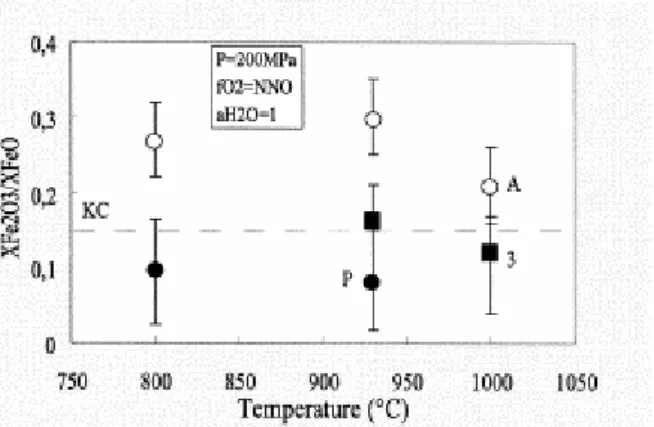
The effect of temperature on the XFe2O3/XFeO ratio is shown on Fig. 3 for a fO2 of NNO (Fig.
3). Data for three compositions, including the peralkaline sample from Ascension, are available in the 800–1000°C range (Table 2 and Table 5). No dependence of the XFe2O3/XFeO
ratios with temperature is observed for the three melts studied. This conclusion agrees with the data of Baker and Rutherford (1996) at NNO+2.5 for a peralkaline rhyolite sample compositionally similar to ours. However, the strong temperature dependence of the ferric– ferrous ratios found by Baker and Rutherford (1996) for their metaluminous composition at NNO is not confirmed in the present study. Therefore, the conclusion (Kress; Carmichael and Carmichael) — that dry silicate liquids equilibrated at different temperatures along a given oxygen buffer (e.g., NNO) have approximately constant XFe2O3/XFeO ratios — can be extended
to hydrous compositions.
Fig. 3. Effect of temperature on the XFe2O3/XFeO ratio at NNO, 200 MPa, H2O-saturated for the metaluminous
synthetic composition no. 3 and the Ascension and Pinatubo compositions. Data in Table 3 and Table 5. The
930°C XFe2O3/XFeO values are interpolated from data at this temperature for NNO−1.15 and NNO+1.29. The
dashed line labelled KC shows XFe2O3/XFeO ratios calculated after Kress and Carmichael (1991) for the Ascension
composition. Abbreviations and notations as in Fig. 2.
5.4. Water contents
The water contents estimated using the by-difference method are all similar for most glasses (average 6.5±0.5 wt.%) except for the Macusani and Ascension compositions since these have high concentrations of elements not analyzed by EMPA. For metaluminous glasses, FTIR measurements suggest that the presence of iron does not largely affect the water solubility in the compositional range explored here. In particular, addition of iron up to 3 wt.% FeOtot to a
metaluminous rhyolite base composition produces little effect on water solubility, whatever the fO2.
6. Discussion
6.1. Effect of water on iron speciation
If equilibrium (1) is written in terms of FeO1.5 rather than Fe2O3 and assuming that both
ferrous and ferric iron mix ideally in silicate melts, we obtain the following equation (see Kress and Carmichael, 1988):
log(XFe2O3/XFeO)=1/4logfO2+logK′+log2,
where
K′=XFeO1.5/(XFeOfO21/4).
Eq. (6) indicates that a linear relationship with a slope of 0.25 should be expected between log(XFe2O3/XFeO) and logfO2 if mixing of the different iron species is ideal (or if the ratio of the
activity coefficients of the iron species is constant). For dry silicate melts, values of log(XFe2O3/XFeO) calculated using Eq. (3) yield a linear relation with a slope of 0.2, suggesting
non-ideal mixing behaviour which has been attributed to partial clustering of ferrous and ferric iron (Kress and Carmichael), in agreement with spectroscopic data (Virgo and Mysen, 1985).
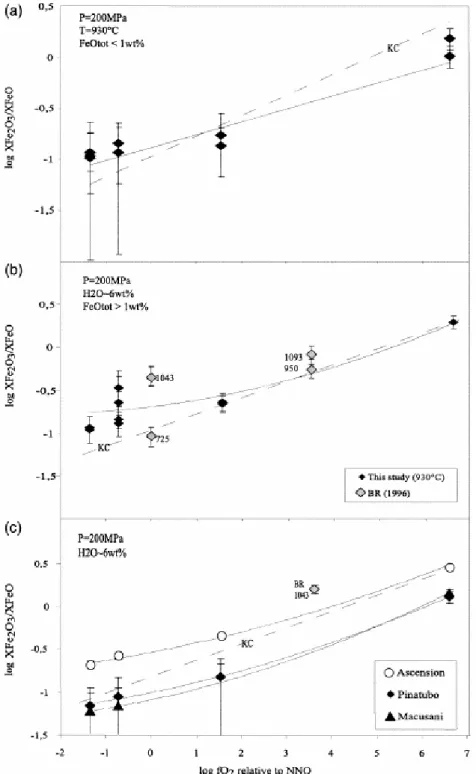
Measured and calculated log(XFe2O3/XFeO) are plotted against logfO2 for the synthetic and
natural compositions studied (Fig. 4). The relation between log(XFe2O3/XFeO) and logfO2 is
nearly linear but data points <NNO+1 depart from the linear trend marked by the KC line (Fig. 4). For glasses with low iron contents, data points are associated with relatively important errors (Fig. 4a,c). However, for the metaluminous glasses with FeOtot>1 wt.% and
the Ascension composition, the relation between log(XFe2O3/XFeO) and logfO2 is not linear (Fig.
4b,c). Such a behaviour is in notable contrast with what has been observed in dry systems (Fudali; Sack; Kress and Alberto), where the variation of log(XFe2O3/XFeO) with fO2 is linear
for a wide range of redox conditions and melt compositions. Another important difference between hydrous and dry compositions is the strong dependence of the ferric–ferrous ratio with FeOtot for fO2>NNO+1 (Fig. 2).
Two domains of variations of XFe2O3/XFeO with fO2 can be distinguished. For fO2<NNO+1, the
slope of the curves (i.e., d[log(XFe2O3/XFeO)]/d[logfO2]) progressively flattens (Fig. 4),
suggesting the existence of a specific effect of water on the speciation of iron in this fO2
range. In this region, the addition of water oxidizes iron dissolved in the melt, by reference to the expected behaviour represented by the dashed line calculated after KC (Fig. 4). In contrast, for fO2>NNO+1, d[log(XFe2O3/XFeO)]/d[logfO2] approaches 0.2, i.e., is nearly equal to
the slope of the dashed line calculated after KC. Therefore, in this region, the data define a relation nearly parallel to that found for dry melts. This suggests that, above NNO+1.5, there is no specific effect of the presence of water on the ferric–ferrous equilibrium and ferric– ferrous ratios are essentially controlled by the anhydrous melt composition and structure for a given fO2. It is worth emphasizing that the natural compositions (peralkaline sample from
Ascension, peraluminous sample from Macusani and the metaluminous Pinatubo composition; Fig. 4c) also exhibit the same type of behaviour, with ferric–ferrous ratios
distinctly flattening at low fO2. Data points from Baker and Rutherford (1996) plotted for
comparison (Fig. 4b) also illustrate the same general trend.
Fig. 4. Plot of log(XFe2O3/XFeO) against logfO2 for synthetic metaluminous compositions (a: FeOtot concentrations
<1 wt.%; b: FeOtot concentrations >1 wt.%) and Ascension, Macusani and Pinatubo compositions (c) at 930°C,
200 MPa, H2O-saturated. Data in Table 5. Dashed lines labelled KC show XFe2O3/XFeO ratios calculated after
Kress and Carmichael (1991) for the synthetic metaluminous compositions (a, b) and Ascension composition (c). Solid curves are polynomial fits to the data points. Data of Baker and Rutherford (1996) plotted as BR (96) with temperature indicated in degrees Celsius. Abbreviations and notations as in Fig. 2. Note the non-linear relation
6.2. Predicting the iron speciation of hydrous silicic melts with the KC equation
From what precedes, it appears that water has a specific effect (i.e., oxidizing) on ferric– ferrous ratios of silicic melts from NNO+1.5 and below. Under these fO2, the KC equation
predicts ferric–ferrous ratios significantly lower than the experimental values. In detail, however, there are differences between samples and it is possible to see “through” the effect of water the influence of bulk composition on the ferric–ferrous ratio. For example, at
NNO−1.35, 930°C, XFe2O3/XFeO increases in the following order (Fig. 2): Macusani
(peraluminous), series of metaluminous compositions, Ascension (peralkaline). Nevertheless, the effect of water is so important in this fO2 range that a term for dissolved water (see Baker
and Rutherford, 1996) must be added to the KC equation if applied to hydrous silicic melts below NNO+1. The correction to the KC equation is expected to be proportional to the
amount of dissolved water according to Baker and Rutherford (1996). However, in H2
-buffered systems, an increase of the melt H2O content leads to an increase of fO2 and,
therefore, the trend of increasing XFe2O3/XFeO with increasing water content observed by Baker
and Rutherford (1996) can be explained by an increase of fO2 (see also Wilke and Behrens,
1999).
Above NNO+1.5, the ferric–ferrous ratio is essentially controlled by the anhydrous melt composition and fO2. In this fO2 range, it should be possible to estimate the ferric–ferrous
ratios of hydrous melts by using the KC equation without an additional term describing the compositional effect of water (Moore et al., 1995). Moore et al. (1995) found no effect of dissolved water upon the speciation of iron at high fO2 (NNO+1–2). Baker and Rutherford
(1996) showed that the presence of water has no effect on the ferric–ferrous ratio in metaluminous silicic melts at NNO+2.5. In this study, the KC equation reproduces relatively well the experimental ferric–ferrous ratios of the hydrous metaluminous melts in the two most oxidizing runs at 930°C (Fig. 2). Yet, even in this fO2 range, it is worth stressing that not all
melt compositions have their iron redox ratio well reproduced with the KC equation. For example, experimental ferric–ferrous ratios of the peralkaline compositions studied here and by Baker and Rutherford (1996) are always higher than the calculated values, irrespective of the calculation scheme (KC or Moore et al., 1995). The reason for the discrepancy between the data of Moore et al. (1995), Baker and Rutherford (1996) and of this study for similar bulk compositions probably lies in the present limitations of the KC equation to describe subtle compositional controls on the ferric–ferrous ratio of silicic liquids. The KC equation is based on data for natural (mostly basalts and andesites) and synthetic iron-rich liquids and, as stressed by Moore et al. (1995), this compositional bias may be responsible for the KC expression being less sensitive for silicic liquids (see also Carmichael, 1991). The strong positive dependence observed between XFe2O3/XFeO and total iron content, especially at high
fO2 (Fig. 2 and Fig. 4), is also not accounted for by Eq. (3). It is possible that this positive
correlation is specific of silica-rich compositions. Alternatively, it may reflect the presence of water dissolved in the melt. However, a similar positive correlation between XFe2O3/XFeO and
FeOtot has been observed in some synthetic anhydrous systems (Mysen; Schreiber; Virgo;
Dyar and Alberto). We conclude that the differences between measured and calculated ferric– ferrous ratios of silicic melts above NNO+1 are not all attributable to the effect of dissolved water, and that additional work is needed to describe more precisely the dependence of the ferric–ferrous ratio on anhydrous melt composition.
A last characteristic of our data set that needs to be emphasized is the importance of the alkali/aluminium balance as a factor of control of the ferric–ferrous ratio of hydrous silicic liquids. The peraluminous composition (Macusani) has measured ferric–ferrous ratios persistently lower than calculated from the KC equation, even for high fO2. In contrast, the
peralkaline composition (Ascension) resides at the other end of the range, with ferric–ferrous ratios systematically higher than that calculated from KC. The series of metaluminous, Ca-free compositions occupies an intermediate position (Fig. 4b). It is worth emphasizing that at
fO2<NNO+1 (i.e., in the region where water has a specific oxidizing effect), the
peraluminous, metaluminous and peralkaline compositions still have ferric–ferrous ratios increasing in the same order. This is consistent with a control by melt structure (alkali/aluminium balance) of the ferric–ferrous ratio. Our data under water-saturated conditions are qualitatively consistent with those of Gwinn and Hess (1989) at 1 atm and in air, suggesting that even the in presence of dissolved water, the control of the ferric–ferrous ratio by the alkali/aluminium balance remains very strong. One apparent exception to this behaviour is shown by the metaluminous Pinatubo composition, which is characterized by ferric–ferrous ratios similar to the Macusani peraluminous composition, very different from the six other metaluminous compositions (Fig. 2). We attribute this contrasted behaviour to the presence of CaO, essentially substituting for K2O in the Pinatubo composition (Table 1).
CaO and K2O are known to have different structural roles in aluminosilicate liquids, CaO
being much less able than K2O to stabilize aluminium in tetrahedral coordination. Therefore,
different structural controls of the ferric–ferrous ratios are expected in CaO- and K2O-bearing
aluminosilicate melts, the former behaving more like a peraluminous melt than the latter for a given value of the alkali/aluminium balance. This provides a qualitative explanation of the different ferric–ferrous ratios observed among the different metaluminous samples and illustrates, if needed, the complexity of the compositional control of iron speciation in silicic melts.
7. Conclusions
The new experiments presented in this paper extend the iron speciation database for hydrous silicic melts toward both higher (>NNO+2.5) and lower (<NNO) fO2. The data, together with
those from the two previous studies (Moore and Baker), form the basis of a quantitative description of the ferric–ferrous ratio of hydrous liquids as a function of temperature, dissolved melt water content, fO2 and melt composition. The main conclusion from this study
is the confirmation of a specific oxidizing effect (i.e., increase of ferric–ferrous ratio for a given fO2) of water at fO2<NNO+1.5 for all studied compositions (both synthetic and natural).
This finding is in agreement with the previous results from Baker and Rutherford (1996). In contrast, above NNO+1.5, the oxidizing effect of water is lost and iron speciation is controlled by anhydrous melt composition and structure, besides fO2, as reported previously
by Moore et al. (1995). It follows that a term for dissolved water must be added to the empirical equations describing the compositional dependence of the iron redox ratio, if to be applied to the calculation of ferric–ferrous ratios of hydrous silicic melts below NNO+1.5. Another implication from this study is that the iron species in the melt cannot be considered to mix ideally and that their activity coefficients depend on fO2 and also FeOtot. Significant
differences exist between measured and calculated ferric–ferrous ratios of silicic melts that are not all attributable to the effect of dissolved water, so that additional work is needed to describe more accurately the dependence of the ferric–ferrous ratio on anhydrous melt composition.
It is worth emphasizing here that the oxidizing effect of water demonstrated in this study is restricted to moderately to fairly reduced magmatic liquids. So far, ferric–ferrous ratios of hydrous liquids have not been examined systematically below NNO−1.5, which is not so reduced a fO2 considering the range of redox conditions for natural magmas (e.g., Carmichael,
1991). Therefore, for hydrous calk-alkaline magmatic liquids that have fO2 in the range
NNO+1 to NNO+3, no specific effect of the presence of dissolved water on ferric–ferrous ratios is expected. It follows that the oxidizing nature of these magmas is not due to the presence of (sometimes) large amounts of dissolved water, but reflects either the intrinsically oxidized nature of the calk-alkaline magma series or loss of H2 during magmatic evolution.
Acknowledgements
This work was supported by the European Community (TMR project FMRX-CT96-0063 ‘Hydrous Melts’). Thorough and helpful reviews were provided by Harald Behrens and an anonymous reviewer. The editorial handling of Don Dingwell is gratefully acknowledged.
References
Alberto, H.V., Gil, J.M., Ayres DeCampos, N. and Mysen, B.O., 1992. Redox equilibria of iron in Ti-bearing calcium silicate-quenched glasses. J. Non-Cryst. Sol. 151, pp. 39–50. Baker, L. and Rutherford, M.J., 1996. The effect of dissolved water on the oxidation state of silicic melts. Geochim. Cosmochim. Acta 60, pp. 2179–2187.
Behrens, H., Romano, C., Nowak, M., Holtz, F. and Dingwell, D.B., 1996. Near-infrared spectroscopic determination of water species in glasses of system MAlSi3O8 (M=Li, Na, K):
an interlaboratory study. Chem. Geol. 128, pp. 41–63.
Borisov, A.A. and Shapkin, A.I., 1990. A new empirical equation relating Fe3+/Fe2+ in magmas to their composition, oxygen fugacity, and temperature. Geokhimiya 6, pp. 892–897. Burnham, C.W., Holloway, J.R. and Davis, N.F., 1969. Thermodynamic properties of water to 1000°C and 10,000 bar. Geol. Soc. Am., Spec. Pap. 132, pp. 1–96.
Bernard, A., Demaiffe, D., Mattielli, N. and Punongbayan, R.S., 1991. Anhydrite-bearing pumices from Mount Pinatubo: further evidence for the existence of sulfur-rich silicic magmas. Nature 743, pp. 210–415.
Carmichael, I.S.E., 1991. The redox state states of basic and silicic magmas: a reflection of their source regions?. Contrib. Mineral. Petrol. 106, pp. 129–141.
Carmichael, I.S.E. and Ghiorso, M.S., 1986. Oxidation–reduction relations in basic magmas: a case for homogeneous equilibria. Earth Planet. Sci. Lett. 78, pp. 200–210.
Carmichael, I.S.E. and Ghiorso, M.S., 1990. The effect of oxygen fugacity on the redox state of natural liquids and their crystallising phases. In: Nicholls, J. and Russell, J.K., Editors, 1990. Understanding Magmatic Processes. Modern Methods of Igneous PetrologyRev.
Devine, J.D., Gardner, J.E., Brach, H.P., Layne, G.D. and Rutherford, M.J., 1995. Comparison of microanalytical methods for estimation of H2O content of silicic volcanic
glasses. Am. Mineral. 80, pp. 319–328.
Dickenson, M.P. and Hess, P.C., 1981. Redox equilibria and the structural role of iron in aluminosilicate melts. Contrib. Mineral. Petrol. 78, pp. 352–357.
Dickenson, M.P. and Hess, P.C., 1986. The structural role and homogeneous redox equilibria of iron in peraluminous: metaluminous and peralkaline silicate melts. Contrib. Mineral.
Petrol. 92, pp. 207–217.
Dingwell, D.B., 1991. Redox viscosimetry of some iron-bearing silicate liquids. Am. Mineral.
76, pp. 1560–1562.
Dingwell, D.B. and Brearley, M., 1988. Melt density in the CaO–FeO–Fe2O3–SiO2 system
and the compositional dependence of the partial molar volume of ferric iron in silicate melts.
Geochim. Cosmochim. Acta 52, pp. 2815–2825.
Douglas, R.W., Nath, P. and Paul, A., 1965. Oxygen ion activity and its influence on the redox equilibrium in glasses. Phys. Chem. Glasses 6, pp. 216–225.
Dyar, M.D., 1985. A review of Mössbauer data on inorganic glasses: the effect of composition on iron valency and coordination. Am. Mineral. 70, pp. 304–316.
Fudali, R.F., 1965. Oxygen fugacities of basaltic and andesitic magmas. Geochim.
Cosmochim. Acta 29, pp. 1063–1075.
Gaillard, F., Scaillet, B. and Pichavant, M., 1998. Kinetics of iron oxidation–reduction in hydrous silicic melts. Terra Nova 10, p. 17.
Govindaraju, K., 1994. Compilation of working values and sample description for 383 geostandards. Geostand. Newsl. 18 158 pp..
Gwinn, R. and Hess, P.C., 1989. Iron and titanium properties in peraluminous and peralkaline rhyolitic liquids. Contrib. Mineral. Petrol. 101, pp. 326–338.
Harris, C., 1983. The petrology of lavas and associated plutonic inclusions of Ascension Island. J. Petrol. 24, pp. 424–470.
Holloway, J.R., Dixon, J.E. and Pawley, A.R., 1992. An internally heated, rapid-quench, high-pressure vessel. Am. Mineral. 77, pp. 643–646.
Holtz, F., Pichavant, M., Barbey, P. and Johannes, W., 1992. Effects of H2O on liquidus phase
relations in the haplogranite system at 2 and 5 kbar. Am. Mineral. 77, pp. 1223–1241.
Holtz, F., Behrens, H., Dingwell, D. and Johannes, W., 1995. H2O solubility in haplogranitic
Johnson, M.C., Anderson, A.T. and Rutherford, M.J., 1994. Pre-eruptive volatile contents of magmas. In: Carroll, M. and Holloway, J., Editors, 1994. Volatiles in MagmasRev. Mineral.
vol. 30, pp. 281–323.
Kilinc, A., Carmichael, I.S.E., Rivers, M.L. and Sack, R.O., 1983. The ferric ratio of natural silicate liquids equilibrated in air. Contrib. Mineral. Petrol. 83, pp. 136–140.
Knoche, R., Dingwell, D.B. and Weeb, S.L., 1995. Leucogranitic and pegmatitic melt densities: partial molar volumes for SiO2, Al2O3, Na2O, Rb2O, Cs2O, Li2O, BaO, SrO, CaO,
MgO, TiO2, B2O3, P2O5, F2O1, Ta2O5, Nb2O5 and WO3. Geochim. Cosmochim. Acta 50, pp.
435–443.
Kress, V.C. and Carmichael, I.S.E., 1988. Stoichiometry of the iron oxidation reaction in silicate melts. Am. Mineral. 73, pp. 1267–1274.
Kress, V.C. and Carmichael, I.S.E., 1991. The compressibility of silicate liquids containing Fe2O3 and the effect of composition: temperature: oxygen fugacity and pressure on their redox
states. Contrib. Mineral. Petrol. 108, pp. 82–92.
Lange, R. and Carmichael, I.S.E., 1990. Thermodynamic properties of silicate liquids with emphasis on density, thermal expansion and compressibility. In: Nicholls, J. and Russell, J.K., Editors, 1990. Understanding Magmatic Processes. Modern Methods of Igneous
PetrologyRev. Mineral. vol. 24, pp. 25–64.
Martel, C., Pichavant, M., Bourdier, J.L., Traineau, H., Holtz, F. and Scaillet, B., 1998. Magma storage conditions and control of eruption regime in silicic volcanoes: experimental evidence from Mt. Pelée. Earth Planet. Sci. Lett. 156, pp. 815–823.
Moore, G., Righter, K. and Carmichael, I.S.E., 1995. The effect of dissolved water on the oxidation state of iron in natural silicate liquids. Contrib. Mineral. Petrol. 120, pp. 170–179. Mysen, B.O., 1988. Structure and Properties of Silicate Melts, Elsevier, Amsterdam.
Mysen, B.O., Seifert, F.A. and Virgo, D., 1980. Structure and redox equilibria of iron-bearing silicate melts. Am. Mineral. 65, pp. 867–884.
Newman, S., Stolper, E.M. and Epstein, S., 1986. Measurement of water in rhyolitic glasses: calibration of an infrared spectroscopic technique. Am. Mineral. 71, pp. 1521–1527.
Osborn, E.F., 1959. Role of oxygen pressure in the crystallisation and differentiation of basaltic magma. Am. J. Sci. 257, pp. 609–647.
Pichavant, M., 1987. Effects of B and H2O on liquidus phase relations in the haplogranite
system at 1 kbar. Am. Mineral. 72, pp. 1056–1070.
Pichavant, M., Herrera, J.V., Boulmier, S., Briqueu, L., Joron, J.-L., Juteau, M., Marin, L., Michard, A., Sheppard, S.M.F., Treuil, M. and Vernet, M., 1987. The Macusani glasses, SE Peru: evidence of chemical fractionation in peraluminous magmas. In: Mysen, B.O., Editor, , 1987. Magmatic Processes: Physicochemical PrinciplesThe Geochemical Society, pp. 359– 373 Special Publication No. 1.
Pownceby, M.I. and O'Neill, H.St.C., 1994. Thermodynamic data from redox reactions at high temperatures: III. Activity composition relations in Ni–Pd alloys from EMF measurements at 850–1250 K, and calibration of the NiO+Ni–Pd assemblage as a redox sensor. Contrib. Mineral. Petrol. 116, pp. 327–339.
Robie, R.A., Hemingway, B.S. and Fisher, J.R., 1978. Thermodynamic properties of minerals and related substances at 298.15 K and 1 bar (105 Pascals) pressure and at higher temperature.
Geol. Surv. Bull. 1452, p. 456.
Roux, J. and Lefèvre, A., 1992. A fast-quench device for internally heated pressure vessels.
Eur. J. Mineral. 4, pp. 279–281.
Sack, R.O., Carmichael, I.S.E., Rivers, M. and Ghiorso, M.S., 1980. Ferric–ferrous equilibria in natural silicate liquids at 1 bar. Contrib. Mineral. Petrol. 75, pp. 369–376.
Scaillet, B. and Evans, B.W., 1999. The June 15, 1991 eruption of Mount Pinatubo: I. Phase equilibria and pre-eruption P–T–fO2–fH2O conditions of the dacite magma. J. Petrol. 40, pp.
381–411.
Scaillet, B., Pichavant, M., Roux, J., Humbert, G. and Lefèvre, A., 1992. Improvements of the
Shaw membrane technique for measurement and control of fH2 at high temperatures and
pressures. Am. Mineral. 77, pp. 647–655.
Scaillet, B., Pichavant, M. and Roux, J., 1995. Experimental crystallisation of leucogranite magmas. J. Petrol. 36, pp. 663–705.
Schreiber, H.B., Lauer, H.V. and Thanyasiri, T., 1980. Oxidation–reduction equilibria of iron and cerium in silicate glasses: individual redox potentials and mutual interactions. J.
Non-Cryst. Solids 38–39, pp. 785–790.
Taylor, J.R., Wall, V.J. and Pownceby, M.I., 1992. The calibration and application of accurate redox sensor. Am. Mineral. 77, pp. 284–295.
Thornber, C.R., Roedder, P.L. and Foster, J.R., 1980. The effect of composition on the ferric– ferrous ratio in basaltic liquids at atmospheric pressure. Geochim. Cosmochim. Acta 44, pp. 525–532.
Virgo, D. and Mysen, B.O., 1985. The structural state of iron in oxidised vs. reduced glasses at 1 atm: a 57 Fe Mössbauer study. Phys. Chem. Miner. 12, pp. 65–76.
Virgo, D., Mysen, B.O., Danckwerth, P. and Seifert, F., 1982. Speciation of Fe3+ in 1 atm Na2O–SiO2–Fe–O melts. Carnegie Inst. Washington, Year Book 81, pp. 349–353.
Wilke, M. and Behrens, H., 1999. The dependence of the partitioning of iron and europium between plagioclase and hydrous tonalitic melt on oxygen fugacity. Contrib. Mineral. Petrol.