Design of an Aluminum-Powered Reverse Osmosis
Desalination System for Disaster Relief
by
Peter Godart
Submitted to the Department of Mechanical Engineering
in partial fulfillment of the requirements for the degree of
Master of Science in Mechanical Engineering
at the
MASSACHUSETTS INSTITUTE OF TECHNOLOGY
June 2019
Massachusetts Institute of Technology 2019. All rights reserved.
Signature redacted
A u th o r ... ..
...
Department of Mechanical Engineering
May 22, 2019
(Signature
redacted-Certified by... ...
...
Douglas P. Hart
Professor
Thesis Supervisor
Signature redacted
Ac, AcMSSACHSM HPtd1v INSIW...-II
OF TECHNOLOGY
Nicols Hadjiconstantinou
JUN
1 3
2019
Chairman, Department Committee on Graduate
Theses
LIBRARIES
ARCHIVES
Design of an Aluminum-Powered Reverse Osmosis Desalination
System for Disaster Relief
by
Peter Godart
Submitted to the Department of Mechanical Engineering on May 22, 2019, in partial fulfillment of the
requirements for the degree of
Master of Science in Mechanical Engineering
Abstract
Fuel generated from highly energy-dense aluminum debris (23.3 kWh/L) is explored here as a means for producing electricity and clean water for disaster relief and preparedness. Energy is extracted from aluminum by first treating it with a minimal surface coating of gallium and indium (<3% by mass) and then reacting it with water to produce hydrogen, which can supply a fuel cell or internal combustion engine to generate electricity, and heat, which can be used to desalinate and purify seawater or contaminated fresh water.
To use aluminum debris as fuel, it is necessary to first understand which of the many possible aluminum-water reactions occurs at given a temperature and pressure in order to accurately model such quantities as the heat released and the amount of water required stoichiometrically for the reaction to proceed. A new thermodynamics analysis is presented here that predicts these quantities by minimizing the Gibbs free energy over the possible reactions to determine which is most favorable under a wide range operating conditions. Reaction experiments at the extremities of this range validate these results.
This new aluminum-water reaction model enables the design of a robust and minimally complex system that uses the heat released in this reaction to desalinate seawater. The system presented here uses a novel process called Heat-Driven Reverse Osmosis (HDRO), in which the release of thermal energy in an enclosed vessel pressurizes a working fluid up the high pressures required to drive reverse osmosis. Using the aluminum-water reaction as the heat source for this process, the theoretical upper limit performance ratio is shown to be 41 for 3.5% salinity seawater and maximum operating pressure of 138 bar, and an unoptimized prototype has achieved a performance ratio of 3. Additionally, because the hydrogen produced in the aluminum-water reaction is not consumed in this process, it can be used to generate electricity or desalinate additional water, further increasing the system-wide efficiency. Thus, in addition to being well-suited for disaster relief, this technology is a potentially attractive option for large-scale desalination in drought prone regions as well. Thesis Supervisor: Douglas P. Hart
Acknowledgments
This work came together with the help of numerous colleagues, sponsors, mentors, friends, and family members, whom I have been extremely grateful for throughout this process. First, to my parents, after all these years, I still do not regret you pushing me to apply for and attend MIT as an undergrad. Your interest in and willingness to contribute to my work has been extremely encouraging. Thank you for your support, and I am looking forward to what the future brings us.
To my grandmother, thank you for enduring all that you had to in order to make to and in this country to pave the way for us to succeed. Your unwavering support and (sometimes unsolicited) wisdom since day one have been a key part of making me who I am today and I cannot thank you enough.
To Tiandra, I am forever grateful for you putting up with me during quals and the ensuing madness. You handle all situations with incredible grace and integrity, and I genuinely aspire to be on your level of humanity some day.
To my friends in music and beyond, thank you for helping me stay grounded and generally for being the most generous, loving, and incredibly interesting people I know. Life is not worth living without you.
To my mentors, Fred, John and Rosie, Ran, and Gloria, your guidance and love has enabled me to keep a healthy mix of music at the forefront of my life, and have been largely responsible for helping maintain my sanity throughout this entire journey. Thank you.
To Doug, you have helped stoke my entrepreneurial drive, given me incredible space and support for me to explore my passions for research and teaching, and most importantly, you continuously remind me to not take myself too seriously. Looking forward to continuing this work with you and whatever else our crazy joint network of people throws our way.
To Jason, I could not have imagined having a better friend and partner through much of this work. You simultaneously brought healthy doses of humour, integrity, and sheer brilliance to all that we did. While I am selfishly sad you have moved on to bigger and better things, I am confident our career paths will cross again.
and friends throughout this process. Your work pushes me to be a better and more humble scientist and engineer every day.
To my UROPs these past two years, thank you for bringing energy and ingenuity to all of the many problems you helped me solve. You contributed greatly to this work.
To my students in 2.013 and 2.014, thank you for making my first teaching experiences so enjoyable and enlightening, as well as for inspiring me to be a better and more creative engineer and educator.
For the research itself, much of this work would not have been possible without the financial, technical, and spiritual support of Mike Wardlaw at the Office of Naval Research. I hope we can continue working together in the next phases of this project. Thanks as well to Toray and Swagelok for their generous support of this work.
Contents
1 Introduction 15
1.1 Desalination for Disaster Relief and Preparedness . . . . 17
1.1.1 Current Methods for Small-Scale Desalination . . . . 18
1.2 Aluminum Debris as a Fuel Source . . . . 20
1.2.1 Activating Bulk Aluminum . . . . 21
1.3 Electricity Production from Scrap Aluminum . . . . 22
2 Aluminum-Water Reaction Thermodynamics 27 2.1 Thermodynamics Model . . . . 28
2.1.1 Using Gibbs Free Energy to Predict Reaction Favorability . . . . 29
2.1.2 Model Implementation and Results . . . . 31
2.2 Experimental Validation . . . . 34
2.2.1 Byproduct Composition Analysis . . . . 36
2.2.2 Testing the Reactivity of Aluminum With Steam . . . . 39
2.3 Thermal Energy Release . . . . 41
3 Heat-Driven Reverse Osmosis (HDRO) 43 3.1 Overview and Operation . . . . 44
3.1.1 Reverse Osmosis . . . . 45
3.1.2 Underlying HDRO Principles . . . . 47
3.1.3 HDRO Operation . . . . 49
3.2 Thermodynamics Model . . . . 50
3.2.2 Upper Efficiency Bound . . . . 3.2.3 Comparing Efficiency Bounds . . . . 3.2.4 Model Limitations . . . . 3.3 HDRO Sizing for Different Operating Constraints
3.4 Experimental Validation . . . . 3.4.1 Prototype Design . . . . 3.4.2 Experimental Procedure . . . . 3.4.3 Initial Performance Results . . . . 3.4.4 Additional Sources of Error . . . . 3.5 Future W ork . . . . 3.5.1 Improving Prototype Efficiency . . . . 3.5.2 Thermodynamics Model Improvements . . 3.5.3 Utility Scale HDRO . . . . 3.5.4 HDRO Using Other Sources of Thermal Energy 4 Conclusion
A Computed Gibbs Free Energy Values
. . . . 59 . . . . 6 8 . . . . 72 . . . . 72 . . . . 74 . . . . 74 . . . . 8 0 . . . . 8 2 . . . . 8 6 . . . . 8 6 . . . . 8 6 . . . . 9 0 . . . . 9 0 91 95 99
List of Figures
1-1 Aluminum debris generated in the aftermath of Hurricane Maria in Puerto Rico and Dominica in 2017. . . . . 16
1-2 Current methods for small-scale desalination (below 1000 L/day) including (clockwise from left) floating solar distillers, fully integrated solar PV powered pumped RO, parabolic trough solar collectors, and manual or ICE-driven pum ped R O . . . . 19
1-3 Volumetric vs gravimetric energy densities for the most commonly used fuel sources and energy storage technologies. . . . . 20
1-4 Basic process for converting scrap aluminum to a water-reactive fuel using a minimal gallium-indium surface treatment. . . . . 22 1-5 Timeline for a typical aluminum-water reaction showing the production of
hydrogen, steam, and the final aluminum oxyhydroxide (AlOOH) byproduct. 23
1-6 Aluminum-fuel power systems for disaster relief applications. Left: 3 kW emergency backup generator. Right: 20 W emergency power pack. . . . . 24 1-7 Previous applications developed to date that use aluminum as a fuel source
for generating electricity. These devices include power systems for a personal emergency power pack, notional JPL Europa lander concept, charging station for drones over the open ocean, and a BMW i3 electric vehicle. . . . . 25
2-1 Gibbs free energy surface plots for each candidate aluminum-water reaction over operating range. . . . . 32
2-2 Aluminum-water transition diagram showing the different temperature-pressure regimes in which the labeled reactions are most likely to occur. Above the water saturation curve, Tsat, reactivity may be severely inhibited depending on the method of aluminum activation. Labels E1-E4 correspond with the conditions used for experimental validation. . . . . 33
2-3 High temperature and pressure test apparatus used for validating the ther-modynamics model presented here [25]. . . . . 34 2-4 FTIR results for the reaction byproducts collected for experiments E1-E4. . 37 2-5 XRD results for the reaction byproducts collected for experiments E1-E4. . 38 2-6 Experimental setup for testing the reactivity of aluminum with steam. ... 39
2-7 Results from steam reactivity tests. a) and c) depict the same activated alu-minum sample exposed to 100% RH air at room temperature 35 minutes apart, and b) and d) depict an activated aluminum sample exposed to super-heated steam 35 minutes apart. The darkened grey surface of the sample in
c) indicates the presence of A100H. . . . . 40
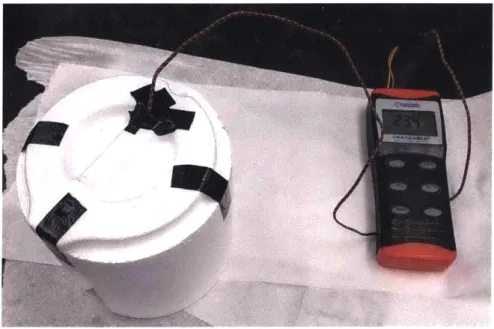
2-8 Calorimetry setup for measuring the aluminum-water reaction heat release. . 42
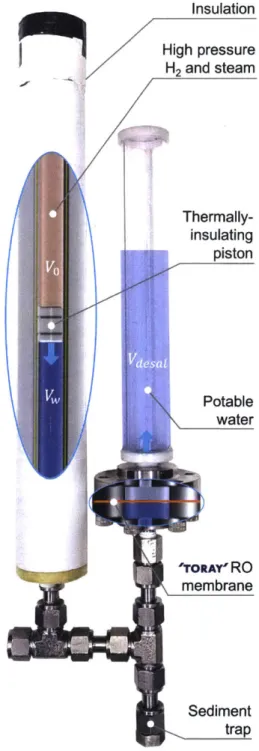
3-1 HDRO prototype system using an exothermic aluminum-water reaction to drive seawater desalination. . . . . 46 3-2 Minimum work per unit output required to desalinate saltwater at various
salinities [19J. . . . . 47 3-3 Graphical depiction of a reverse osmosis water separation process using a
membrane that is selectively permeable to water [Advanced Water Solutions, 20 18 ]. . . . . 4 8 3-4 After HDRO using an aluminum-water reaction is complete, the generated
hydrogen gas can be used to supply a fuel cell to produce electricity, for exam ple. . . . . 49 3-5 Depiction of the three states used in the thermodynamics analysis of the
3-6 Evolution of the system pressure and osmotic pressure for a dead-ended batch desalination process. . . . . 52 3-7 Model for the lower HDRO performance bound in which the piston is assumed
to be non-insulating. . . . . 53 3-8 Total piston volume per liter 3.5% salinity feed solution desalinated for the
lower efficiency bound HDRO model. . . . . 57 3-9 Required aluminum fuel mass per liter 3.5% salinity feed solution desalinated
for the lower efficiency bound HDRO model. . . . . 58 3-10 Model for the upper HDRO performance bound in which the piston is assumed
to be perfectly adiabatic. . . . . 60 3-11 T-S diagram for HDRO process running at recovery ratio of 0.5. This cycle is
only just the steam within the piston. The desalination occurs between States 2 and 3 here. . . .... . . . .. . .. .. .. . . . . 64 3-12 Required moles of steam generated per liter of water desalinated as a function
of recovery ratio for the upper efficiency bound HDRO model. . . . . 65 3-13 Maximum temperature, Tmax, at State 2 as a function of recovery ratio for
the upper efficiency bound HDRO model . . . . . . . . 66 3-14 Total piston volume per liter 3.5% salinity feed solution desalinated for the
upper efficiency bound HDRO model. . . . . 69 3-15 Required aluminum fuel mass per liter 3.5% salinity feed solution desalinated
for the upper efficiency bound HDRO model. . . . ... . . 70 3-16 Performance ratio bounds for HDRO shown in comparison to single stage
evaporation, MED, and MSF. . . . . 71 3-17 Bounds for the required piston volume and aluminum fuel mass per liter of
3.5% salinity water desalinated as a function of recovery ratio. The maximum operating pressure is 138 bar here . . . . 73 3-18 HDRO prototype system using stainless steel tubing and a 47mm diameter
polyam ide m embrane. . . . . 76 3-19 HDRO prototype membrane assembly [Millipore Sigma]. . . . . 77 3-20 Electronics schematic for the HDRO prototype system. . . . . 78
3-21 Main electronics control board for the HDRO prototype system. Not pictured here is the pressure transducer attached to the bottom of the piston. .... 79 3-22 LEDs on the front of the protective case indicate the state of the pressure
within the system. The height and color of the LEDs map to pressures ranging from 1-138 bar . . . .. . . ... . . . . 80 3-23 Typical process for running HDRO experiments. . . . ... . 81 3-24 Typical data for an HDRO performance trial. The data shown here is for a
recovery ratio of 0.65 operating at 120 g Al/L desalinated. . . . . 83 3-25 Fuel consumption results for initial HDRO prototype testing. . . . . 84 3-26 Performance ratio results for initial HDRO prototype testing . . . . 85 3-27 Comparison of different aluminum-water reaction rates in an HDRO system. 88 3-28 Potential method for slowing the aluminum-water reaction rate by inhibiting
the flux of water to the fuel itself. . . . . 89 3-29 Concept model for using solar thermal energy to drive HDRO. Here ammonia
solution with a carefully tuned vapor pressure profile acts as working fluid in this process. . . . . 92
List of Tables
2.1 Summary of results for reaction experiments spanning target operating range. 2.2 Ahrxn(T) [kJ/mol per two moles of aluminum for the three aluminum-water
reactions shown in Eq. 2.1-2.3 .. . . . .
3.1 Summary of thermodynamic states for lower efficiency bound HDRO analysis.
3.2 Summary of thermodynamic states for upper efficiency bound HDRO analysis.
3.3 Preliminary test trials. The trials marked with asterisk did not see complete reaction of the fuel input into the piston. . . . . AGrxn(T, p)
AGrxn(T, p)
AGrxn (T, p)
[kJ/mol] for the shown in Eq. 2.1, producing AI(OH)3. . . .
[kJ/mol] for the shown in Eq. 2.2, producing A100H. . . . . . [kJ/mol] for the reaction shown in Eq. 2.3, producing A120 3. . .
36 41 54 61 82 A.1 A.2 A.3 99 100 101
Chapter 1
Introduction
As climate change gives rise to more frequent and more devastating severe storms, droughts, and wildfires, an increasing number of communities are facing existential threat due to con-tinual damage to already vulnerable water and electricity infrastructure. For example, ac-cording to FEMA, Hurricane Maria in September of 2017 left Puerto Rico without complete power infrastructure well into 2018 after downing 80% of the island's power lines. Addition-ally, two months after the storm, 30% of the island's inhabitants still lived without direct access to potable water [30]. Clearly, while it is crucial to implement long-term clean en-ergy solutions to curb the onset of climate change, robust short-term solutions for providing portable emergency power and potable water are also necessary. In order to be feasible for the often-remote regions that need them, solutions must be able to utilize resources that are available locally. Additionally, with ground transportation infrastructure easily compromised by natural disasters like hurricanes, floods, and earthquakes, and for countries and territo-ries with limited access to air support, solutions for providing water must be as compact as possible and not require multiple return trips for refueling or equipment maintenance.
One such energy solution that meets these requirements is a water-reactive aluminum-based fuel developed recently at MIT. This fuel is highly energy dense and reacts exothermi-cally with water to produce hydrogen gas and aluminum oxyhydroxide, an inert and valuable byproduct, by the following equation:
49A
*
Figure 1-1: Aluminum debris generated in the aftermath of Hurricane Maria in Puerto Rico and Dominica in 2017.
where
Q
is the heat released by this reaction (11 kWh/L Al). As Fig. 1-1 shows, natural disasters typically generate a significant amount of aluminum debris that usually ends up unused in scrap yards and landfills.The novel ability to effectively and safely extract energy from scrap aluminum therefore presents inhabitants of drought- and other natural disaster-stricken regions with an envi-ronmentally safe and economical solution for dealing with both their water scarcity and aluminum waste issues simultaneously. In particular, coastal countries in Southeast Asia, the Middle East, the Caribbean Islands, and the drought-stricken Western United States stand to benefit greatly from an aluminum debris-powered system, which would enable these regions to convert scrap aluminum to water-reactive fuel, react this fuel with seawater, gray water, or brackish water, generate electricity using the hydrogen reaction product, desalinate or purify water using the reaction's thermal energy output, and provide users with a valuable aluminum oxyhydroxide byproduct that can be sold to offset operating costs. In addition to disaster relief, a compact, robust, and efficient desalination system also has numerous military and civilian applications, ranging from remote base camp resource utilization to emergency desalination on lifeboats. For example, soldiers or first responders could use pre-processed aluminum or utilize aluminum scrap onsite as a high-density energy source for desalinating and purifying their water in the field.
To this end, the focus of this thesis is the design, characterization, and development of a proof-of-concept prototype for a novel method of using the thermal energy released in the aluminum-water reaction to desalinate seawater. First, in order to better understand how much available heat is released by this reaction, a new thermodynamics model is developed and experimentally validated. Subsequently, it is shown that this thermal energy can be used to drive a highly efficient reverse osmosis desalination process without any intermediate energy conversion steps. Finally, the use of this and several key associated technologies also presented here, is explored as a means of significantly improving communities' ability to adapt to climate change by improving their ability to prepare for and respond to natural disasters. The end goal of this work is to shift the way aluminum waste and debris is viewed by giving people the means to turn what would otherwise be considered trash into critical resources like fresh water and electricity in a sustainable way.
1.1
Desalination for Disaster Relief and Preparedness
A "disaster" is broadly defined here as a sudden or unexpected event that causes significant damage and puts human health and safety at risk. Natural disasters like hurricanes and earthquakes, for example, have the capacity to not only threaten human life directly and im-mediately but can also disrupt critical water and electricity infrastructure, putting millions of people at risk for months afterwards. In the aftermath Hurricane Maria, the number of diabetes related deaths in Puerto Rico increased 46% in the two months after the storm in large part due to power outages preventing insulin from being properly refrigerated. Addi-tionally, the number of sepsis related deaths increased 55% over the same time period as a result of poor sanitary conditions exacerbated by inaccessibility to clean water [26].
At the same time, Puerto Ricans saw an ineffective and slow response from the federal government in providing relief from the effects of this storm. Currently, FEMA's primary solution to providing people with potable water is by transporting water bottles at a net cost of $0.49 per liter after factoring in transportation and logistics costs as well
13].
In the case of Hurricane Maria, FEMA brought bottles to the island but failed to distribute 20 million liters of water, which ultimately were disposed of over a year later in December 2018[22].
All the while hundreds of thousands of people were without direct access to potable water. Given these current inefficiencies, it is imperative that new technologies be developed and distributed to enable inhabitants of disaster-prone regions to be able harvest local resources to generate their own potable water in preparation for or in response to a natural disaster. Ultimately, technologies have the potential to both save lives and save FEMA significant logistical overhead.
In addition to natural disasters, numerous other events can precipitate an urgent need for potable water. For example, recreational boaters and hikers typically find themselves in remote places without direct access to any water infrastructure that civilization may provide. While preparations can be made to bring the required water along, unforeseen events may cause an unanticipated extension of trip duration or contamination of the water supply. For these cases, a low-cost, highly energy-dense desalination system that could be stored on a lifeboat or in a backpack, for example, would be able to generate the required amount of water for survival until help arrives.
1.1.1
Current Methods for Small-Scale Desalination
The scope of technologies that currently exist for small-scale desalination suitable for disaster relief and preparedness is limited. The scale of interest here ranges from personal to multiple family-sized systems that can desalinate water at rates in the range of 100 to 1000 liters per day. Fig. 1-2 shows some of the state-of-the-art desalinators in this range that are production ready and can be deployed in the event that water is needed in an emergency. As shown here, these devices include solar stills and parabolic reflectors that use solar thermal energy to drive evaporative distillation processes, as well as pumped reverse osmosis systems powered by solar PV or by manual effort.
The single-stage solar still from Aquamate, for example, is extremely simple and cheap, but it is also highly inefficient and therefore would require a significant amount of surface area to scale up produce water at the rate of hundreds of liters per day. At the other end of the scale, multi-stage evaporators that run on solar thermal energy are much more efficient, but due to system complexity and issues with salt scaling, it is impractical to use this technology in smaller, more compact systems. Consequently, there currently does not
WlpI
Aquamate Spectra Watermakers
Katadyn Parabolic trough (Nat. Geo., 2015)
Figure 1-2: Current methods for small-scale desalination (below 1000 L/day) including (clockwise from left) floating solar distillers, fully integrated solar PV powered pumped RO, parabolic trough solar collectors, and manual or ICE-driven pumped RO.
exist an evaporative system that effectively covers the range of output rates targeted here. Additionally, these systems also rely on direct sunlight to provide the energy necessary for desalination, and thus have a potentially low capacity factor, which is not ideal for time-critical disaster relief applications.
Reverse osmosis (RO) desalination systems require pumping saltwater to high pressures against a semipermeable membrane that only allows pure water to permeate through it. These systems can be made compact and minimally complex for the scale of interest here; however, the sources of energy required to power these devices are often suboptimal for this application. In particular, current RO desalinators for disaster relief either require electricity or manual effort to operate the required pumps. In the aftermath of a disaster, grid-supplied electricity is typically unavailable and solar PV runs into similar issues as the evaporative processes with low capacity factors. Human-powered systems, while highly robust, may also be unfeasible if the disaster leaves users partially incapacitated. With human power, there is also a trade-off between the expenditure of often limited metabolic energy and the generation of water that must be considered as well. Accordingly, the design space for providing people
90
8 0 ... -
-Silicon
Ar thracite '
60 -... (mass limited) (volume imited)m t d
Magnesium Lithirn BorohydridO
O Iron *
o 40 ...
0* DIesel N 35 MJ/L (9.7 kWh/L)
Q Zinc 42 MJ/kg (12 kWh/kg)
>thanoI Lithium
20 ... ~~. Uijuld Natural Gas... 20.Hdrzne
Sodiupm * Methanol
10 . - ... I
--quid A m mo .. 1.4 M J/L (0.39 kW h/L) ... ... ...
0.5 MJ/kg (0.14 kWh/kg)
'Lithium-ldn Battery ' Natural G* Hydrogen Gas
20 , 60 80 100 120 140 160
Gravimetric Density (MJ/Kg)
Figure 1-3: Volumetric vs gravimetric energy densities for the most commonly used fuel sources and energy storage technologies.
with an energy-dense, compact, and minimally complex desalinator for use in the aftermath of a natural disaster is still open, a notion that is further supported by the fact that FEMA still ships water bottles as their primary method of providing potable water to people with ready access to contaminated, brackish, or salty water.
1.2
Aluminum Debris as a Fuel Source
As a source of energy for powering desalination, aluminum is highly promising as it is both incredibly energy dense (23.3 kWh/L) and abundant in both the developed and developing world. At two times the energy density of diesel and forty times that of lithium ion batteries, aluminum is one of the most energy dense materials we have ready access to as illustrated by Fig. 1-3. Additionally, only 30% percent of global aluminum production utilizes recycled aluminum, leaving a staggering amount of potential energy sitting idle in landfills across the
~Alum um 84 MJ/L (23 kWh/L)
Earth, an even more significant issue in developing countries
[6].
When natural disasters strike, this collection of unused scrap aluminum grows significantly due to cars and buildings with aluminum structural elements becoming damaged and/or abandoned. Our novel tech-nique converts aluminum from these sources to fuel that, when reacted with water, produces hydrogen and heat, which in turn can be used to generate electricity and desalinate seawater or brackish water directly. The reaction also produces aluminum oxyhydroxide (AlOOH), an inert byproduct which is more valuable than the raw aluminum itself due to its high demand for use in fire suppressants, antacids, antiperspirants, and the manufacturing of pharmaceuticals.It is important to note here that the production of raw aluminum from bauxite ore is highly energy and carbon intensive. Therefore, even though aluminum is one of the most abundant elements on Earth, its use as a global primary fuel source is neither environmentally safe nor practical. For these reasons, extracting the energy back from aluminum after it has completed its primary function significantly improves the total system efficiency and enables the generation of value for end-users locally. For disaster relief, this means converting aluminum that would end up in a land fill or sold to another country into electricity and potable water locally instead.
1.2.1
Activating Bulk Aluminum
When exposed to air or water, an oxide layer forms immediately on the surface of aluminum, making it functionally inert and unreactive. There have been many techniques for disrupting this oxide layer, including [11], [32], and
[27]
among others. For this work, aluminum spheres 6 mm in diameter were activated using the technique developed in[28]
for its high reaction yields and ease of handling due to its ability to activate bulk aluminum. In this process, aluminum is activated by infusing a gallium-indium eutectic into the grain boundaries via a simple surface treatment [29]. The presence of the liquid eutectic along the grain boundaries allows aluminum ions dissolved within to be transported to water reaction sites at the outer surface. This activation method, which requires only 3% eutectic by mass, allows the treated aluminum to remain mostly inert to oxygen but highly reactive with water. The eutectic is not consumed in this reaction and can be recycled to make new fuel. Additionally, duePelletize Scrap Ga-In Surface Let sit for 24
Aluminum Treatment Hours @ 20 "C
Figure 1-4: Basic process for converting scrap aluminum to a water-reactive fuel using a minimal gallium-indium surface treatment.
to aluminum's high energy density, generating fuel from scrap is a self-sustainable process, requiring 50-100 times less energy than it releases in its reaction with water [13][18].
Fig. 1-4 shows the simple process used to activate aluminum fuel for the purposes of the research presented here. First scrap aluminum is pelletized into uniform, 6 mm diameter spheres and preheated to 120 C. Next, a eutectic mixture comprised of 80% gallium and 20% indium is heated separately to 120 C and subsequently added to the aluminum at a mass fraction of roughly 3%. The eutectic-coated spheres remain heated for 90 minutes and are then left to sit at room temperature for 24 hours. Five spheres are typically selected randomly from each batch of activated aluminum, and their reaction yields are tested to ensure that the treatment was done properly. Only batches in which all the tested spheres react to >80% stoichiometric completion are deemed acceptable and used in the experiments presented here.
1.3
Electricity Production from Scrap Aluminum
The reaction between aluminum and water given by Eq. 1.1 releases its internal chemical energy (859 kJ/mol Al) as a mix of thermal energy and chemical potential energy of hydrogen in approximately equal proportions [7]. Fig. 1-5 shows the typical timeline for this reaction, illustrating that within seconds of starting the reaction, a steady flow of hydrogen and steam is produced until all of the aluminum has been converted into the AlOOH byproduct. To generate electricity, the hydrogen produced in this reaction can be used to supply a fuel cell
Raw Al Fuel
Al/Water
AI/Water/H2
AI/Steam/ H2
AIOOH
(Os)
(30s)
(60s)
(90s)
(180s)
Figure 1-5: Timeline for a typical aluminum-water reaction showing the production of hy-drogen, steam, and the final aluminum oxyhydroxide (AlOOH) byproduct.
or internal combustion engine.
Fig. 1-6 shows a novel 3 kW emergency generator built as a final project for 2.013 and 2.014 that consumes aluminum to generate electricity via a fuel cell. In this system, the power generation process begins with the addition of water into a reaction chamber filled with the activated aluminum fuel. This water then initiates an aluminum-water reaction which produces hydrogen gas as well as thermal energy that vaporizes excess water. The output hydrogen from this reaction must then be cooled and purified of steam and other gasses before it can be later consumed by a PEM fuel cell to produce electrical work. This purification is accomplished through a series of heat exchangers and gas purifiers in which the steam is condensed and residual water vapor and oxygen is removed from the hydrogen gas. During this process the steam is recovered and recycled into the system's on-board water tank. Once suitably purified, the hydrogen gas is finally directed into the fuel cell, which converts the chemical energy stored in the hydrogen to electricity at an efficiency of roughly 40%. The output of the fuel cell is pure water, which can be fed back into the reactor to further conserve water consumption in this process.
Fig. 1-6 also shows a system that uses this same process to generate electricity, but on the scale of 20 W. The emergency power pack shown here is comprised of a flexible reaction bladder that contains the pretreated aluminum fuel pellets, a 20 W hydrogen fuel cell, and a standard issue water canteen to supply the water necessary for the hydrogen-producing reaction. In operation, the flexible reaction bladder expands to contain the aluminum
-1 CONOENSERS
TRTAP
Figure 1-6: Aluminum-fuel power systenms for disaster relief applications. Left: 3 kW
emer-gency backup generator. Right: 20 W emeremer-gency power pack.
hydroxide waste as hydrogen is produced to suppiy the small fuel cell. The user can use the electricity generated by the fuel cell to charge a battery, personal communication devices, or other small pieces of equipment in an emergency.
As illustrated by Fig. 1-7, numerous other similar power systems that utilize this alu-minum fuel have been developed by the author and others. These power systems all produce electricity via hydrogen fuel cells, allowing them to operate silently and at high efficiency. The reaction of aluminum with water produces no greenhouse gasses or toxic emissions, making these generators usable indoors without concern for noxious emissions as is the case with standard gasoline generators. Additionally, these systems all benefit from the fact that the aluminum fuel developed for these applications has a shelf-life on the order of years. This storage capability is significantly longer than that of gasoline and diesel fuel, a feature which is highly advantageous for such applications as emergency generators or personal energy storage devices where use is infrequent and often unanticipated.
JPLMi
I
I
I
I
10
100
1,000
10,000
Power Output [W
Figure 1-7: Previous applications developed to date that use aluminum as a fuel source for generating electricity. These devices include power systems for a personal emergency power pack, notional JPL Europa lander concept, charging station for drones over the open ocean, and a BMW i3 electric vehicle.
Chapter 2
Aluminum-Water Reaction
Thermodynamics
In order to properly design a desalination system that uses the thermal energy released from the reaction of activated aluminum fuel with water, it is first necessary to know how much heat is released in this reaction as a function of system operating temperatures and pressures. In order to model this process, two primary factors must be accounted for. First, aluminum and water can react to form a number of different compounds of the form AlOyH,, and the favorability of each possible byproduct is a function of both temperature and pressure conditions. In addition to affecting the amount of heat released in this exothermic reaction, the formation of different byproducts also informs the amount of water required stoichiomet-rically for the reaction to proceed, which is a crucial parameter in modeling the performance of any system that uses aluminum as a fuel. Second, because the enthalpies of the species involved in this reaction are themselves functions of temperature, so too is the total enthalpy of reaction (i.e. heat release), which is the net change in enthalpy from the products to the reactants of whichever of the possible reactions is occurring.
Prior work by the US Department of Energy laid the groundwork for this research by compiling results from various sources in the literature in order to map the aluminum-water reaction favorability as a function of temperature
[211;
however, their results partially conflict with experimental data given by[31],
[5],
[11], and[2]
and moreover do not include the effects of deviations in pressure. Consequently, the aim of the research presented hereinis the development of a reaction transition diagram which accurately predicts the byproducts of an aluminum-water reaction over a wide range of temperatures and pressures.
2.1
Thermodynamics Model
The temperature and pressure ranges considered for this research were 273.15-600 K and 0.1-10 MPa respectively, and the specific objective of this work was to generate a map of reaction favorability for each of the possible aluminum-water reactions over this parameter space. Because numerous possible reaction byproducts fit the form AlO ,Hz, it was first necessary to narrow down this list to make the analysis more tractable. In nature, aluminum is found most abundantly in the Earth's crust in bauxite, sedimentary rock comprised of gibbsite (Al(OH)3) and boehmite (AIOOH), and in aluminum oxides (A1203). With this information, coupled with aluminum-water reaction experiments that showed hydrogen being produced in a stoichiometric ratio of 3:2 with aluminum [10], it was hypothesized here that the most likely reactions to occur are:
2 Als) + 6 H20(1) 3 H2(g) + 2 Al(OH)3(aq) + Qi (2.1)
2 Al(s) + 4 H20(1) 3 H2(g) + 2 AlOOH(aq) + Q2 (2.2)
2 Al(s) + 3 H20(1) 3 H2(g) + Al20 3(aq) +
Q3
(2.3)where
Q'
indicates the release of heat in each reaction and is itself a function of tempera-ture conditions. This hypothesis was further supported by early work on aluminum-water reactions, which showed conclusively that reactions at 100 "C and 1 bar primarily produceA100H
131].
Wider ranges of ambient conditions, however, had not been sufficiently ex-plored previous to this work.2.1.1
Using Gibbs Free Energy to Predict Reaction Favorability
It is assumed for this analysis that both the temperature and pressure remains constant over the course of the entire reaction. For most power applications running at steady state, this is a reasonable assumption, provided that hydrogen is being produced and consumed at roughly constant and equivalent rates. This key assumption enables the use of the Gibbs free energy to predict reaction favorability over the target operating conditions. Specifically, for each of these candidate reactions, the change in Gibbs free energy, AG,_n (T, p), between the products and reactants is computed in order to determine how thermodynamically favorable that reaction is to proceed. For example, the change in Gibbs free energy for reaction 2.1 would be given by
AG()
= (2 -9A(OH) 3 + 3 g gH2) - (2 -9A1 6 (2.4)where gAl(OH)3, is the Gibbs free energy of AI(OH) 3 at a given temperature and pressure.
The sign and magnitude of this quantity indicate whether the reaction in question can occur spontaneously without outside influence and its relative favorability over other pos-sible reactions. Specifically, for AGxn(T, p) < 0, the reaction is spontaneous and for AGrxn(T, p) > 0, the reaction will not occur without outside influence. A reaction with-out a change in Gibbs free energy (AGrxn(T, p) = 0) is in equilibrium. When multiple reactions are possible at given ambient conditions, the most favorable reaction is the one that minimizes the change in Gibbs free energy.
Modifying the Gibbs Free Energy for Non-Standard Pressure
Values for the Gibbs free energy for the various species involved in the aluminum-water reaction are given by
[17]
over a range of temperatures; however, these values are all given at a standard pressure of 1 bar. Consequently, for the analysis presented here, it is necessary to obtain an expression for modifying the standard state Gibbs free energy accordingly. To start, from its definition, the Gibbs free energy G is given bywhere H is enthalpy, T is temperature, and S is entropy. The differential change in Gibbs free energy, dG, can then be expressed as
dG = dH - TdS - SdT (2.6)
where the differential enthalpy, dH, can be similarly derived from its definition as
dH = TdS + Vdp, (2.7)
where V is the species' volume.
Combining Eq. 2.6 and Eq. 2.7 yields an equation that can be integrated to get the total change in Gibbs free energy over changes in both temperature and pressure:
G(T,p) - G = - SdT' + Vdp', (2.8)
where G' is the Gibbs free energy at standard state temperature, T' (298 K), and pressure,
p0 (1 bar). Finally, the entropy can be related to the change in Gibbs free energy using the Maxwell relation of
S = T) (2.9)
and can be substituted back into Eq. 2.8 to yield
G(T, p) = G(T, p) + j Vdp'. (2.10)
Here G(T, p') is given in
[17],
and thus only the integral over the change in pressure must be computed. For gases, the ideal gas law can be used to express v as a function of temperature and pressure, enabling further simplification of the integral in 2.10 to giveG(T, p) = G(T, p') + nRT ln , (2.11)
p01
where n is the number of moles of gas present in the system. It is important to note that in Eq. 2.11, pi is the partial pressure of the gas species, whereas p in Eq. 2.10 is the total ambient
pressure. Once these equations are used to determine the molar change in Gibbs free energy for each compound in a reaction at the desired temperature and pressure, these values can then be subtracted to determine the net change in Gibbs free energy across a total reaction. To do this, the stoichiometric ratios in Eq. 2.1-2.3 are applied to the appropriate expression for molar change in Gibbs free energy and take the difference between the reactants and products, as shown in Eq. 2.4[7].
Additional Model Assumptions
For this analysis, the presence of air or other inert gases is neglected, as well as the formation of steam that could occur due to the exothermic nature of aluminum water reactions. Under certain reaction conditions these effects must be accounted for as well, but because their presence is highly dependent on reaction configurations, it is difficult to generalize their influence. Moreover, the presence of other inert gases is typically negligible as the partial pressure of hydrogen has a minimal impact on the final Gibbs free energy values. The formation of steam, however, could be significant and should be addressed in future work. Finally, it is hypothesized that the precise method of activating aluminum to make it reactive with water would have a negligible effect on the Gibbs free energy, provided that the catalysts strictly do not participate in the reaction. For the particular method of activation previously described, this hypothesis is additionally supported by the fact that the composition of the original elemental aluminum is altered by a mole fraction of only 1%. Even if the gallium and indium used here were to participate in side reactions to some degree, the effects of their presence would be minimal. Finally, for batch desalination using this aluminum-water reaction, the pressures and temperatures may not remain constant over the course of operations. It is recommended that this effect be studied in greater detail in follow-on work.
2.1.2
Model Implementation and Results
To determine which reaction is most favorable at given constant temperature and pressure conditions, we seek the reaction that minimizes AGxn (T,p). Using values for gi0(T) given
-840, AI(OH)3 -840 AIOOH -850 -860 o6 -870, -_2 -880 -S-890 00 -910 -920 0 2 4 6 300 350 Pressure [MPa] 8 150 200 250 10 50 100 Temperature [00]
Figure 2-1: Gibbs free energy surface plots for each candidate aluminum-water reaction over operating range.
free energy values for each of the three candidate aluminum water reactions were computed. These values were then evaluated in MATLAB over grid of 3700 points in a range of 273.15-600K and 0.1-10 MPa. Because the temperature data was comparatively sparse, this program iterates over pressures, at every step computing the Gibbs free energy for each available temperature data point and interpolating using a second order polynomial. Sweeping these curve-fit polynomials over the target operating pressure range generates the surfaces shown in Fig. 2-1. Additionally, to highlight the transitions between each reaction regime, this code also computes
min(AG(',,(T, p)) (2.12)
in order to show the regimes in which each reaction, i is most favorable. Fig. 2-2 shows the curves that represent the transitions between these regimes and can be used generally to determine the expected reaction for given operating conditions. At atmospheric pressure for example, the reaction producing A1OOH is more favorable above 21 'C and the reaction
400 3501 300
o250'
E4 1200! C' 2A1 +4H 20 -3H 2 + 2AO(OH) E i2 150 -1006E 50 2A + 6H20 -> 3H2 + 2A1(OH)3 El aE3 1 2 3 4 5 6 7 8 9 10 Pressure [Pa] x106Figure 2-2: Aluminum-water transition diagram showing the different temperature-pressure regimes in which the labeled reactions are most likely to occur. Above the water saturation curve, Tsat, reactivity may be severely inhibited depending on the method of aluminum activation. Labels El-E4 correspond with the conditions used for experimental validation.
producing AI(OH)3 is more favorable below 21 *C.
Modifying Model for Limited Steam Reactivity
With the particular method of aluminum activation employed for this research first developed in [281, it was found that these activated aluminum pellets exhibit no observable reaction with steam. Consequently, the reaction regime transition diagram is modified accordingly to show limited reactivity above the saturation temperature, Tsat(p), for water at a given pressure, since above Tsat(p), liquid water will rapidly vaporize at the surface of the aluminum in practice, severely inhibiting the reaction. The shaded area of the diagram in Fig. 2-2 shows this region of limited reactivity. The thermodynamics analysis presented here does not take this phenomenon into account, however, and thus for different methods of aluminum activation, this inhibited ability to react with steam may not be present. In this case, the
Figure 2-3: High temperature and pressure test apparatus used for validating the thermo-dynamics model presented here 125].
shaded region here can be ignored.
2.2
Experimental Validation
To validate the thermodynamics model for predicting which aluminum-water reaction is most favorable at given temperature and pressure conditions as shown in Fig. 2-2, four reaction experiments were performed toward the extremes of the target operating range as indicated on the same figure by the points labeled El-E4. Two high-pressure tests (E2 and E4) saw the reaction of aluminum and water in a pressure vessel maintained at 6.9 MPa and at temperatures of 230 'C and 4 *C. Two atmospheric pressure tests (El and E2) saw the reaction of water and aluminum at 100 'C and at 4 *C. These operating points were chosen so as to provide two data points above and below the curve that represents a transition between the Al(OH) 3 and A100H reaction regimes.
maintain a constant 6.9 MPa over the course of the reaction. This setup is comprised of stainless steel tubing and Swagelok fittings to ensure minimal leaking. Nitrogen gas was used to pre-pressurize the reactor and the system pressure was maintained via a pressure relief valve. Note that the presence of nitrogen in this analysis is neglected as it only affects the
hydrogen term in AG,., (T, p). Due to the stoichiometry, this deviation reduces AGrxn(T, p)
for each candidate reaction by the same amount, and thus there is no effect on where the transitions between each reaction occur.
Activated aluminum samples are initially held in a tube above the reactor by means of a servo-driven ball valve, which enabled us to remotely deliver the samples to the water in the reaction tube below. Due to safety considerations, the entire experiment was performed remotely. For the high temperature and high pressure experiment, the reactor and sample pre-feeder tubes were preheated to the specified temperature of 230 'C using a manually-adjusted resistive heating strip wrapped around the tubes. Fiberglass insulation, not pictured in Fig. 2-3, was added around the heating elements.
In the high pressure and low temperature experiments, the entire test apparatus was placed in a large cooling chamber maintained at 4 C for the duration of the experiment. The apparatus, water, and aluminum were pressurized and pre-chilled for one hour, and again the aluminum samples were delivered to the reactor below via remote activation. Given the greatly reduced reaction rate of aluminum and water that has been observed at low temperatures, the apparatus was left undisturbed for 48 hours to ensure the reaction would proceed to completion.
For the 100 0C, atmospheric pressure experiment, water in an open beaker over a hot plate was brought to a boil, and aluminum samples preheated to 100 C were subsequently added. To keep the system cool for the experiment at atmospheric pressure and 4 C, a small amount of aluminum was reacted in a large, constantly stirred, ice bath. A temperature probe placed near the reaction site confirmed that the reaction was kept below 4 *C.
In all cases, the aluminum-water reaction byproducts, which were crucial for determining which reaction occurred, were dried at room temperature in a clean and uncontaminated fume hood for one week before their composition was analyzed. This drying step was crucial, as some analysis techniques like FTIR are highly sensitive to the presence of water.
T p A G Expected Actual Trial ["C] [MPa] [kJ/mol] Byproduct Byproduct(s)
El: 4 0.1 -887 Al(OH) 3 Elemental Al,
Al(OH) 3
E2: 100 0.1 -897 A100H A100H
E3: 4 6.9 -898 Al(OH) 3 Al(OH) 3
E4: 230 6.9 -880 A100H A100H
Steam: 150 0.1 N/A Al203 No reaction
Table 2.1: Summary of results for reaction experiments spanning target operating range.
In addition to residual water resulting in inaccuracies in the FTIR measurements, there are two other potential sources of error to acknowledge. First, because the aluminum-water reaction is exothermic, localized heating of the activated aluminum pellet could result in actual temperature conditions that are higher than intended. This was mitigated by maintaining the temperature of the surrounding reaction site at a constant temperature and by only reacting small amounts of aluminum at a time. Additionally, impurities in the water could result in side reactions, the products of which may be detected by either the FTIR or XRD equipment. With this in mind, deionized water was used in all experiments as a precaution.
2.2.1
Byproduct Composition Analysis
Two sets of experiments were performed to determine the composition of the aluminum-water reaction byproducts. First, an FTIR method was used to obtain IR spectra for the byproduct samples. Here a standard technique was used in which potassium-bromide (KBr) is mixed with some reaction byproduct sample and compressed to produce a pellet. The IR spectrum for each pellet was measured using a Thermo Fisher FTIR6700 spectrometer in transmission mode over a range of 400-4000 cm1 and with a resolution of 1.93 cm-. Second,
XRD was performed using a Shimadzu XRD-6000 Lab-X diffractometer with a copper source (A = 0.15406 nm) over a range of 10-90'at a resolution of 0.02*(20).
The results of the reaction transition diagram presented here were validated using FTIR and XRD, as summarized in Table 2.1. For experiment El, XRD results were inconclusive as the limited reactivity at lower temperature and atmospheric pressure left enough
1 1.2 0.8 aj 0.8 0.6 . -2 0.6 0 0 0) 0.0.4 -0.4 0.2 0.2 0 '0 3500 3000 2500 2000 1500 1000 500 3500 3000 2500 2000 1500 1000 500 Wavenumber [cm~'] Wavenumber [cm~1]
E3: 4 0C, 6.9 MPa E4: 230 *C, 6.9 MPa
2 2 C 1.5 C 1.5 CU (O 0 0 U) 1CO) 0.5 0.5 0 0 3500 3000 2500 2000 1500 1000 500 3500 3000 2500 2000 1500 1000 500 Wavenumber [cm~1] Wavenumber [cm1 I
Figure 2-4: FTIR results for the reaction byproducts collected for experiments E1-E4.
tal aluminum in the byproducts to saturate the readings and prevent the detection of any hydroxide. The IR spectrum for this sample, as shown in Fig. 2-4, however, exhibits peaks in the locations of the characteristic hydroxyl stretching and bending modes for gibbsite
(Al(OH) 3) [14]. In particular, distinct peaks are shown in the 3656, 3548, and 3464 cm-1
bands, with a slight shoulder at 3430 cm-1, all of which are indicative of Al(OH) 3.
Charac-teristic Al-O stretching, as identified in [24], is indicated by peaks in the 482.1, 532.3, and 721.3 cm1 bands and further supports the formation of Al(OH) 3.
For experiment E2, both XRD and FTIR results indicate a strong presence of pseu-doboehmite. XRD results, shown in Fig. 2-5, indicate a close match with the ICDD reference for A100H
[121,
and FTIR results strongly indicate the characteristic hydroxyl stretching mode at 3442 cm-1 with a weak shoulder at 3101 cm-'. The absence of strong peak defi-nition in higher wavenumbers for this sample indicates the presence of additional water inE2: 100 C, 0.1 MPa 20 30 40 50 60 70 80 9 2 Theta (Degrees) E3: 4 C, 6.9 MPa 500 400 C 0 300 2 200 100 0 3000 2500 : 2000 :3 0 C -0 1000 C 500 0 80 ) 200 150 C 0 100 C 2 50 0 10000 8000 R 0 C C 90 6000 4000 2000 0 20 30 40 50 60 70 80 9 2 Theta (Degrees) E4: 230 C, 6.9 MPa 20 30 40 50 60 70 2 Theta (Degrees) 0 80 90
Figure 2-5: XRD results for the reaction byproducts collected for experiments E1-E4. 20 30 40 50 60 70
2 Theta (Degrees)
Hydrogen Activated Resistive Heater Bubble
Aluminum - Water
Steam
Watere
WaerHot Plate Controller
Figure 2-6: Experimental setup for testing the reactivity of aluminum with steam.
the sample and thus suggests that its composition is primarily pseudoboehmite. This result is corroborated via comparison with the spectra for pseudoboehmite obtained in [311. As before, the same characteristic Al-O stretching modes are exhibited by peaks in the 495.6, 626.8, and 732.8 cm-1 bands.
Experiments E3 and E4 showed strong matches to reference data for Al(OH) 3 and
A100H respectively in both the XRD and FTIR analyses. In particular, for E3, strong and well-defined peaks in the IR spectrum at the 3656, 3548, 3465, 3435, 3423, 977.7, 771.4,
530.3, and 430.0 cm' bands support the independent XRD match to ICDD reference data
for Al(OH) 3. For E4, peaks in the IR spectrum at the 3307, 3095, 1074, 742.5, 613.3, and
493.7 cm-1 bands are in close alignment with data given by [31] and [14] and corroborate
this collected XRD data, which indicated a match to A100H. The 742.5, 613.3, and 493.7
cm1 bands in particular indicate the expected Al-O stretching. The model presented here
is additionally supported by prior work in [311, [5], [11], and [2], in which aluminum-water
reactions were shown to primarily produce A100H at 1 bar and temperatures above 50 'C.
2.2.2
Testing the Reactivity of Aluminum With Steam
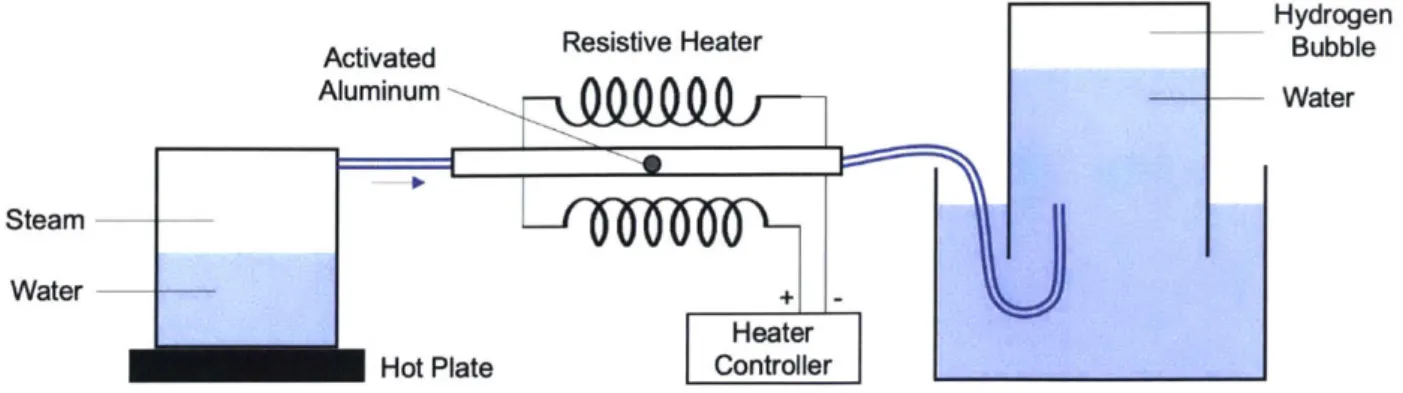
To determine the reactivity of aluminum with steam, the setup shown in Fig. 2-6 was used. In this setup, steam is produced by boiling water over a hot plate and is subsequently passed through a pre-heated glass tube containing the aluminum sample. The tube heater here is a simple resistive heater controlled manually using a thermocouple for feedback. Steam and resultant hydrogen leave this heated tube and bubble up through a water column
con-Figure 2-7: Results from steam reactivity tests. a) and c) depict the same activated alu-minum sample exposed to 100% RH air at room temperature 35 minutes apart, and b) and d) depict an activated aluminum sample exposed to superheated steam 35 minutes apart. The darkened grey surface of the sample in c) indicates the presence of A100H.
tained in an inverted beaker, allowing us to measure the volume of any hydrogen produced. Throughout this process, the temperature of the aluminum sample, and walls of the tube holding it, are kept well above Tsat = 100 'C at atmospheric pressure to ensure steam does not condense on the sample, potentially skewing the results. Additionally, it was useful to use a transparent tube in order to visually inspect the degree of reaction, which is typically marked by a distinct discoloration of the aluminum. Finally, as a control the same amount of activated aluminum was placed in a jar of argon maintained at 100% relative humidity and at a room temperature of 20 "C. This added step was for visual comparison to assess the relative degree of reaction between the two samples.
In the experiment for determining the reactivity of steam with the activated aluminum, no hydrogen was measured in the bubble column setup shown in Fig. 2-6. Additionally, visual inspection of the aluminum sample at various points during the experiment also failed to detect the presence of any hydroxide accumulation on the surface, which can be marked by a distinct darkening discoloration and would indicate the presence of some reaction. Fig.


![Figure 2-3: High temperature and pressure test apparatus used for validating the thermo- thermo-dynamics model presented here 125].](https://thumb-eu.123doks.com/thumbv2/123doknet/14685766.560213/34.917.178.740.117.533/figure-temperature-pressure-apparatus-validating-thermo-dynamics-presented.webp)


![Table 2.2: Ahrxn(T) [kJ/mol] per two moles of aluminum for the three aluminum-water reactions shown in Eq](https://thumb-eu.123doks.com/thumbv2/123doknet/14685766.560213/41.918.287.588.109.446/table-ahrxn-moles-aluminum-aluminum-water-reactions-shown.webp)