Tomasz Ozyhar * , Stefan Hering and Peter Niemz
Moisture-dependent orthotropic
tension-compression asymmetry of wood
Abstract: The influence of moisture content (MC) on the
tension-compression (Te-Co) asymmetry of beech wood
has been examined. The elastic and strength parameters,
including Te and Co Young ’ s moduli, Poisson ’ s ratios,
and ultimate and yield stress values, were determined
and compared in terms of different MCs for all orthotropic
directions. The results reveal a distinctive Te-Co strength
asymmetry with a moisture dependency that is visualized
clearly by the Te to Co yield stress ratio. The Te-Co
asym-metry is further shown by the inequality of the elastic
properties, known as the “ bimodular behavior ” . The
lat-ter is proven for the Young ’ s moduli values in the radial
and tangential directions and for individual Poisson
’
s
ratios. Although the bimodularity of the Young ’ s moduli is
significant at low MC levels, there is no evidence of
mois-ture dependency on the Te-Co asymmetry of the Poisson ’ s
ratios.
Keywords: bimodular behavior, moisture content,
Pois-son ’ s ratios, strength, tension-compression asymmetry,
Young ’ s moduli
*Corresponding author: Tomasz Ozyhar, Institute for Building Materials (Wood Physics) , ETH Zurich, 8093 Zurich , Switzerland , Phone: + 41 44 633 9179, Fax: + 41 44 632 11774,
e-mail: ozyhart@ethz.ch
Stefan Hering: Institute for Building Materials (Computational Physics for Engineering Materials) , ETH Zurich, 8093 Zurich , Switzerland
Peter Niemz: Institute for Building Materials (Wood Physics) , ETH Zurich, 8093 Zurich , Switzerland
Introduction
The influence of moisture content (MC) on the mechanical
properties of wood in general is well known (as reviewed
by Gerhards 1982 ). However, little attention has been paid
to the moisture-dependent elasticity, particularly in the
radial (R) and tangential (T) directions (McBurney and
Drow 1962 ; Neuhaus 1983 ; Hering et al. 2012a ; Ozyhar
et al. 2012a ). In some references (e.g. Kretschmann and
Green 1996 ), the influence of the anatomical direction on
the elastic properties was not considered (no distinction
is made between the R and the T). Further, although
the influence of MC on the Young ’ s and shear moduli
is known in principle (Gerhards 1982 ; Bodig and Jayne
1993 ; Niemz 1993 ), the moisture dependency of the
Pois-son ’ s ratios remains unclear. The results of the few works
investigating the influence of MC on the Poisson ’ s ratios
for wood (McBurney and Drow 1962 ; Hering et al. 2012a )
are partially inconsistent and therefore do not explain the
moisture dependency of the Poisson ’ s ratios.
It is frequently assumed that the elastic properties
for wood in tension (Te) and compression (Co) are equal
(Kollmann and Cote 1984 ; Niemz 1993 ), but some
consid-erable presumptions exist, suggesting that this might not
be the case. Conners and Medvecz (1992) found a Te-Co
asymmetry for the longitudinal (L) Young ’ s moduli of
yellow poplar, which was dependent on MC. However,
there are no corresponding studies that consider the
influence of MC on the Te-Co inequality of the Young ’ s
moduli in the R and T directions. The same is true for the
Poisson ’ s ratios.
Unlike the elastic behavior, the strength asymmetry
of wood is better known (Kollmann and Cote 1984 ; Bodig
and Jayne 1993 ; Ross 2010 ), that is, wood exhibits higher
strength in Te than in Co. However, studies focusing on
the moisture dependency of this relationship are widely
missing. Interestingly, the influence of MC on the strength
properties of wood was recognized early (Tiemann 1906 ),
but a complete data set covering the strength values in Te
and Co as a function of MC in all anatomical directions
is not available. Yet, especially in the R and T directions,
where wood strength is of great importance with regard
to the load capacity and failure prediction of wooden
structures, the knowledge about the moisture-dependent
behavior in these directions is limited to a few references
(Kollmann 1956 ; Goulet 1960 ; Kufner 1978 ; Hering et al.
2012b ; Ozyhar et al. 2012b ).
The present study investigates the influence of MC
on the Te and Co mechanical behavior of beech wood.
Young ’ s moduli, Poisson ’ s ratios, and ultimate and yield
stress values, determined in Te and Co, were investigated
as a function of MC in all anatomical directions (L, R, and
T) to characterize the moisture-dependent orthotropic
Te-Co relationship of the wood
’
s elastic and strength
behavior.
Materials and methods
Material and specimen preparation
The experimental work was performed on European beech wood ( Fagus sylvatica L.) grown in Switzerland near Zurich. The average wood density, determined at 20 ° C and 65 % relative humidity (RH), amounted to 669 ± 21 kg m -3 . All experiments were carried out with
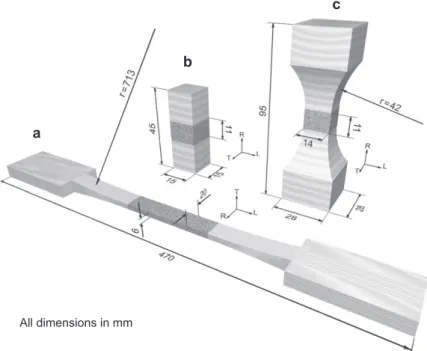
clear wood samples originating from the same wood material. Three specimen types were prepared for testing (Figure 1 a – c): (a) the Te properties in the L direction [according to the DIN 52188 (1979) standard], (b) the Co properties in the L, R, and T directions, and (c) the Te properties in the R and T directions. The “ dogbone ” -shaped specimen (Figure 1c) is used because its neck-like shape in-duces failure in the reduced cross-section, which is particularly suit-able for testing the Te properties. The cubic specimen (Figure 1b) is well suited for determining the Co properties because it allows the use of an equal specimen for all anatomical directions. Referring to the DIN 52185 (1976) and DIN 52192 (1979) standards, the Co speci-men ’ s dispeci-mensions tripled the specispeci-men width. The latter was cho-sen so that the resulting cross-section was similar to that of the Te specimens in the R and T directions (Figure 1b and c). This guaran-teed similar stress distribution in the evaluation area, therefore in-creasing the comparability of the Te and Co properties in the R and T directions.
Eight groups of moisture conditioned samples were available for testing. The samples in the R and T directions were available at eight MC levels; samples in the L direction were due to the time-con-suming preparation limited to fi ve MC levels. Specimens were condi-tioned at various RHs to achieve diff erent wood MCs. As a fi rst step, all specimens were preconditioned at standard climatic conditions (20 × C, 65 % RH). Aft er they reached the equilibrium MC (EMC), the
specimens ’ densities were determined by the gravimetric method. Subsequently, all specimens were randomly divided and separated for the specifi c MC levels, which were achieved in climatic chambers at RHs of 95 % , 85 % , and 65 % and climatic boxes containing diff er-ent saturated salt solutions at a temperature of 20 ° C. The following salt solutions were employed: LiCl for 12 % RH, CH 3 CO 2 K for 22 % RH, CaCl 2 for 30 % RH, and NaI for 40 % RH (RH levels at 20 ° C according to Greenspan 1977 ). The EMC was reached by exposing the specimen to adsorption (acclimatized at RHs above 65 % ) and desorption condi-tions (acclimatized at RHs below 65 % ) for a period of 4 – 6 weeks. The wood MC ( ω ) was determined by the oven-drying method according to the ASTM-D 442-92 (2007) standard. The specimen MCs amounted to ω = 3.3 % for specimens conditioned at 12 % RH (LiCl), ω = 4.7 % at 22 % RH (CH 3 CO 2 K), ω = 5.9 % at 30 % RH (CaCl 2 ), ω = 6.7 % at 40 % RH
(NaI), ω = 11.3 % at 65 % RH, ω = 14.3 % at 85 % RH, and ω = 16.3 % at 95 % RH. A separate group of specimens with ω ≈ 0 % was prepared by oven-drying the specimens at a temperature of 103 ± 2 ° C (placed in a desiccator before use). To prevent cracking, drying was performed carefully by gradually increasing the temperature.
Experimental procedure
The experiments consisted of Te and Co tests and were performed under standard climatic conditions immediately aft er removing the specimen from the climatic box or chamber. The mass of the speci-mens was recorded twice, that is, directly aft er removal from the climatic box or chamber and aft er the test. The increase in MC dur-ing the test did not exceed 0.2 % ; therefore, the MC of the oven-dried specimen is referred to as ω ≈ 0 % . Te and Co displacement-controlled tests were conducted using a Universal Testing Machine (Zwick Z100). A load cell with 100 kN maximum capacity was used for tests per-formed in the L direction and a 10 kN load cell was used for tests in
All dimensions in mm
a
b
c
Figure 1 Profile and dimension (all data in mm) of specimens with a highly contrasting random dot texture in the cross-section.
(a) Specimen according to the DIN 52188 (1979) standard for Te testing in the L direction. (b) Specimen for the determination of the Co prop-erties in the L, R, and T directions. (c) “ Dog-bone ” -shaped specimen used to determine the Te propprop-erties in the R and T directions.
the R and T directions. A fl exible joint was used during Co loading to prevent bending. The specimens were loaded until failure with a con-stant loading rate so that specimen failure was reached in 90 ± 30 s, whereby the loading rate was adjusted to the orthotropic direction and the loading direction (Te and Co).
A digital image correlation technique was used to capture the strains during deformation. A high-contrast random dot texture, nec-essary for the evaluation of the displacements, was sprayed onto the evaluation surface of the specimen (Figure 1). The specimen surface was fi lmed during the test with a CCD camera. A sequence of images was taken with a frequency of 2 Hz on the cross-sectional surface area of the specimen. The surface strains were calculated from the displacements that occurred during deformation using the VIC 2D soft ware (Correlated Solution) according to Keunecke et al. (2008) .
The Young ’ s moduli E were obtained from the ratio of the stress
σ to the strain ε measured in the linear elastic range:
,2 ,1 ,2 ,1 , , . i i i i i i i E σ σ σ i R L T ε ε ε − Δ = = ∈ Δ − (1)
The specifi c stress boundaries σ i ,1 and σ i ,2 were set at 10 % and 30 % of the specimen strength and adjusted according to the ortho-tropic directions. The Poisson ’ s ratios ν , defi ned as the strain ratio of the passive (lateral) strain component ε i and the active strain
compo-nent in the load direction ε j ,
, and , i ij j i j R L T i j ε ν ∈ ε =− , , , ≠ (2)
were determined in the linear elastic range from the linear regression of the passive-active strain diagram. Because the surface area of the TL plane on the Te specimen in the L direction was insuffi cient for the strain calculation (Figure 1a), the ν TL was not gaugeable. The ν TL
values were therefore calculated from the relationship between the elastic coeffi cients given by Bodig and Jayne (1993) :
1.
ν =ν ⋅ ⋅E E−
TL LT L T (3)
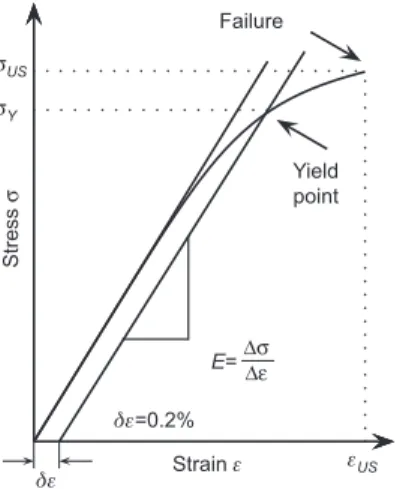
Two diff erent strength criteria, the ultimate stress σ US and the
yield stress σ Y , were used to characterize the Te and Co strength prop-erties of wood in all orthotropic directions. Using the following rela-tionship:
σ = max US , P A (4)
the σ US was calculated from the maximum load P max at the point of failure and the cross-sectional area A of the unloaded specimen. The
σ Y , representing the stress at the specifi c yield point, was obtained
from the measured stress-strain diagram based on the “ off set yield method ” at 0.2 % plastic strain (Figure 2 ).
Results and discussion
Young ’ s moduli
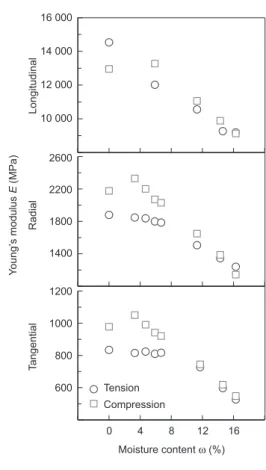
The Young ’ s moduli presented in Table 1 clearly indicate
a decreasing trend with increasing MC in all orthotropic
σUS σY Stress σ Yieldpoint Failure Strain ε δε=0.2% δε εUS E=ΔσΔε
Figure 2 Determination of the yield stress σ Y and the ultimate stress σ US from the stress-strain relationship.
directions and support the general findings published
for European beech wood in Wommelsdorf (1966) , Hering
et al. (2012a) , and Ozyhar et al. (2012a) . The Te ( E
Te) and
the Co ( E
Co) Young ’ s moduli decrease with MC and reach
their lowest values at
ω = 16.3 % ; however, their maxima
appear at different MCs. Whereas the E
Teincreases
con-tinuously with decreasing MC up to
ω ≈ 0 % , the maximum
E
Cois reached at
ω = 5.9 % for the L direction and at ω = 3.3 %
for the R and T directions. The corresponding E
Covalues at
ω ≈ 0 % are lower than those measured in the ω = 3.3 – 5.9 %
range. A comparison of the E
Teand E
Covalues further
reveals a Te-Co inequality of the moduli, which becomes
distinct for the R and the T directions and is unique to the
lower MCs (Figure 3 ). Although no significant difference
is found between E
Teand E
Coin the MC range from
ω ≈ 8
to
ω = 16.3 % , the E
Covalues measured between
ω ≈ 0 and
ω ≈ 8 % are significantly higher than the corresponding E
Tevalues.
Various testing arrangements, unequal or
unde-fined loading rates, and specimen shapes are factors
that exacerbate a direct comparison of the E
Teand E
Covalues from various literature sources. Also, the Te and
Co properties cannot be determined on the same
speci-men type in all anatomical directions. In the present
study, the specimen shape chosen in the R and T
direc-tions guaranteed a similar stress-state development in
the tested area (Figure 1b and c). The chance for a fair
comparability of the results was further increased by
the application of similar testing arrangements and the
same evaluation methods for testing the elastic
proper-ties in Te and Co and by the fact that the values were
determined on samples taken from the same wood
mate-rial. In view of this and considering the low variability
ω_ _ ( % ) Te Co EL Te E R Te E T Te E L Co E R Co E T Co 0.0 x_ (MPa) 14 540 1880 830 12 950 2180 980 CoV ( % ) 13.6 5.2 13.6 17.4 6.5 9.2 n ( – ) 10 10 9 9 9 8 ρ (kg m -3 ) 656 649 679 645 673 675 3.3 x_ (MPa) – 1850 820 – 2330 1050 CoV ( % ) – 5.8 10.3 – 10.4 8.7 n ( – ) – 9 9 – 9 9 ρ (kg m -3 ) – 672 683 – 669 678 4.7 x_ (MPa) – 1840 820 – 2200 990 CoV ( % ) – 5.9 13.1 – 8.6 8.5 n ( – ) – 10 9 – 7 9 ρ (kg m -3 ) – 669 684 – 673 677 5.9 x_ (MPa) 12 020 1800 810 13 270 2070 940 CoV ( % ) 14.5 6.7 11.2 16.4 7.7 8.6 n ( – ) 11 10 10 12 9 9 ρ (kg m -3 ) 674 683 681 684 672 659 6.7 x_ (MPa) – 1790 820 – 2030 920 CoV ( % ) – 4.3 13.6 – 9.4 5.7 n ( – ) – 9 9 – 9 7 ρ (kg m -3 ) – 658 667 – 674 656 11.3 x_ (MPa) 10 560 1510 730 11 060 1650 750 CoV ( % ) 12.5 8.1 10.3 23.2 11.5 9.1 n ( – ) 23 30 32 24 30 22 ρ (kg m -3 ) 661 668 654 654 680 689 14.3 x_ (MPa) 9270 1340 600 9880 1390 620 CoV ( % ) 12.7 10.3 9.6 0.22 0.12 0.10 n ( – ) 10 17 15 17 14 14 ρ (kg m -3 ) 659 698 661 639 679 690 16.3 x_ (MPa) 9200 1240 530 9140 1140 550 CoV ( % ) 19.7 13.1 6.7 23.8 13.2 10.9 n ( – ) 8 17 16 16 14 13 ρ (kg m -3 ) 673 687 658 639 682 687
Table 1 Moisture-dependent Young ’ s moduli for European beech wood in Te and Co.
E Te , Young ’ s moduli determined in Te; E Co , Young ’ s moduli
determined in Co; , average wood MC; x_, mean value; CoV , coefficient of variation; n , number of specimens; ρ , wood density at = 11.3 % . 16 000 14 000 12 000 10 000 2600 2200 1800 1400 1200 1000 800 T a ngential Radial Longitudinal Y oung’ s modulus E (MPa) 600 0 4 8 12 16 Moisture content ω (%) Tension Compression
Figure 3 Comparison of the moisture-dependent Young ’ s moduli for European beech wood determined in Te and Co.
of the E
Teand E
Co, the Te-Co asymmetry of the moduli
in the R and T directions was found to be remarkable
(Table 1). The results might at first appear inconsistent
with the equality of the Te and Co Young ’ s moduli often
assumed for wood (Kollmann and Cote
1984
; Niemz
1993 ); however, the equality of the E
Teand E
Cohas not
yet been experimentally proven for a wide MC range.
According to Conners and Medvecz (1992) , the “
assump-tion of moduli equality seems to be more firmly rooted in
tradition than in factual evidence. ”
It was shown that many natural and synthetic
mate-rials exhibit an elastic behavior that differs in Te and
Co (Curnier et al. 1995 ; Jones 2009 ). According to Jones
(2009) , this phenomenon is known as bimodular
behav-ior. Examples of such behavior are given for a variety of
materials, including nacre, rock, concrete, asphalt, bone,
rubber, ceramics, graphite, and fiber-reinforced and
gran-ular composite materials (Zemlyakov 1965 ; Feldman 1987 ;
Guo and Zhang 1987 ; Stimpson and Chen 1993 ; Bertoldi
et al. 2008 ; Barak et al. 2009 ; Destrade et al. 2010 ; Katicha
et al. 2011 ). A bimodular behavior for wood was
demon-strated by Conners and Medvecz
(1992)
, who reported
that the E
Coin the L direction for yellow poplar was higher
than the E
Teand the relationship was moisture dependent.
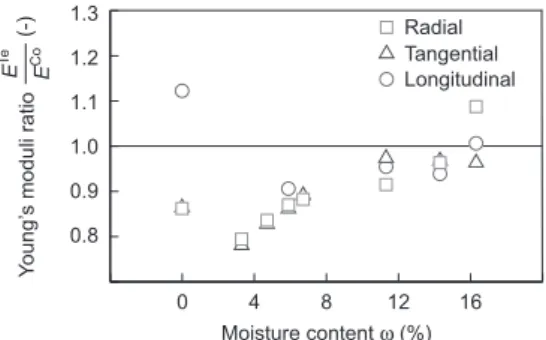
Although the results of the present study are slightly
dif-ferent, the E
Te/ E
Coratio confirms the existence of
moisture-dependent bimodular behavior for the R and T directions
(Figure 4 ). The results show that the E
Covalues in these
directions are higher than the corresponding E
Teand the
in a composite with debonded fibers is associated with
the decline in the elastic load transfer in Te. Although
the mechanical behavior of a fiber matrix composite and
wood is not comparable, the fiber matrix can serve as a
model system, in which the fibers are equivalent to the
cellulose chains in the hemicellulose-lignin matrix in
wood. Similar curves with a flattening slope for the E
Teat low MC levels as shown in Figure 3 were reported by
Ö stman (1985) and for individual wood fibers by
Kersav-age (1973) .
The elastic load transfer influencing the E
Temight
also arise from nanocracks or microcracks induced
during drying below 6 % MC (Sakagami et al. 2009 ). The
development of microchecks in the cell wall associated
with increased brittleness of the cellulose at low MC was
mentioned by Kersavage (1973) . The microcracks could
interrupt the elastic load distribution in Te and lower
the E
Te, as discussed for chemical debonding. The
mate-rial observed in this study was carefully dried, but the
presence of such imperfections cannot be completely
excluded.
It is also conceivable that the bimodular behavior
might be generated by a different elastic response of the
material in Te and Co. According to Winandy and Rowell
(2005) , it is likely that, even at low stress levels in the
elastic range, permanent set or distortion will be
intro-duced in a wood section. Wood, often simplified as a
linear elastic material, is a complex nanocomposite with a
hierarchical structure of components (Salm é n and Burgert
2009 ; Stevanic and Salm é n 2009 ), which in reality is
char-acterized by a viscoelastic behavior (Schniewind and
Barrett 1972 ). Distortions on the microlevel and nanolevel
could result in a different elastic stress distribution in
Te and Co. This could lead to a different elastic behavior
observable at the macroscopic level, despite this behavior
being clearly influenced by MC.
Poisson ’ s ratios
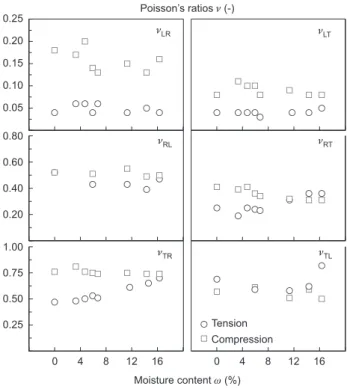
The Poisson ’ s ratios are characterized by a high
variabil-ity as indicated by the high CoV (Table 2 ) that, according
to Hering et al. (2012a) , is attributable to the high natural
variability. A similar high variability has also been
pre-sented by Keunecke et al. (2008) .
The results show only a marginal influence of MC
on the Poisson ’ s ratios (Figure 5 ). The
ν
TRin Te and the
ν
LRin Co decrease slightly with increasing MC overall;
however, the Poisson ’ s ratios appear to be rather
insen-sitive to MC. This is different from the
moisture-depend-ent trend reported by Hering et al. (2012a) , who found a
1.3 1.2 1.1 1.0 0.9 0.8 0 4 8 12 16 Moisture content ω (%) Radial Tangential Longitudinal Y oung’ s moduli ratio E Co (-) E Te
Figure 4 Te-Co Young ’ s moduli ratio E Te / E Co as a function of MC.
asymmetry is most pronounced at MCs ranging from
ω ≈ 0
to
ω ≈ 8 % , indicating a weakening trend with increasing
MC. Although the averaged difference between the E
Coand
the E
Teat
ω = 3.3 % amounts to ≈ 21 % , the Te and Co moduli
at
ω ≈ 15 % can be assumed to be equal.
The interpretation of the above finding is currently
speculative. Water sorption at the molecular level can be
one reason, at which hydrogen linkages ( “ H-bridges ” ) are
participating between OH groups in the cell wall (mainly
of the polysaccharides) and the water molecules (Hill
et al. 2010 ). A complete molecular sorption of water is
reached at 6 % MC and a monomolecular layer covers the
interior surfaces of wood. At lower MC levels, the water
monolayer is slowly vanishing and the approximately 100
times weaker van der Waals linkages with their shorter
distances become active. It is perhaps possible that even
some covalent bonds in the cell wall may break in the
course of this process (Stamm 1964 ). Because the
stress-strain relationship in wood is a function of the
chemi-cal bond strength (Winandy and Rowell 2005 ), the
stiff-ness below 6 % MC is expected to be negatively affected.
Especially, the weakening of the secondary bonds (van
der Waals linkages instead of hydrogen linkages) at the
interface between the primary cell wall and the middle
lamella would definitely affect the stiffness of the cell
assembly. It is assumed that such chemical debonding
will interrupt the elastic stress transfer in Te,
conse-quently weakening the Te stiffness while leaving the E
Counimpaired. The differences in the elastic load transfer in
Te and Co are known for structures with debonded
com-posites and the topic has been discussed for materials
other than wood (Benveniste 1985 ). It was demonstrated
that, for a matrix composite with debonded fibers, the
E
Tein the transverse to the fiber direction is lower than
the corresponding E
Co, whereas, in the case of perfect
bonding conditions, the E
Teand E
Coare equal (Takhashi
and Chou 1988 ; Turovtsev and Toropov 2005 ).
Accord-ing to the latter authors, the inequality of the E
Coand E
Teω_ ( % ) Te Co * ν TL ν RL ν TR ν RT ν LR ν LT ν TL ν RL ν TR ν RT ν LR ν LT 0.0 x_ ( – ) 0.69 0.52 0.47 0.25 0.04 0.04 0.57 0.52 0.76 0.41 0.18 0.08 CoV ( % ) – 22.3 6.1 34.7 56.3 15.4 15.4 39.6 8.4 7.8 46.7 48.2 3.3 x_ ( – ) – – 0.48 0.19 0.06 0.04 – – 0.81 0.39 0.17 0.11 CoV ( % ) – – 3.7 16.3 38.4 27.1 – – 3.2 10.4 31.9 65.4 4.7 x_ ( – ) – – 0.50 0.25 0.06 0.04 – – 0.76 0.41 0.20 0.10 CoV ( % ) – – 7.6 11.1 27.7 45.3 – – 8.3 7.8 68.7 13.6 5.9 x_ ( – ) 0.59 0.43 0.53 0.24 0.04 0.04 0.61 0.51 0.75 0.36 0.14 0.10 CoV ( % ) – 19.5 4.1 12.4 38.2 47.3 21.2 58.8 3.7 6.6 67.5 40.1 6.7 x_ ( – ) – – 0.51 0.23 0.06 0.03 – – 0.74 0.34 0.13 0.08 CoV ( % ) – – 5.1 36.2 47.5 32.8 – – 6.9 12.6 29.7 37.3 11.3 x_ ( – ) 0.58 0.43 0.61 0.31 0.04 0.04 0.51 0.55 0.75 0.32 0.15 0.09 CoV ( % ) – 17.1 6.7 9.8 42.9 41.2 28.2 40.6 5.5 23.9 49.5 42.1 14.3 x_ ( – ) 0.62 0.39 0.65 0.36 0.05 0.04 0.59 0.49 0.74 0.31 0.13 0.08 CoV ( % ) – 17.3 7.6 8.7 52.4 32.3 27.1 44.5 4.5 13.2 57.6 32.4 16.3 x_ ( – ) 0.87 0.47 0.70 0.36 0.04 0.05 0.50 0.50 0.74 0.31 0.16 0.08 CoV ( % ) – 21.2 5.5 7.5 19.3 40.4 18.5 43.6 6.4 12.4 18.1 32.9 Table 2 Moisture-dependent Te and Co Poisson ’ s ratios for beech wood
*Value calculated from Eq. (3). ν , Poisson ’ s ratios; , average wood MC; x_, mean value; CoV , coefficient of variation.
Poisson’s ratios ν (-) 0.25 0.20 0.15 0.05 0.80 0.60 0.40 0.20 1.00 0.75 0.50 0.25 0 4 8 12 16 0 Moisture content ω (%) Tension Compression 4 8 12 16 0.10 νLR νRL νTR νRT νTL νLT
Figure 5 Comparison of the moisture-dependent Poisson ’ s ratios for European beech wood determined in Te and Co.
slightly decreasing tendency with increasing MC for
Euro-pean beech wood, and McBurney and Drow (1962) , who
determined that some of the Poisson’s ratios of Douglas
fir (based partially on data calculated from elastic
con-stants) were found to increase, whereas others were
found to decrease with increasing MC. Different wood
species, varying specimen shapes, and unequal loading
conditions might be the reason for deviating trends in the
literature.
Poisson ’ s ratio values in Te and Co (Figure 5) indicate
that the loading direction (Te and Co) appears to have a
greater influence on the values than the MC. The
inequali-ties between Te and Co values are most pronounced for the
ν
LRand
ν
TRand, to a lesser extent, for
ν
LTand
ν
RT, whereby
the Poisson ’ s ratios in Co, in general, are higher than the
corresponding values in Te. The lack of data on the Te-Co
relationship of wood ’ s Poisson ’ s ratios prevents a
verifi-cation of the results. Research done on other biological
materials with distinctive anisotropy and hierarchical
structures, like bone, however, have shown a distinctive
Te-Co asymmetry for the Poisson ’ s ratios (Chahine et al.
2004 ).
Strength behavior
The comparison of the Te and Co strength behavior of
wood in the L direction is straightforward. The strength
properties that describe the behavior in this direction are
given by the ultimate stress
σ
US, that is, the stress reached
at failure (
σ
UTSis ultimate Te stress for Te and
σ
UCSis
ulti-mate Co stress for Co). However, this approach is not
adaptable to describe the Te-Co strength relationship in
the R and T directions. The Co strength behavior of wood
in the R and T directions is characterized by the absence
of clear failure (Gibson and Ashby 1988 ; Bodig and Jayne
1993 ), and no
σ
USvalue in these directions exists.
Conse-quently, the
σ
UScriterion is not applicable to describe the
Te-Co strength relationship in these directions. An
alterna-tive strength criterion is given by the definition of the yield
stress
σ
Y(Figure 2). Introduced in several standards, the
σ
Yis an easily quantifiable strength value that is used as the
strength criterion for other materials such as metals and
plastics. Defined as the stress at 0.2 % plastic strain (based
on the ASTM-E8/E8M-11 ( 2011 ) standard for Te testing of
metallic materials), the
σ
Yallows a direct strength
com-parison with other (particularly metallic) materials.
In the present study, the
σ
Ywas determined in the
same manner in Te (
σ
TeY
) and Co (
σ
CoY
); data are
com-pared in Table 3 ). It becomes obvious that the Te and Co
strengths are affected significantly by MC (Table 3). Similar
to the Young ’ s moduli, the lowest strength is reached at
ω = 16.3 % and increases continuously with decreasing MC
in all orthotropic directions. Differently than for the E
Co, the
maximum Co strength is reached at
ω ≈ 0 % , supporting the
findings from literature summarized in Gerhards (1982) .
The ultimate Te stress
σ
UTS, on the other hand, is reached
at
ω = 5.9 % , ω = 3.3 % , and ω = 4.7 % in the L, R, and T
direc-tions, respectively, indicating a strength decline at lower
MCs (Figure 6 ). Similar findings showing that drying below
a certain point leads to reduced strengths were reported
(Goulet 1960 ; Kufner 1978 ; Kretschmann and Green 1996 ).
Based on the mentioned references, the optimum
σ
UTSis
reached at MCs
ω ≈ 4 – 12 % depending on the wood species
and the orthotropic direction. Note that the results at
ω ≈ 0 % , although particularly valuable, may not be directly
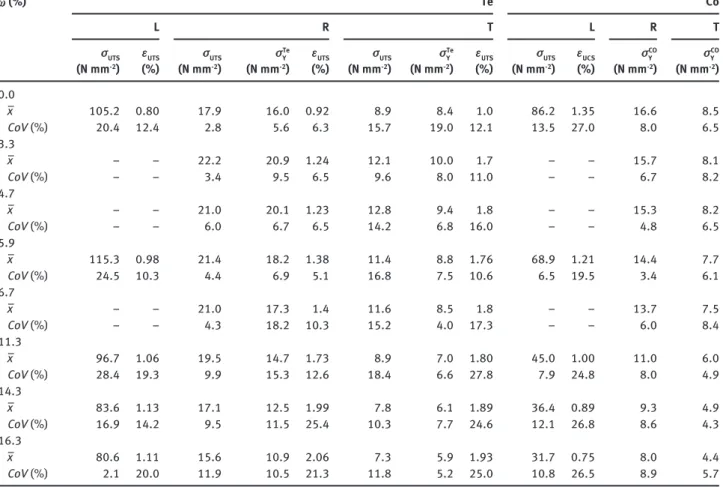
ω_ ( % ) Te Co L R T L R T σ UTS (N mm-2) ε UTS ( % ) σ UTS (N mm-2) σY Te (N mm-2) ε UTS ( % ) σ UTS (N mm-2) σY Te (N mm-2) ε UTS ( % ) σ UTS (N mm-2) ε UCS ( % ) σY CO (N mm-2) σY CO (N mm-2) 0.0 x_ 105.2 0.80 17.9 16.0 0.92 8.9 8.4 1.0 86.2 1.35 16.6 8.5 CoV ( % ) 20.4 12.4 2.8 5.6 6.3 15.7 19.0 12.1 13.5 27.0 8.0 6.5 3.3 x_ – – 22.2 20.9 1.24 12.1 10.0 1.7 – – 15.7 8.1 CoV ( % ) – – 3.4 9.5 6.5 9.6 8.0 11.0 – – 6.7 8.2 4.7 x_ – – 21.0 20.1 1.23 12.8 9.4 1.8 – – 15.3 8.2 CoV ( % ) – – 6.0 6.7 6.5 14.2 6.8 16.0 – – 4.8 6.5 5.9 x_ 115.3 0.98 21.4 18.2 1.38 11.4 8.8 1.76 68.9 1.21 14.4 7.7 CoV ( % ) 24.5 10.3 4.4 6.9 5.1 16.8 7.5 10.6 6.5 19.5 3.4 6.1 6.7 x_ – – 21.0 17.3 1.4 11.6 8.5 1.8 – – 13.7 7.5 CoV ( % ) – – 4.3 18.2 10.3 15.2 4.0 17.3 – – 6.0 8.4 11.3 x_ 96.7 1.06 19.5 14.7 1.73 8.9 7.0 1.80 45.0 1.00 11.0 6.0 CoV ( % ) 28.4 19.3 9.9 15.3 12.6 18.4 6.6 27.8 7.9 24.8 8.0 4.9 14.3 x_ 83.6 1.13 17.1 12.5 1.99 7.8 6.1 1.89 36.4 0.89 9.3 4.9 CoV ( % ) 16.9 14.2 9.5 11.5 25.4 10.3 7.7 24.6 12.1 26.8 8.6 4.3 16.3 x_ 80.6 1.11 15.6 10.9 2.06 7.3 5.9 1.93 31.7 0.75 8.0 4.4 CoV ( % ) 2.1 20.0 11.9 10.5 21.3 11.8 5.2 25.0 10.8 26.5 8.9 5.7 Table 3 Moisture-dependent strength properties for European beech wood in Te and Co.
σ UTS , ultimate Te stress; σ UCS , ultimate Co stress; Te Y
σ , Te yield stress; Co Y
σ , Co yield stress; ε UTS , strain at σ UTS ; ε UCS , strain at σ UCS ; ω, average
comparable to other MCs, as the impact on the mechanical
behavior via nanocracks and microcracks has not yet been
clarified.
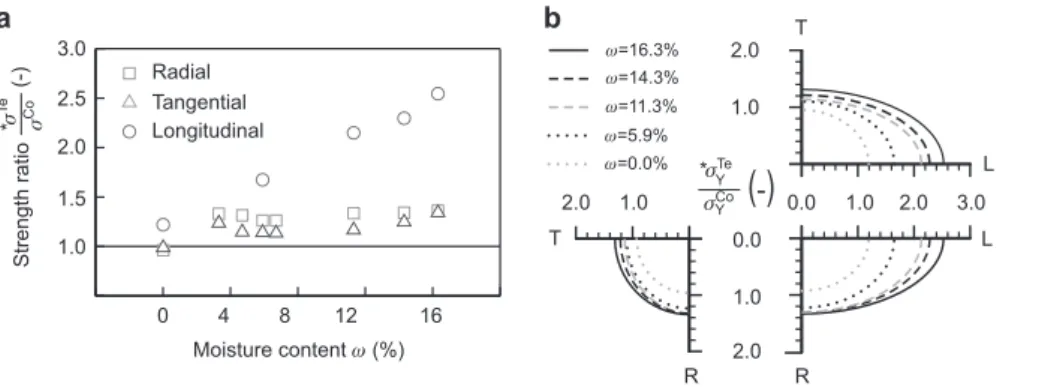
Under standard climatic conditions, wood in the L
direction exhibits approximately double the strength in Te
than in Co (Kollmann and Cote 1984 ). According to
Racz-kowski et al. (1995) , the Te-Co strength ratio at
ω = 12.0 %
for European beech wood amounts to 2.4. The Te-Co
strength ratio of 2.1 obtained at
ω = 11.3 % supports those
findings; however, the Te-Co strength asymmetry extends
with increasing MC (Figure 7 a). With a strength ratio of 1.2
at
ω ≈ 0 % in the L direction, the ratio is less than half of
the ratio obtained at
ω = 16.3 % . It is obvious that the Te-Co
strength asymmetry is driven mainly by changes in the Co
strength. Although the decrease in Te strength measured
between
ω ≈ 0 % and ω = 16.3 % in the L direction amounts to
23 % , the corresponding decrease in Co equals to 63 % . In
contrast to the L direction, the strength ratio in the R and
T directions is influenced by MC to a much lesser degree.
The moisture-dependent ratio for all MC levels averages
≈ 1.3 and applies to both R and T directions.
The strength asymmetry in-between the principal axes
is visualized in Figure 7b. Represented by the Te-Co yield
surface ratios (determined by applying the yield criterion
given in Resch and Kaliske 2010 and Saft and Kaliske
2011 using the
σ
Yfrom Table 3), the moisture-dependent
orthotropic Te-Co strength asymmetry is presented for all
planes of anisotropy. It should be emphasized that the
yield surface ratios are used exclusively as a description of
the strength behavior in-between the principal axes. Note
that, due to the stress-strain relationship in the L
direc-tion, the
σ
Yin Te is equal to
σ
UTSand the
σ
Yin Co is equal
to
σ
UCS.
Conclusions
The orthotropic mechanical behavior of wood is
signifi-cantly influenced by MC. Experimental data for beech
wood reveal a distinctive Te-Co asymmetry of the
mechan-ical behavior, which depends on MC. Demonstrated by
the Te-Co strength asymmetry, the moisture-dependent
inequalities between the Te and the Co behaviors are also
shown for the elastic properties. Known as the “ bimodular
behavior ” , the elastic Te-Co asymmetry is demonstrated
by the Young ’ s moduli in the R and T directions and
indi-vidual Poisson ’ s ratios. The obtained bimodularity
ques-tions the applicability of the theory of perfect elasticity
used to describe the elastic behavior of wood. Although,
for practical applications and under normal conditions,
Moisture content ω (%) 0 10 15 20 25 80 90 100 110 120 4 Longitudinal Radial Tangential 8 12 16
Ultimate tensile stress
σUTS
N
mm
2
()
Figure 6 Moisture-dependent ultimate Te stress σ UTS for European
beech wood. Moisture content ω (%) 0 1.0 1.5 2.0 3.0
a
b
2.5 4 Radial Tangential Longitudinal ω=16.3% ω=14.3% ω=11.3% ω=5.9% ω=0.0% 2.0 2.0 1.0 1.0 0.0 0.0 1.0 2.0 R R 1.0 2.0 3.0 L L T T 8 12 16 Strength ratio (-) *σ Te σ Co *σTe Y Y σCo(
-)
Figure 7 (a) Moisture-dependent Te-Co strength ratio ( σ Te / σ Co ) for European beech wood (* corresponds to σ
UTS / σ UCS in the L direction and
Te Co Y/ Y
σ σ in the R and T directions, respectively).
(b) Moisture-dependent Te-Co yield surface ratio for European beech wood (yield surface as defined in Resch and Kaliske 2010 and Saft and Kaliske 2011 ).
the equality assumption of the elastic properties in Te
and Co might be justified, under specific conditions,
bimodularity must be seriously considered. Neglecting
the inequality of the elastic behavior might have
conse-quences for sophisticated simulations, leading to
inaccu-rate results.
Acknowledgments:
The authors thank the Bundesamt
f ü r Umwelt, Fonds zur F ö rderung der Wald und
Holz-forschung, for the financial contribution to this research.
Received July 1, 2012; accepted October 31, 2012; previously published online December 8, 2012References
American Society for Testing and Materials (2011) ASTM-E8/ E8M-11. Standard Test Methods for Tension Testing of Metallic Materials.
American Society for Testing and Materials (2007) ASTM-D442-92. Standard Test Methods for Direct Moisture Content
Measurements of Wood and Wood-Base Materials. Barak, M.M., Curreyb, J.D., Weinera, S., Shahar, R. (2009) Are
tensile and compressive Young ’ s moduli of compact bone different ? J. Mech. Behav. Biomed. 2:51 – 60.
Benveniste, Y. (1985) The effective mechanical behaviour of composite materials with imperfect contact between the constituents. Mech. Mater. 4:197 – 208.
Bertoldi, K., Bigoni, D., Drugan, W.J. (2008) Nacre: an orthotropic and bimodular elastic material. Compos. Sci. Technol. 68:1363 – 1375.
Bodig, J., Jayne, B.A. Mechanics of Wood and Wood Composites. Krieger Publishing Co., Malabar, 1993.
Chahine, N.O., Wang, C.C., Hung, C.T., Ateshian, G.A. (2004) Anisotropic strain-dependent material properties of bovine articular cartilage in the transitional range from tension to compression. J. Biomech. 37:1251 – 1261.
Conners, T.E., Medvecz, C.J. (1992) Wood as a bimodular material. Wood Fiber Sci. 24:413 – 423.
Curnier, A., He, Q., Zysset, P. (1995) Conewise linear elastic materials. J. Elast. 37:1 – 38.
Destrade, M., Gilchrist, M.D., Motherway, J.A., Murphy, J.G. (2010) Bimodular rubber buckles early in bending. Mech. Mater. 42:469 – 476.
Deutsches Institut f ü r Normung e. V. (1976) 52 185 DIN 1976-09. Pr ü fung von Holz; Bestimmung der Druckfestigkeit parallel zur Faser.
Deutsches Institut f ü r Normung e. V. (1979) 52 188 DIN 1979-05. Pr ü fung von Holz; Bestimmung der Zugfestigkeit parallel zur Faser.
Deutsches Institut f ü r Normung e. V. (1979) 52 192 DIN 1979-05. Pr ü fung von Holz; Druckversuch quer zur Faser.
Feldman, L.A. (1987) Bimodular behaviour and crack closure in compression in a brittle material. J. Mater. Sci. 22:2789 – 2792. Gerhards, C.C. (1982) Effect of moisture content and temperature on
the mechanical properties of wood: an analysis of immediate effects. Wood Fiber Sci. 14:4 – 36.
Gibson, L.J., Ashby, M.F. Cellular Solids. Structure and Properties. Pergamon Press, Oxford, 1988.
Goulet, M. (1960) Die Abh ä ngigkeit der Querzugfestigkeit von Eichen, Buchen und Fichtenholz von Feuchtigkeit und Temperatur im Bereich von 0 ° bis 100 ° C. Holz Roh. Werkst. 18:325 – 331. Greenspan, L. (1977) Humidity fixed points of binary saturated
aqueous solutions. J. Res. Nat. Bur. Stand-A Phys. Chem. 81A:89 – 96.
Guo, Z., Zhang, X. (1987) Investigation of complete stress-deformation curves for concrete in tension. ACI Mater. J. 84:278 – 285.
Hering, S., Keunecke, D., Niemz, P. (2012a) Moisture-dependent orthotropic elasticity of beech wood. Wood Sci. Technol. 45:927 – 938.
Hering, S., Saft, S., Resch, E., Niemz, P., Kaliske, M. (2012b) Characterisation of moisture-dependent plasticity of beech wood and its application to a multi-surface plasticity model. Holzforschung 66:373 – 380.
Hill, C.A.S., Norton, A.J., Newman, G. (2010) The water vapour sorption properties of Sitka spruce determined using a dynamic vapour sorption apparatus. Wood Sci. Technol. 44:497 – 514.
Jones, R.M. Deformation theory of plasticity. Bull Ridge Publishing, Blacksburg, VA, 2009.
Katicha, S.W., Flintsch, G., Loulizi, A. (2011) Bimodular analysis of hot-mix asphalt. Int. J. Road Mater. Pavement Design 11:917 – 946.
Kersavage, P.C. (1973) Moisture content effect on tensile properties of individual Douglas-fir latewood tracheids. Wood Fiber Sci. 5:105 – 117.
Keunecke, D., Hering, S., Niemz, P. (2008) Three-dimensional elastic behaviour of common yew and Norway spruce. Wood Sci. Technol. 42:633 – 647.
Kollmann, F. (1956) Untersuchungen ü ber die Querzugfestigkeit der H ö lzer. Forstwiss. Centralbl. 75:304 – 318.
Kollmann, F.F.P., Cote, W.A. Principles of Wood Science and Technology. Springer-Verlag, Berlin, 1984.
Kretschmann, D.E., Green, D.W. (1996) Modelling moisture content-mechanical property relationships for clear southern pine. Wood Fiber Sci. 28:320 – 337.
Kufner, M. (1978) Elastizit ä tsmodul und Zugfestigkeit von Holz verschiedener Rohdichte in Abh ä ngigkeit vom Feuchtig-keitsgehalt. Holz Roh. Werkst. 36:435 – 439.
McBurney, R.S., Drow, J.T. (1962) The Elastic Properties of Wood: Young ’ s Moduli and Poisson ’ s Ratios of Douglas-Fir and Their Relations to Moisture Content. Forest Product Laboratory Report No. 1528-D, U.S. Department of Agriculture, Forest Service, Forest Products Laboratory, Madison, WI.
Neuhaus, F.H. (1983) Ü ber das elastische Verhalten von Fichtenholz in Abh ä ngigkeit von der Holzfeuchtigkeit. Holz Roh. Werkst. 41:21 – 25.
Niemz, P. Physik des Holzes und der Holzwerkstoffe. DRW-Verlag Weinbrenner GmbH & Co., Leinfelden-Echterdingen, 1993.
Ö stman, B.A.L. (1985) Wood tensile strength at temperatures and moisture contents simulating fire conditions. Wood Sci. Technol. 19:103 – 116.
Ozyhar, T., Hering, S., Sanabria, S.J., Niemz, P. (2012a) Determining moisture-dependent elastic characteristics of beech wood by means of ultrasonic waves. Wood Sci. Technol. Online First, DOI: 10.1007/s00226-012-0499-2.
Ozyhar, T., Hering, S., Niemz, P. (2012b) Moisture-dependent elastic and strength anisotropy of European beech wood in tension. J. Mater. Sci. 47:6141 – 6150.
Raczkowski, J., Jakub ó w, S., Majchrzak, A. (1995) Zale ż no ś ć mi ę dzy wytrzyma ł o ś ci ą drewna na rozci ą ganie i ś ciskanie wzd ł u ż w ł ó kien. Wp ł yw wilgotno ś ci. Folia Forestalia Polonica B 26:151 – 159.
Resch, E., Kaliske, M. (2010) Three-dimensional numerical analyses of load-bearing behavior and failure of multiple double-shear dowel-type connections in timber engineering. Comput. Struct. 88:165 – 177.
Ross, R.J. (Ed.) (2010) Wood Handbook: Wood as an Engineering Material. General Technical Report FPL-GTR 190, U.S. Department of Agriculture, Forest Service, Forest Products Laboratory, Madison, WI.
Saft, S., Kaliske, M. (2011) Numerical simulation of the ductile failure of mechanically and moisture loaded wooden structures. Comput. Struct. 89:2460 – 2470.
Salm é n, L., Burgert, I. (2009) Cell wall features with regard to mechanical performance. A review. COST Action E35 2004 – 2008: Wood machining – micromechanics and fracture. Holzforschung 63:121 – 129.
Sakagami, H., Matsumura, J., Oda, K. (2009) In situ visualization of hardwood microcracks occurring during drying. J. Wood Sci. 55:323 – 328.
Schniewind, A.P., Barrett, J.D. (1972) Wood as a linear orthotropic viscoelastic material. Wood Sci. Technol. 6:43 – 57.
Stamm, A.J. Wood and Cellulose Science. Ronald Press Co., New York, 1964.
Stevanic, J.S., Salm é n, L. (2009) Orientation of the wood polymers in the cell wall of spruce wood fibres. Holzforschung 63: 497 – 503.
Stimpson, B., Chen, R. (1993) Measurement of rock elastic moduli in tension and in compression and its practical significance. Can. Geotech. J. 30:338 – 347.
Takhashi, K., Chou, T.W. (1988) Transverse elastic moduli of undirectional fiber composites with interfacial debonding. Metall. Mater. Trans. A 19:129 – 135.
Tiemann, H.D. (1906) Effect of moisture upon the strength and stiffness of wood. Forest Service Bulletin 70, U.S. Department of Agriculture.
Turovtsev, G.V., Toropov, V.V. (2005) Identification of Fiber Composite Interface Properties using Changes in Natural Frequencies, 6th World Congresses of Structural and Multidis-ciplinary Optimatization, Rio de Janeiro.
Winandy, J.E., Rowell, R.M. (2005) Chemistry of Wood Strength. In: Handbook of Wood Chemistry and Wood Composites. (Ed.) Rowell, R.M. CRC Press, Madison, WI. pp. 303–347. Wommelsdorf, O. (1966) Dehnungs- und Querdehnungszahlen
von H ö lzern. Dissertation, Technische Hochschule Hannover.
Zemlyakov, I.P. (1965) On the difference in the moduli of elasticity of polyamides subjected to different kinds of deformation. Mech. Compos. Mater. 1:25 – 27.