HAL Id: hal-02310680
https://hal.insa-toulouse.fr/hal-02310680
Submitted on 10 Oct 2019HAL is a multi-disciplinary open access
archive for the deposit and dissemination of sci-entific research documents, whether they are pub-lished or not. The documents may come from teaching and research institutions in France or abroad, or from public or private research centers.
L’archive ouverte pluridisciplinaire HAL, est destinée au dépôt et à la diffusion de documents scientifiques de niveau recherche, publiés ou non, émanant des établissements d’enseignement et de recherche français ou étrangers, des laboratoires publics ou privés.
New approach for the measurement of gas permeability
and porosity accessible to gas in vacuum and under
pressure
Hognon Sogbossi, Jérôme Verdier, Stéphane Multon
To cite this version:
Hognon Sogbossi, Jérôme Verdier, Stéphane Multon. New approach for the measurement of gas permeability and porosity accessible to gas in vacuum and under pressure. Cement and Concrete Composites, Elsevier, 2019, 103, pp.59-70. �10.1016/j.cemconcomp.2019.04.032�. �hal-02310680�
1
New approach for the measurement of gas permeability and
1porosity accessible to gas in vacuum and under pressure
2Hognon Sogbossi*, Jérôme Verdier, Stéphane Multon 3
LMDC, Université de Toulouse, INSA, UPS, 135 Avenue de Rangueil, 31077 Toulouse cedex 04,
4
France
5
*Corresponding author: Email: sogbossi@insa-toulouse.fr 6
7 8
Abstract:
9
This study proposes new approaches for measuring the gas permeability and the accessible 10
porosity of porous media. Two techniques are used: the usual permeameter, of the Cembureau 11
type (measurement under pressure), and a new technique named a “double-cell” permeameter, 12
based on a vacuum technique. Theoretical and experimental results point out that the apparent 13
permeability measured in vacuum is proportional to the permeability measured under 14
pressure. For a given pressure, the theoretical expression of the coefficients of proportionality 15
leads to a quasi-constant value for a very large range of concrete permeability. A new 16
equation is also proposed to evaluate the accessible porosity from the Time to Reach Steady 17
State (TRSS) recorded during permeability tests. Concordance between the porosity 18
accessible to gas obtained in this way and the porosity measured by the usual technique of 19
hydrostatic weighing is discussed. 20
21 22
Keywords:
23
Transfer, permeability, porosity, vacuum, laminar flow, Knudsen flow. 24
2
1 Introduction
26
The viability of many structures depends on the concrete transport properties [1]–[5], which 27
can be evaluated using the permeability. This permeability is quantified by the fluid flow 28
through the porous medium under the effect of a pressure gradient. During permeability tests, 29
the gas flow is quantified by measuring the volume flow rate through the porous medium in 30
steady state (SS). 31
In the laboratory, flow measurements for gas permeability calculations are generally made 32
under pressure with the Cembureau permeameter [6], [7]. This device needs a measurement 33
cell and the specimen is inaccessible during flow measurements, so it is not easy to combine 34
the gas permeability measurement with other tests [8]. Moreover, in situ permeability can be 35
measured under vacuum. So, a new device that operates in low vacuum and is called a 36
"double-cell" is used in this study. It can be used for example to perform monitoring of air 37
permeability under a cyclic mechanical load [9]. 38
The parameters that influence the gas flow rate and the corresponding permeability can be 39
associated with the nature of the gas flow in the porous network [10]. In this paper, the term 40
“flow regime” is used to name the nature of gas flows. The gas flow regime can be continuum 41
or laminar flow, slip flow, transition flow, or free molecular or Knudsen flow [11]–[14]. Each 42
flow regime contributes to the total apparent flow rate in a different proportion and the 43
proportion can differ for measurements under pressure or in vacuum. For a better analysis of 44
the permeability measurements, it is therefore important to first determine the contribution of 45
each of the apparent flow modes to the total apparent flow [15]. In this study, the porous 46
network is analysed using the time to reach steady state (TRSS), apparent permeability, and 47
porosity. The TRSS is closely related to the characterization of connectivity and pore 48
tortuosity [9], [16]. 49
The transfer properties of concrete are strongly influenced by its connected porosity. The 50
porosity of concrete is measured in the laboratory by hydrostatic weighing (the method 51
described in standard NF P18-459 is generally used [6], [17]), by mercury intrusion, by 52
nitrogen sorption or by water sorption [18]. These methods take quite a time to perform 53
(generally one to two weeks) depending on the porosity range of the material. During the 54
measurement of steady-state apparent flow, the TRSS is a function of the porosity, its 55
connectivity and its fineness. Therefore, an original equation between the TRSS, the 56
permeability (or flow rate) and the accessible porosity volume is proposed. In this paper, the 57
3 porosity obtained with this method is compared to the accessible porosity to water obtained 58
with usual hydrostatic weighing. 59
The first objective of this study is to establish and analyse an experimental database that 60
compares permeability obtained from air flow measured in vacuum and under pressure. The 61
second objective is the analysis of transfer properties to determine the characteristic 62
permeability for an absolute test pressure of 2 bars, ka2bars,and the intrinsic permeability ki
63
using a single value of apparent permeability obtained in vacuum or under pressure. The third 64
objective concerns a new approach for the calculation of porosity accessible to gas from the 65
Time to Reach Steady State (TRSS). 66
2 Materials and methods
672.1 Materials
68
To compare the permeability obtained in vacuum and under pressure, tests were performed on 69
two ordinary concretes [9], [19]. Their common characteristics are: the same cement CEM I 70
52.5 NCE CP2 NF: 320 kg/m3 and the ratio Gravel / Sand is equal to 0.83. Plain concrete 71
samples and reinforced samples were tested. Two batches of concrete (A and B) were used for 72
the plain concrete samples. The ratios water / cement are respectively equal to 0.52 for batch 73
A and 0.62 for batch B. 74
The concrete of batch A (W/C = 0.52) was used for some plain samples and was 75
representative of the concrete walls of a power plant and was chosen as part of a national 76
project [20]. The concrete of batch B (W/C = 0.62) was used for some plain samples and for 77
reinforced samples. 78
Reinforced samples were used in order to test the limits of validity of the methods proposed in 79
this paper. It was important to test the measurements and the analysis on samples with 80
significant defects. Specific reinforced samples with embedded steel bars were used to obtain 81
samples with preferential percolation paths as explained in [9], [19]. Such percolation paths 82
have large impact on the apparent permeability of the sample and perhaps on their porosity. It 83
was thus interesting to test the present method on such samples. Figure 1 presents all the 84
configurations that were tested during this study and the water porosity of samples for drying 85
at 105°C. 86
The length of the steel bars lay between 20 and 50 mm and the concrete sample thickness was 87
50 mm. A steel bar 50 mm long thus crossed the samples completely (Figure 1). 88
4 89
- Sr is the saturation degree; - i identifies the sample: i =1; 2; 3.
Figure 1: Types and codes of samples [9], [19]
90
2.2 Methods
91
2.2.1 Permeability 92
Flow measurements for gas permeability calculations are usually performed with the 93
Cembureau permeameter in laboratory [6], [7]. The standard XP P 18-463 defines one 94
permeability value as a standard: the apparent permeability calculated from the flow rate for 95
an absolute test pressure of 2 bars. In this study this apparent permeability (designated as 96
ka2bars) is used as the characteristic permeability for a given sample.
97
Performing measurement of permeability under vacuum in laboratory [9] helps to better 98
understand the permeability measurement devices which operate under vacuum used on site 99
[21]. The gas flow regime differs according to the mechanism controlling the gas transfer 100
(under pressure or in vacuum; in particular, the molecular free path is not the same under 101
pressure and in low vacuum). This impacts the evaluation of the material permeability. The 102
literature provides few information on permeability measurements in vacuum at steady-state 103
or on the comparison between permeability measured under pressure and in vacuum. To 104
obtain comparative results with the different methods used in the field and in laboratory, it is 105
important, first, to acquire valid results for the two techniques on the same sample and then to 106
analyse the determination of the permeability in the steady state with the vacuum technique. 107
This is one of the objectives of the new “double-cell” device presented here. 108
2.2.2 Porosity 109
The accessible porosity is another fundamental property for transfer analysis. Until now, the 110
methods used to evaluate this durability indicator have not always been relevant for the 111
evaluation of the gas permeability of cementitious materials, as the porosity is often measured 112
by a hydrostatic weighing method [6], [17]: 113
5 114
where ∅𝑤 is the water porosity (%), 𝑀𝑎𝑖𝑟 is the mass of the saturated sample measured in air,
115
𝑀𝑤 is the mass of the saturated sample measured in water and 𝑀𝑑𝑟𝑦 is the mass of the sample 116
measured after drying. 117
The global theoretical porosity accessible to gas can be evaluated according to the saturation 118
degree by: 119
where ∅g is the porosity accessible to gas (%) and Sr the saturation degree. 120
Due to the geometry of the pores (connectivity, constrictivity, dead arms), water porosity 121
cannot be exactly the same as the porosity accessible to gas that participates in the flow 122
during a permeability test. Consequently, comparisons between experimental data on 123
porosity-permeability and the predictive calculations performed with different models are 124
often disappointing [22], [23]. Some researchers have explained these differences by the 125
approximations made in the description of the microstructure in the models as well as on the 126
uncertainties regarding the determination of their input quantities. 127
In addition, the measurement of porosity with a hydrostatic weighing method requiring drying 128
in an oven may be potentially destructive for some specimens. Since the air does not react 129
with the chemical components of cementitious material, a new approach for gas porosity 130
calculation based on an air permeability test is proposed in this paper. 131
3 Experimental procedures
1323.1 Permeability under pressure
133
Figure 2 gives an overview of the Cembureau apparatus [7], [24]. The main elements are: an 134
air supply cylinder fitted with a pressure reducing valve, a precision pressure regulator, a 135
pressure gauge, the permeability cell, a flow meter and a computer to record the air flow. 136 137 ∅𝑤 = 𝑀𝑎𝑖𝑟 − 𝑀𝑑𝑟𝑦 𝑀𝑎𝑖𝑟− 𝑀𝑤 × 100 (Eq. 1) ∅g = (1 − 𝑆𝑟)∅𝑤 (Eq. 2)
6
Figure 2: Cembureau device for air flow measurement under pressure 3.2 Permeability under vacuum
138
Figure 3 gives an overview of the double-cell apparatus to measure permeability under 139
vacuum. 140
Figure 3: Double cell device for air flow measurement under vacuum
The air volume flow measurement protocol is the same as that of the Cembureau 141
permeameter. However, the double cell device differs from the Cembureau by the following 142
points: 143
- The permeability cell is replaced by two cells, one glued to each side face of the sample. 144
The lateral faces of the sample are then sealed by means of a fixing / sealing glue. It is 145
also possible to use the Cembureau cell when there is no necessity to access the sample 146
during the test; this was done in the present study to perform under vacuum 147
7 measurements in the same conditions as the measurements with the Cembureau 148
technique on the same sample. 149
- The air supply bottle is replaced by a 4-head diaphragm vacuum pump (pump speed of 150
13 l/min), which facilitates the mobility of the double cell experimental device 151
compared to the Cembureau device. The vacuum limit of the pump is 0.5 mbar. 152
The pressure regulator is replaced by an ultra-sensitive needle valve (Series 1300 straight-153
through, orifice 1.19 mm in 316 stainless steel). A manometer (Vacuubrand DCP 3000; 154
pressure range 0.1 to 1080 mbar with digital display from 0.1 to 1100 mbar absolute) is used 155
to measure the sample outlet pressure. Its accuracy is ± 1 mbar, which, according to our 156
results, is sufficient since a variation of 1 mbar induces a maximum variation of 0.1% on the 157
apparent permeability. 158
The reproducibility of test has been studied [9]. In all cases (plain concrete samples or 159
reinforced concrete samples), the maximum relative errors obtained are lower than 1.5% for 160
the air flow Q, 1.5% for the apparent permeability, and 3% for the TRSS. 161
3.3 Conditioning of samples
162
To obtain different values of porosity accessible to gas, the samples were tested at different 163
saturation degrees. To achieve each saturation degree, the samples underwent precise 164
conditioning [9]. This conditioning was inspired by the literature [25]–[27] trying to reduce 165
the water gradient and associated cracking during conditioning. 166
The specimens were weighed before and after the permeability measurements. No mass 167
variations were noted whatever the saturation degree, meaning that the global degree of 168
saturation stayed constant during the test. 169
8
4 Theoretical approach
171 4.1 Permeability 172 4.1.1 Principle 173The coefficient of permeability is defined by Darcy's law. The gas apparent permeability of a 174
porous medium is calculated using the Hagen-Poiseuille relationship for laminar flow of a 175
compressible fluid through a porous medium under steady-state conditions [24]. 176
𝑘𝑎 =
2 𝜇 𝐿
𝑆(𝑃𝐼2− 𝑃𝑂2)𝑃𝑄 (Eq. 3)
where 𝑃𝑄 is the inlet or outlet gaseous flow (𝑃𝐼𝑄𝐼 or 𝑃𝑂𝑄𝑂), 𝑃𝐼 and 𝑃𝑂 are respectively the 177
inlet and the outlet pressures (N.m-2), 𝑄𝐼 and 𝑄𝑂 are respectively the inlet and the outlet 178
volume flow rate (m3.s-1), S is the cross-sectional area of the specimen (m2), L is the thickness 179
of the sample in the direction of flow (m), and μ is the dynamic viscosity of the fluid (N.s.m -180
2).
181
The principle of measuring permeability in the steady state is thus based on the measurement 182
of the air flow 𝑄 crossing a sample subjected to a pressure gradient. The difference between 183
the two techniques used in this paper lies in the range of pressure applied to create the 184
gradient and the position where the air flow is measured: 185
- Cembureau technique (under pressure): the absolute applied pressure is the inlet 186
pressure (𝑃𝐼), which is greater than atmospheric pressure (Pa), and the outlet pressure
187
(𝑃𝑂) is the atmospheric pressure, Pa. The air flow measured is the outlet one and, in
188
Figure 2, 𝑃𝑄 = 𝑃𝑎𝑄𝑂. 189
- Double-cell technique (in vacuum): the absolute inlet pressure (𝑃𝐼) is equal to 190
atmospheric pressure, the absolute applied pressure is the outlet pressure (𝑃𝑂), which is
191
less than atmospheric pressure (vacuum). The air flow measured is the inlet one and, in 192
Figure 3, 𝑃𝑄 = 𝑃𝑎𝑄𝐼 [9]. 193
Klinkenberg linear theory (Eq. 4) is then used to determine the intrinsic permeability from the 194
mean pressure. Klinkenberg established that a linear relationship can be assumed between the 195
measured gas permeability (𝑘𝑎) and the inverse of the mean pressure (1/𝑃𝑚): 196
𝑘𝑎 = 𝐹𝐾𝑙𝑘𝑖 = 𝑘𝑖(1 +𝑏𝑘
𝑃𝑚) = 𝑘𝐿𝑎𝑚𝑖𝑛𝑎𝑟⏟ 𝑖 + 𝑘𝑛𝑜𝑛−𝑙𝑎𝑚𝑖𝑛𝑎𝑟⏟ 𝑖𝑏𝑘⁄ 𝑃𝑚 (Eq. 4)
where 𝑘𝑎 is the apparent permeability (also designated kaP in this paper to mention the
197
pressure, P, applied during the test), 𝑘𝑖 is the intrinsic permeability, FKl = 1+bK/Pm is the
9 Klinkenberg correction factor, 𝑃𝑚 is the mean pressure, and bK is the Klinkenberg gas
199
slippage factor defined by [28]: 200
𝑏𝑘 =4𝑐𝜆𝑃𝑚
𝑟 =
0.268
𝑟 (Eq. 5)
where c 1 [13] and Pm= 0.067 m.bar for air at a given pressure and r is the characteristic
201
radius in m. 202
4.1.2 Mean pressure during measurement 203
The evolution of the apparent permeability with pressure is thus generally plotted as a 204
function of the inverse of the mean pressure. As a linear profile of pressure is often assumed 205
in steady state, the mean pressure is evaluated by (𝑃𝐼+ 𝑃𝑂)/2. But, the pressure profile P(x) 206
in concrete in the steady state is not linear because of the gas compressibility [16], [29], [30] 207
and the mean pressure 𝑃𝑚 should not be taken equal to (𝑃𝐼+ 𝑃𝑂)/2.
208
In the steady state, the pressure profile P(x) can be evaluated from the following differential 209 equation [16], [31]: 210 (𝑑𝑃 𝑑𝑥) 2 + 𝑃𝑑 2𝑃 𝑑𝑥2 = 0 (Eq. 6)
One solution of this equation has been derived by Verdier [19] as presented below: 211 𝑃(𝑥) = (𝑃𝑂 2− 𝑃 𝐼2 𝐿 𝑥 + 𝑃𝐼2) 1/2 (Eq. 7) where 𝑃𝐼 is the sample inlet pressure and 𝑃𝑂 its outlet pressure.
212
By using the theorem of the mean value, we can deduce the true mean pressure in the steady 213 state as follows [9]: 214 𝑃𝑚 =1 𝐿∫ ( 𝑃𝑂2− 𝑃𝐼2 𝐿 𝑥 + 𝑃𝐼2) 1/2 𝐿 0 𝑑𝑥 (Eq. 8)
The mean pressure 𝑃𝑚 can thus be evaluated from:
215 𝑃𝑚 = 2 3( 𝑃𝑂3− 𝑃𝐼3 𝑃𝑂2− 𝑃𝐼2 ) (Eq. 9)
This value is used in the following analysis. 216
10 4.1.3 Flow regime during measurement
217
To evaluate permeability reliably with Klinkenberg theory, the flow regime existing during 218
the measurement must be known. The Knudsen number is a dimensionless parameter 219
commonly used to classify flow regimes in small pores, where deviation from continuum flow 220
is important. This is the case for cement-based materials. It is defined as the ratio of the 221
molecular mean free path, λ (m), to a characteristic length, such as pore radius, r (m), and 222 is given by: 223 𝐾𝑛 =𝜆 𝑟 = 1 𝑟( 0.067 𝑃𝑚 ) (Eq. 10)
Where 𝑃𝑚 is the mean pressure in bar and the mean free path is evaluated by Pm= 0.067
224
m.bar for air at a given pressure [28]. The determination of the radius r, characteristic of the 225
percolation in a porous medium such as concrete is often difficult and constitutes a challenge 226
[14]. Theoretical and empirical equations can be proposed to approximate this characteristic 227
mean radius from a single apparent permeability [9]. The Knudsen number could then be 228
calculated based on this equivalent radius and thus on the type of flow regime identified. 229
Flow regimes can be classified according to the Knudsen number as shown in Figure 4. 230
Figure 4: Knudsen number, flow regime classifications for porous media [14], [32], [33]
The flow regime in a cementitious porous material is generally a transition flow between 231
laminar, slip and molecular regimes [14]. So, in this study, from Figure 4, we firstly make the 232
assumption that the Knudsen number lies between 0.1 and 10. This allows us to use the 233
Klinkenberg theory for the determination of the intrinsic permeability as is usually done in the 234
literature. 235
0.01 0.1 10 Kn
Viscous flow Slip flow Transition flow Knudsen flow
Fluid assumed to be immobile at the pore wall
Slip occurs at the pore wall.
In addition to slip flow, free molecular flow appears
Free molecular occurs when the pore-throat radius is very
small. Darcy’s equation for
laminar flow. No permeability correction is
generally required.
Even if Knudsen’s correction is more accurate, Klinkenberg’s correction is easier and is generally
used. Burnett’s equation with slip boundary conditions is also used.
Usually Knudsen and Lattice Boltzmann methods can be
11 The range of characteristic radius, r, that satisfies this condition can be theoretically deduced 236
from the Knudsen number range (Eq. 10). By combining the two ranges of pore radius 237
calculated (considering the lowest mean pressure used in this paper is 0.67 bar for the 238
measurement in vacuum and 1.5 bars for the measurement under pressure), it is theoretically 239
assumed here that Klinkenberg’s correction can be applied for r lying between 0.01 and 0.4 240
m. These assumptions on Knudsen number and on the pore radius, r, have been verified 241
from the permeability calculations. Kn is always found to be lower than 10 under pressure and 242
in a vacuum. The flow regime is then a transition between laminar and molecular flow. It 243
indicates that the application of Klinkenberg's theory is possible [9]. 244
4.1.4 Comparison of permeability obtained under pressure and under vacuum 245
Relations between Klinkenberg equations (Eq. 4) and (Eq. 5) can be used to establish a 246
relation between the reference permeability, ka2bars, obtained under pressure and the apparent
247
permeability obtained in a vacuum, 𝑘𝑎𝑷. As 4𝑐𝜆𝑃𝑚= 0.268 μ𝑚. 𝑏𝑎𝑟 for any air pressure 248
[34], the Klinkenberg equation can be rewritten as: 249
So, the ratio between the apparent permeability for PI = 2 bars and the apparent permeability
250
for a given PI = P is:
251
This ratio between apparent permeability is then: 252
where CP is a theoretical, non-dimensional coefficient:
253
where 𝑟 is the characteristic radius and Pm is the mean pressure in bar.
254
Figure 5 presents the evolution of CP with the characteristic radius, r.
255 𝑘𝑎 = 𝑘𝑖(1 +𝑏𝑘 1 𝑃𝑚) = 𝑘𝑖(1 + 4𝑐𝜆𝑃𝑚 𝑟 1 𝑃𝑚) = 𝑘𝑖(1 + 0.268 𝑟 1 𝑃𝑚) (Eq. 11) 𝑘𝑎𝟐𝒃𝒂𝒓𝒔 𝑘𝑎𝑷 = 𝑘𝑖(1 +0.268𝑟 𝟏. 𝟓𝟔𝟖𝟏 ) 𝑘𝑖(1 +0.268𝑟 𝑷𝟏 𝒎) = 𝐶𝑷 (Eq. 12) 𝑘𝑎2𝑏𝑎𝑟𝑠 = 𝐶𝑷 𝑘𝑎𝑃 (Eq. 13) 𝐶𝑃 = 𝑟 + 0.171 𝑟 + 0.268 𝑃⁄ 𝑚 (Eq. 14)
12
Figure 5: Evolution of CP as function of characteristic radius r
When r is very small, CP is high for under pressure measurement: the slip flow evaluated
256
through the Klinkenberg slippage factor, bK, is high. This is in accordance with the evolution
257
of the Knudsen number: Kn is inversely proportional to radius r (Eq. 10), so Kn is higher for 258
smaller r. When r increases, the Knudsen number decreases, the slippage factor bK also
259
decreases, and the flow regime tends to laminar flow. For very large radius, the apparent 260
permeability is equal to the intrinsic permeability. This occurs with highly porous media, such 261
as rubberized cement-based composite [35]. 262
In the range assumed in this paper for the pore radius r, in cementitious materials (r lies 263
between 0.01 and 0.4 m - this assumption has been verified in [9]) the coefficient CP shows
264
small variations (Figure 5). A mean value of CP can be used, evaluated with the mean value
265 theorem as: 266 Mean value of 𝐶𝑃 = 1 0.4 − 0.01∫ ( 𝑟 + 0.171 𝑟 + 0.268 𝑃⁄ 𝑚) 0.4 0.01 𝑑𝑟 (Eq. 15)
The mean values of CP are presented in Table 1. Without knowing the real value of r, the
267
relation of (Eq. 13) can be used to evaluate the apparent permeability as a function of the 268
mean pressure given in Table 1. 269
13
Table 1. Main values of CP when r is between 0.01 and 0.4 m as a function of the mean
271
pressure Pm
272
Measurement technique
Absolute Pressure (bars)
𝐶𝑃 (Eq. 15) Inlet PI Outlet PO Mean Pm (PI + PO)/2 Mean Pm (Eq. 9) Cembureau 2.0 1.013 (1 atm) 1.51 1.57 1.00 3.0 2.01 2.18 1.17 4.0 2.51 2.81 1.30 5.0 3.01 3.46 1.41 Double cell 1.013 (1 atm) 0.0005 0.51 0.67 0.61 0.050 0.53 0.68 0.61 0.150 0.58 0.69 0.62 0.250 0.63 0.71 0.63 273 4.1.5 Permeability determination 274
We can thus propose the calculation of intrinsic permeability from a single reference value 275
ka2bars. Using (Eq. 13) and CP values in Table 1, ka2bars can be calculated from any apparent
276
permeability obtained under vacuum with the double cell technique. With (Eq. 13) and CP
277
values in Table 1, the apparent permeabilities ka3bars, ka4bars, ka5bars can be calculated from a
278
single ka2bars. The intrinsic permeability ki can then be extrapolated to infinite pressure by
279
plotting ka2bars, ka3bars, ka4bars, ka5bars as a function of the inverse of the mean pressure
280
(Klinkenberg theory). In the following, the calculated coefficients CP are validated on the
281
experimental database established in this paper and then on some literature data. 282
4.2 Measurement of porosity accessible to gas
283
Porosity accessible to gas can be calculated from the TRSS and apparent permeability. This 284
equation is based on the balance of the number of air particles flowing in the porous network 285
due to the application of the pressure gradient to the steady state. For the sake of simplicity, 286
only the demonstration based on measurement with the double-cell technique under vacuum 287
is presented. The same demonstration can be made under pressure and gives the same results 288
as the solution does not imply any particular assumptions. 289
The initial conditions for the test with the double-cell technique are first recalled: 290
- The flow is unidirectional along the length, L, of the sample. 291
14 - The pressure profile in the concrete is P(x). The boundary conditions are those 292
described in Figure 3: the inlet pressure, PI, is equal to the atmospheric pressure, Pa, at
293
x = 0 and the outlet pressure is PO at x = L.
294
- t is the time during which the vacuum is applied; its maximum value is the TRSS 295
(noted tRSS in the following equations). It is the time beyond which the mass flow is
296
constant in any cross section of the sample. It is also the time beyond which the 297
pressure profile in the concrete no longer varies. 298
- Y is the thickness of the sample reached by the vacuum pressure at any time t. 299
Figure 6 shows the evolution of pressure profile in concrete during air flow measurement. 300
Figure 6: Evolution of pressure profiles until steady state for a sample (L = 5.2 cm) [9]
At the beginning of vacuum application, t = 0 s and the depth impacted by the vacuum is Y0 =
301
0. At any moment t (t > 0) at the beginning of the application of the vacuum (10 s for 302
example), a depth Y is impacted by the vacuum. 303
The air volume of the pores impacted during this time t and the corresponding number of air 304
particles are, respectively: 305 𝑉 = 𝐴𝑌∅g (Eq. 16) 𝑁 =𝑃𝑚. 𝑉 𝐵. 𝑇 = 𝑃𝑚 𝐵𝑇𝑆𝑌∅g (Eq. 17)
where Pm is the mean pressure at depth Y impacted by the vacuum during t (s), V is the air
306
volume in pores of the zone impacted by the vacuum (m3), S is the area of the sample section, 307
∅g is the porosity accessible to gas and B is the Boltzmann number. 308
During any time interval dt, the vacuum affects a new front of air particles dN since the depth 309
Y increases by dY. From (Eq. 17), it can be written: 310
15 𝑑𝑁 =𝑆 ∅g
𝐵𝑇 𝑃𝑚𝑑𝑌 (Eq. 18)
Also, the Hagen-Poiseuille equation (Eq. 3) gives the volume, dV, of gas flowing in the cell 311
under the pressure gradient (𝑃1− 𝑃2) over the distance Y into concrete.
312 𝑑𝑉 =𝑘𝑎𝑑𝑆 2𝜇 𝑃𝐼2− 𝑃𝑂2 𝑃𝑂𝑌 𝑑𝑡 (Eq. 19) This volume of air is at the outlet pressure PO and, in terms of the number of air particles, it
313
corresponds to: 314
𝑑𝑁 =𝑃𝑂𝑑𝑉
𝐵𝑇 (Eq. 20)
From the three previous relationships, it can be written: 315 316 𝑑𝑁 =𝑃𝑂𝑑𝑉 𝐵𝑇 = 𝑃𝑂 𝐵𝑇 𝑘𝑎𝑑 2𝜇 𝑃𝐼2− 𝑃𝑂2 𝑃𝑂𝑌 𝑆𝑑𝑡 = 𝑆 ∅g 𝐵𝑇 𝑃𝑚𝑑𝑌 (Eq. 21) After simplification, it can be deduced that:
317
𝑌𝑑𝑌 =𝑘𝑎(𝑃𝐼
2− 𝑃 𝑂2)
2𝜇∅g𝑃𝑚 𝑑𝑡 (Eq. 22)
In the steady state, the mean pressure Pm has reached its stabilized value so, by integrating the
318
previous relation, the depth affected by the vacuum at any time t can be calculated from: 319
1 2𝑌2 =
𝑘𝑎(𝑃𝐼2− 𝑃𝑂2)
2𝜇∅g𝑃𝑚 𝑡 (Eq. 23)
At the steady state, t = tRSS, Y = L, and Pm is given by (Eq. 9), so the porosity can be evaluated
320 from: 321 ∅g =𝑘𝑎(𝑃𝐼 2− 𝑃 𝑂2) 𝜇𝐿2𝑃 𝑚 𝑡𝑅𝑆𝑆 = 3 2 𝑘𝑎 𝜇𝐿2 (𝑃𝐼2− 𝑃𝑂2) 2 𝑃𝐼3− 𝑃𝑂3 𝑡𝑅𝑆𝑆 (Eq. 24) Considering the Hagen-Poiseuille equation (Eq. 3), ∅g, the porosity accessible to gas, can also
322
be written as a function of the measured air flow 𝑃𝑄𝑉: 323
where the gaseous flow 𝑃𝑄𝑉 is the same as used in (Eq. 3). It is equal to 𝑃𝑎𝑄𝑂 if the 324
Cembureau technique is used and 𝑃𝑎𝑄𝐼 with the double-cell technique. Regarding the sample, 325 ∅g = 1 𝑆𝐿( 2𝑃𝑄 𝑃𝑚 𝑡𝑅𝑆𝑆) = 3𝑃𝑄 𝑆𝐿 ( 𝑃𝑂2− 𝑃𝐼2 𝑃𝑂3− 𝑃𝐼3) 𝑡𝑅𝑆𝑆 (Eq. 25)
16 𝑆𝐿 is the total apparent volume and the expression 2𝑃𝑄𝑡𝑅𝑆𝑆/𝑃𝑚 can leads then to an
326
estimation of the volume of percolating pores. 327
5 Results and discussion
3285.1 Permeability under vacuum and under pressure
329
5.1.1 Experimental results 330
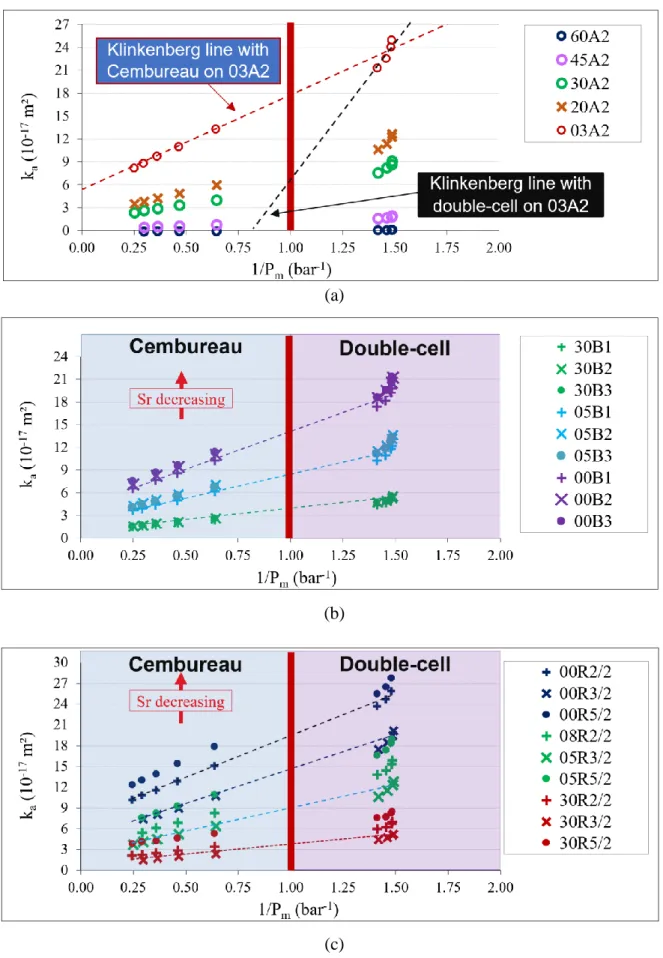
Figure 7 presents the apparent permeability, ka, as a function of the inverse of the mean
331
pressure Pm for one sample of each type: one plain sample from batch A (a), one plain sample
332
from batch B (b), one each of reinforced samples R2, R3 and R5 (c). The results obtained on 333
the other samples led to the same analysis. 334
The apparent permeability under vacuum (1/Pm > 1) is always greater than the permeability
335
under pressure obtained under pressure with the Cembureau permeameter (1/Pm < 1). This
336
result is consistent with the evolution of the molecular and slip flows as the non-laminar 337
contribution to air flow is inversely proportional to the pressure (Eq. 4). As the mean pressure 338
with the double-cell under vacuum is always lower than the mean pressure in conditions of 339
under pressure (Table 1), the apparent permeability under vacuum conditions must be greater 340
than the one obtained under pressure. 341
17 (a)
(b)
(c)
Figure 7: Apparent permeability and Klinkenberg lines for plain samples of two different batches (a and b) and for samples with embedded steel bars (c)
18 As illustrated in Figure 7-a, if Klinkenberg lines are plotted from the apparent permeability 343
obtained under vacuum, high slopes are obtained, and a loss of linearity is observed: the non-344
laminar contribution is greater in a vacuum, and molecular flow increases as the vacuum 345
becomes harder. This mechanism leads to obtain higher slopes under vacuum than under 346
pressure. As a result, linear extrapolation of the experimental points leads to negative intrinsic 347
permeability. This representation of Klinkenberg theory does not allow intrinsic permeability 348
to be estimated but seems indicative of the evolution in molecular flow with the vacuum. 349
Moreover, it highlights the difference of flow nature between the two techniques. 350
Nevertheless, for each sample at any saturation degree, the apparent permeability under 351
vacuum obtained with the double-cell technique and plotted versus the inverse of the mean 352
pressure is located near the reference Klinkenberg line established from the Cembureau 353
measurement. For low pressures, the points deviate from the line, which also reflects the 354
limits of Klinkenberg's approach at these pressures. 355
Experimental results can also be analysed with regard to the relative permeability for the 356
quantification of the permeability evolution with saturation degree. It is defined as: 357
𝑘𝑆𝑟,𝑅𝑒𝑙 =
𝑘𝑆𝑟
𝑘𝑆𝑟𝑓 (Eq. 26)
where 𝑘𝑆𝑟,𝑅𝑒𝑙 is the relative permeability as a function of the saturation degree, 𝑘𝑆𝑟 is the 358
permeability at a given saturation degree and 𝑘𝑆𝑟𝑓 is the permeability at the lowest saturation 359
degree reached during the drying. The 𝑘𝑆𝑟𝑓 considered in this study is obtained for Sr = 3% 360
after drying at 80 °C to constant mass. 361
As it has been well described in the literature [2], [9], [19], [36], the concrete permeability 362
increases when the saturation degree decreases: during drying, the flow paths are released 363
from the free water and the air flow through concrete can increase. Moreover, drying can 364
induce damage and micro-cracking that increases the percolating network. This expected 365
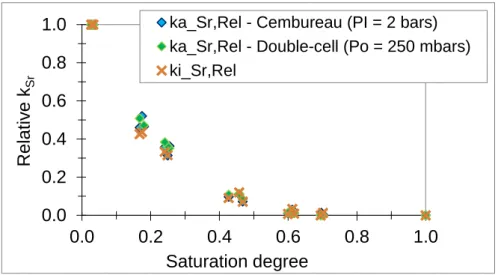
result is effectively obtained for the two techniques. Figure 8 presents the relative apparent 366
permeability for the two techniques used in this paper for 𝑃𝐼 = 2 bars (Cembureau) and 𝑃𝑂 = 367
250 mbars (double-cell) and the relative intrinsic permeability. 368
19
Figure 8: Relative permeability according to saturation degree
Whatever the type of permeability used (intrinsic permeability according to Klinkenberg, ki,
369
apparent permeability, ka2bars, with the Cembureau technique, apparent permeability, ka250mbars,
370
with the double-cell technique), the evolutions of the relative permeability with the saturation 371
degree were similar. This means that, without any other numerical processing, the apparent 372
permeability obtained with the double-cell technique (or with the Cembureau technique) can 373
be used to characterize the relative permeability. 374
5.1.2 Validation of the theoretical approach for permeability 375
The objective is to determine ka2bars and ki from any single apparent permeability given by the
376
double-cell technique. Here is an example of the calculation protocol when the input data is 377
apparent permeability obtained with the double cell for PO = 250 mbars: ka250mbars.
378
- For PO = 250 mbars, CP = 0.63 in Table 1. Then (Eq. 13) gives the value of ka2bars.
379
- With this value of ka2bars and with (Eq. 13), we calculate: ka3bars (CP = 1.17 in Table 1),
380
ka4bars (CP = 1.30 in Table 1), ka5bars (CP = 1.41 in Table 1)
381
Figure 9 presents the results of ka2bars and ki predictions when the input data are ka250mbars or
382 ka150mbars or ka0.5mbar. 383 0.0 0.2 0.4 0.6 0.8 1.0 0.0 0.2 0.4 0.6 0.8 1.0 Rela tiv e kSr Saturation degree
ka_Sr,Rel - Cembureau (PI = 2 bars) ka_Sr,Rel - Double-cell (Po = 250 mbars) ki_Sr,Rel
20
Figure 9. Comparison of experimental and approached permeability
The relative error between the permeability approximated with the proposed method and the 384
experimental value ka2bars is also presented in Figure 9:
385
- The lowest vacuum pressure leads to the greatest relative error: this is in accordance 386
with the assumption on flow regime. If the vacuum pressure is reduced, the flow rate 387
no longer increases (between PO = 50 mbar and PO = 0.5 mbar the permeability
388
increases by only 3%) whereas the molecular flow becomes more and more important, 389
leading to the limits of use of Klinkenberg's theory. Then, for ka2bars and ki prediction
390
with the double-cell technique, measurement should be performed with PO equal to or
391
greater than 50 mbars. 392
- Using permeability for PO equal to or greater than 50 mbars, the relative error is
393
always lower than 20%. Its mean value is about 7% and 12% when the calculations 394
are done with ka250bars and ka50mbar, respectively, which is considered as acceptable in
395
this paper because of the usual deviation obtained on permeability measurement, 396
which can reach 20% on 3 samples of a given batch. 397
The values of the coefficients CP (Table 1) are thus validated on the concrete studied in this
398
work for various saturation degrees. The proposed approach makes it possible to estimate the 399
apparent and intrinsic permeability from one value of apparent permeability. 400
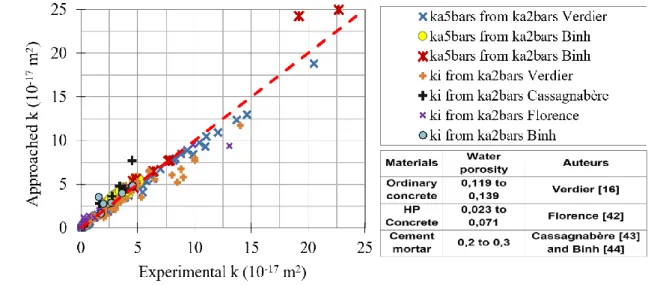
The theoretical approach is also validated on experimental literature values. The objective is 401
to determine apparent permeability at any pressure and the intrinsic permeability ki from a
402
single apparent permeability ka2bars using (Eq. 13) and the value of CP presented in Table 1,
21 for concrete of other experiments drawn from the literature. The apparent permeability must 404
be calculated separately for inlet pressures, PI, equal to 3, 4 and 5 bars:
405
- Calculation of ka3bars: Pm = 2.18 and CP = 1.18 in Table 1,
406
- Calculation of ka4bars: Pm = 2.81 and CP = 1.31 in Table 1,
407
- Calculation of ka5bars: Pm = 3.46 and CP = 1.42 in Table 1,
408
- Plot of calculated apparent permeability versus 1/Pm to deduce ki.
409
Figure 10 presents the materials and the results (ka5bars and ki; the predicted ka4bars and ka3bars
410
show the same concordance) of this calculation protocol. 411
Porosity values are given for information. Porosity shows the porous extent of the concrete 412
used to validate the value of CP proposed in this work. The relative errors between the
413
experimental values and the values evaluated by this method is less than 20%, which is 414
acceptable according accuracy on experimental measurement [16]. 415
416
[16][37][38][39]
Figure 10: Validation of CP values on literature data
417
5.2 Porosity accessible to gas
418
5.2.1 Experimental results of the Time to Reach Steady State (TRSS) 419
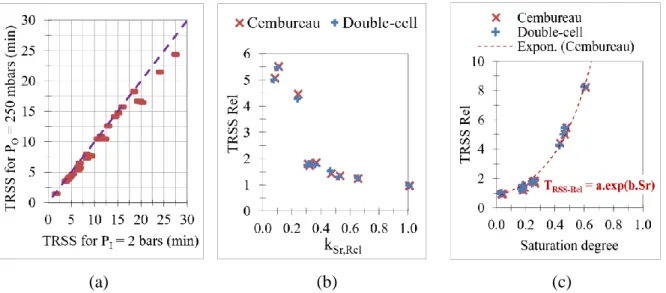
The porosity can be evaluated from the Time to Reach Steady State (TRSS) with (Eq. 25). 420
First, Figure 11-a compares the Time to Reach Steady State (TRSS) obtained with the two 421
techniques studied in this paper (under pressure in abscissa and under vacuum in ordinate). 422
The TRSS obtained with the two techniques are almost equal but the TRSS with Cembureau 423
are always slightly higher than those obtained with the double-cell technique. The apparent 424
22 permeability under vacuum (obtained with double-cell) is always higher than the permeability 425
obtained under pressure (with Cembureau). As the porous network is the same, the time 426
necessary for the gas particles to cross the network (TRSS) is shorter under vacuum. As for 427
permeability, it is interesting to analyse the relative TRSS. In this work, the relative TRSS 428
was defined as the relative permeability (ratio of the TRSS obtained for a given saturation 429
degree to the TRSS obtained for sample with a saturation degree of 3%). 430
(a) (b) (c)
Figure 11: TRSS with double-cell and Cembureau techniques (a), permeability (b) and TRSS as function of saturation degree (c)
Figure 11-b presents the evolution of relative TRSS as a function of the relative permeability. 431
When the relative permeability increases, the TRSS decreases. Considering that the TRSS is a 432
function of the percolation path (tortuosity, constrictivity, rugosity, pore distribution), the 433
impact of the pore tortuosity appears to be reduced for the highest permeability. The steady 434
state is reached quickly when the air molecules encounter few obstacles in the porous 435
network. Figure 11-c presents the evolution of TRSS as a function of the saturation degree 436
and confirms this analysis. When the saturation degree decreases, the flow paths become 437
progressively free of water and so air molecules encounter fewer obstacles and the steady 438
state is reached faster, and permeability increases. 439
An empirical model of relative TRSS can be proposed: 440
𝑇𝑅𝑆𝑆𝑅𝑒𝑙 = 𝑎. exp (𝑏. 𝑆𝑟) (Eq. 27)
where 𝑎 and 𝑏 are two parameters established experimentally for each type of material. For 441
the two batches of concrete tested in this paper 𝑎 and 𝑏 values are 0.78 and 3.92 for the plain 442
samples (Figure 11-c). It is important to note that the same values of 𝑎 and 𝑏 are obtained 443
with the Cembureau technique as with the double-cell technique. The double-cell technique 444
23 can characterize the evolution of the transport properties of concrete according to saturation 445
degree. 446
5.2.2 Validation of the theoretical approach for porosity 447
Figure 12 presents the porosity accessible to gas evaluated from TRSS (Eq. 25) for plain 448
samples with the two techniques (Cembureau and double-cell) and the theoretical porosity 449
evaluated from the total porosity accessible to water ((Eq. 1) and (Eq. 2)). Apparent 450
permeability ka2bars is also plotted in blue on a secondary axis, for comparative analysis in
451
Figure 12. In the case of very low permeability, the measurement of air flow may be not 452
possible (case of sample 60B1 with the double-cell technique in Figure 12). The air flow is 453
then equal to zero and there is no evaluation of TRSS, so the porosity deduced from the new 454
approach is equal to zero, which is not necessarily true. 455
When the measurement of air flow is possible with the two techniques, the porosity accessible 456
to gas obtained with both techniques is very similar (Figure 12): the absolute dispersion 457
between the two techniques is 0.4% ± 0.2%. This is within the range of the accuracy on the 458
measurement of porosity accessible to gas with the TRSS as presented in Figure 12. 459
Concerning the comparison with the measurement under water, the results show similar trends 460
according to the sample. 461
Figure 12: Accessible porosity from different models on plain samples for two batches A and B (theoretical porosity is evaluated from total porosity accessible to water (Eq. 1))
For most of the samples, the porosity deduced from measurement under water is higher than 462
the porosity measured by gas transfer (Figure 12). This can be explained by the fact that the 463
water porosity is the total accessible porosity whereas the porosity accessible to gas is the 464
porosity that contributes to percolation paths during permeability test. 465
24 During the usual measurement, water can partly fill some dead arms. For the porosity 466
calculated from TRSS through a permeability test, the porosity evaluated has to contribute to 467
the gas transfer paths. As a result, theoretical porosity deduced from water porosity evaluates 468
both open connected porosity and open non-connected porosity, while the porosity deduced 469
from the TRSS is very little affected by the open non-connected porosity. Thus, the porosity 470
calculated from the TRSS seems to be more representative of open-connected porosity. This 471
approach should be validated on other materials such as porous ceramics. 472
In some cases, the porosity deduced from measurement under water is smaller than the 473
porosity measured by gas transfer. This is mainly the case for saturation degrees lower than 474
3% for the first batch (A) for samples presenting the largest permeability (Figure 12). It is 475
particularly marked for two samples. The high permeability measured in these samples can be 476
explained by the creation of preferential paths of transfer during the last drying periods at 105 477
°C [40], [41]. Such paths can have large impacts on the transfer, and thus on the porosity 478
deduced from transfer, while the consequences for the apparent porosity volume are very 479
slight. 480
A comparison between the data of samples of the two batches 00A and 00B can complete this 481
analysis. It introduces the problem of the analysis of the permeability from water porosity. 482
The water porosity of samples 00B (around 19%) is higher than the water porosity of samples 483
00B (around 16%), but the permeability of samples 00B (12 x 10-17 m2) is lower than the 484
permeability of samples 00A (around 22 x 10-17 m2). This points out that the water porosity
485
cannot be effectively representative of gas percolation paths and so of gas permeability. 486
This result is more appreciable when we consider the results obtained on reinforced concrete 487
samples (Figure 13). Previous analyses have shown that only significant preferential 488
percolation paths can explain the differences of permeability of these samples [9], [19]. In 489
Figure 13, samples 30B, 05B and 00B are plain samples while all the other results are 490
obtained on reinforced samples (Figure 1). It appears clearly that the theoretical porosity 491
accessible to gas (deducted from the water porosity) cannot explain the changes in 492
permeability of these reinforced samples. The theoretical porosity indicates that the reinforced 493
samples and the plain samples have approximately the same porosity while the permeability 494
of reinforced samples is sometimes twice that of plain samples. 495
25
Figure 13: Accessible porosity calculated from water porosity and from TRSS
Only the porosities calculated from the TRSS as proposed in this study are sensitive to the 496
defect created by steel bar in these samples and enable the samples to be distinguished from 497
one another. The porosity calculated from apparent permeability and the TRSS thus appears 498
to be more representative of the gas percolation paths. 499
5.2.3 Discussion 500
There are some theoretical limits on the proposed approach for porosity calculation. In 501
presence of very high permeability or damaged samples, the TRSS should be much reduced 502
and so its experimental evaluation could be tainted with error. The lowest value of TRSS in 503
this paper was around 250 seconds with a maximum relative error equal to 3%, corresponding 504
to an absolute error of 7.5 seconds. For samples with TRSS around 30 seconds [31], and with 505
an absolute error of 7 seconds, the relative error becomes about 23%. This may lead to a 506
considerable error in the porosity calculation. Another limit of the proposed approach is that 507
the porosity calculated from TRSS is the porosity accessible to gas at the moment of the 508
permeability test for a given saturation degree. 509
Relative permeability can be assessed as a function of saturation degree [42] (Figure 8). In 510
this paper, it has been showed that the relative TRSS can also be evaluated as a function of 511
saturation degree (Figure 11-c). Combining these two empirical laws and the theoretical 512
relation between permeability, porosity and TRSS (Eq. 24) can lead to consistent prediction of 513
the porosity accessible to gas for a concrete. For the purpose of more reliable modelling of 514
transport into partially saturated concrete, there are two principal input data [29]: the 515
permeability and the porosity. When the given porosity is not representative of the path 516
26 accessible to gas, a third experimental data can be used to deduce the porosity accessible to 517
gas transfer (Eq. 24): the time to reach steady state (TRSS). 518
6 Conclusion
519The main objectives of this study have been to compare different techniques to determine the 520
apparent and intrinsic permeability and the porosity of concrete. Three specifics points were 521
studied: establishment of an experimental database on concrete air permeability and time to 522
reach steady state, analysis of transfer properties through permeability calculations, and 523
assessment of the porosity accessible to gas. 524
For the first time, air flow through concrete has been measured in vacuum with a double-cell 525
device and under pressure with the Cembureau technique in the steady state for identical 526
samples. The apparent permeability in low vacuum at steady state was calculated from the 527
Hagen Poiseuille equation and compared to the under-pressure technique for the same 528
samples. This apparent permeability obtained in vacuum from the double-cell was clearly 529
efficient for the determination of the relative permeability. 530
The second goal of this paper has been the analysis of transfer properties through permeability 531
calculation. The characteristic apparent permeability, ka2bars, was calculated from one apparent
532
permeability given by the double-cell technique. This characteristic permeability was 533
compared to the apparent permeability measured directly with the Cembureau technique. An 534
original relation between apparent permeability at different pressures was proposed and 535
validated, and the results showed good agreement between prediction and experimental 536
measurements. 537
Concerning the Time to Reach Steady State (TRSS), this study shows that this parameter can 538
be used to analyse the percolation paths regardless of the techniques used (double-cell or 539
Cembureau). An empirical relation was established for the relative TRSS as a function of 540
saturation degree. The porosity accessible to gas was calculated from a new relation between 541
the TRSS and the apparent permeability (or volumetric air flow). The results obtained from 542
the Cembureau technique and those obtained with the double-cell technique were in good 543
concordance. Moreover, these results obtained show that this porosity should be more 544
convincing than the water porosity for the evaluation of the percolation paths accessible to 545
gas. 546
27
7 Acknowledgment
547
The authors acknowledge the financial support provided by the project “Non-destructive 548
evaluation of containment of nuclear power plants” (ENDE) financed by the Programme 549
Investissement d’Avenir (PIA – Centre National de la Recherche Scientifique, délégation 550
Provence et Corse, France). 551
8 Conflict of Interest statement
552Conflict of Interest: The authors declare that they have no conflict of interest.
553
9 References
554[1] H. Hilsdorf and J. Kropp, Performance Criteria for Concrete Durability. CRC Press, 555
2004. 556
[2] A. Abbas, M. Carcasses, and J.-P. Ollivier, “Gas permeability of concrete in relation to 557
its degree of saturation,” Mater. Struct., vol. 32, no. 1, pp. 3–8, 1999. 558
[3] L. Basheer, J. Kropp, and D. J. Cleland, “Assessment of the durability of concrete from 559
its permeation properties : a review,” Constr. Build. Mater., vol. 15, no. 2–3, pp. 93–103, 560
Mar. 2001. 561
[4] J.-P. Ollivier, J.-M. Torrenti, and M. Carcasses, Propriétés physiques du béton et de ses 562
constituants. Hermes, Lavoisier, 2012.
563
[5] F. Ghasemzadeh, R. Rashetnia, D. Smyl, and M. Pour-Ghaz, “A comparison of methods 564
to evaluate mass transport in damaged mortar,” Cem. Concr. Compos., vol. 70, pp. 119– 565
129, Jul. 2016. 566
[6] AFPC-AFREM, Compte-rendu des journées techniques AFPC/AFREM. Durabilité des 567
bétons, “Méthodes recommandées pour la mesure des grandeurs associées à la
568
durabilité”, 11 and 12 december 1997, LMDC Toulouse / Réf. ATILH n°37864. 1997.
569
[7] Norme XP P18-463, Norme XP P18-463 - Essai pour béton durci - Essai de 570
perméabilité à l’air. 1999.
571
[8] V. Picandet, “Influence d’un endommagement mécanique sur la perméabilité et sur la 572
diffusivité hydrique des bétons,” Ph.D. Thesis, Ecole Centrale de Nantes, 2001. 573
[9] H. E. A. Sogbossi, “Etude de l’évolution de la perméabilité du béton en fonction de son 574
endommagement : transposition des résultats de laboratoire à la prédiction des débits de 575
fuite sur site,” Ph.D. Thesis, Université de Toulouse, Université Toulouse III - Paul 576
Sabatier, 2017. 577
[10] C. Villani, R. Loser, M. J. West, C. Di Bella, P. Lura, and W. J. Weiss, “An inter lab 578
comparison of gas transport testing procedures : Oxygen permeability and oxygen 579
diffusivity,” Cem. Concr. Compos., vol. 53, pp. 357–366, Oct. 2014. 580
[11] P. C. Carman, Flow of Gases Through Porous Media. Academic Press, 1956. 581
[12] D. Hoffman, B. Singh, and J. H. Thomas III, Handbook of vacuum science and 582
technology. Academic Press, 1997.
583
[13] L. J. Klinkenberg, “The permeability of porous media to liquids and gases,” Drilling and 584
production practice, American Petroleum Institute, 01-Jan-1941.
585
[14] A. S. Ziarani and R. Aguilera, “Knudsen’s permeability correction for tight porous 586
media,” Transp. Porous Media, vol. 91, no. 1, pp. 239–260, Jan. 2012. 587
28 [15] D. Perraton, P.- Aitcin, and A. Carles-Gibergues, “Mesure de la permeabilité aux gaz des 588
bétons : permeabilité apparente et permeabilité intrinsèque. Partie I - Validation des 589
concepts de Carman et de Klinkenberg dans le cas d’un BHP,” Bull. Lab. Ponts 590
Chaussées, no. 221, May 1999.
591
[16] J. Verdier, “Contribution à la caractérisation de l’évolution du taux de fuite des enceintes 592
de confinement du parc nucléaire,” Ph.D. Thesis, Université de Toulouse, Université 593
Toulouse III-Paul Sabatier, 2001. 594
[17] Norme NF P18-459, Norme NF P18-459 - Béton - Essai pour béton durci - Essai de 595
porosité et de masse volumique. 2010.
596
[18] V. Baroghel-Bouny et al., “Méthodes d’essai N°58 : Caractéristiques microstructurales 597
et propriétés relatives à la durabilité des bétons : Méthodes de mesure et d’essai de 598
laboratoire,” Tech. Méthodes Lab. Ponts Chaussées-LCPC Cerca Con Google, 2002. 599
[19] H. Sogbossi, J. Verdier, and S. Multon, “Impact of reinforcement-concrete interfaces and 600
cracking on gas transfer in concrete,” Constr. Build. Mater., vol. 157, pp. 521–533, Dec. 601
2017. 602
[20] V. Garnier, “Evaluation non destructive des enceintes de confinement des centrales 603
nucléaires - Compte rendu de la Réunion plénière N°6,” ISFTTAR, Nantes, Jan. 2017. 604
[21] R. J. Torrent, “A two-chamber vacuum cell for measuring the coefficient of permeability 605
to air of the concrete cover on site,” Mater. Struct., vol. 25, no. 6, pp. 358–365, 1992. 606
[22] J.-P. Ollivier and J.-M. Torrenti, “La structure poreuse des bétons et les propriétés de 607
transfert,” Durabilité Bétons, vol. 1, 2008. 608
[23] A. Lobet, Influence des paramètres de composition des matériaux cimentaires sur les 609
propriétés de transfert. Ph.D. Thesis, Toulouse, INSA, 2003.
610
[24] J. J. Kollek, “The determination of the permeability of concrete to oxygen by the 611
Cembureau method-a recommendation,” Mater. Struct., vol. 22, no. 3, pp. 225–230, 612
1989. 613
[25] C. Antón, M. A. Climent, G. de Vera, I. Sánchez, and C. Andrade, “An improved 614
procedure for obtaining and maintaining well characterized partial water saturation states 615
on concrete samples to be used for mass transport tests,” Mater. Struct., vol. 46, no. 8, 616
pp. 1389–1400, Nov. 2012. 617
[26] RILEM TC 116-PCD, “Permeability of concrete as a criterion of its durability, final 618
report,” Mater. Struct., vol. 32, no. 217, pp. 163–173, Apr. 1999. 619
[27] M. Carcassès, A. Abbas, J.-P. Ollivier, and J. Verdier, “An optimised preconditioning 620
procedure for gas permeability measurement,” Mater. Struct., vol. 35, no. 1, pp. 22–27, 621
2001. 622
[28] S. Dushman and Research Staff of General Electric Research Laboratory, “Scientific 623
foundations of vacuum technique,” Am. J. Phys., vol. 30, no. 8, pp. 612–612, 1962. 624
[29] J. Verdier, M. Carcassès, and J. P. Ollivier, “Modelling of a gas flow measurement : 625
Application to nuclear containment vessels,” Cem. Concr. Res., vol. 32, no. 8, pp. 1331– 626
1340, Aug. 2002. 627
[30] Y.-S. Wu, K. Pruess, and P. Persoff, “Gas Flow in Porous Media With Klinkenberg 628
Effects,” Transp. Porous Media, vol. 32, no. 1, pp. 117–137, Jul. 1998. 629
[31] D. Gardner, “Experimental and numerical studies of the permeability of concrete,” Ph.D. 630
Thesis, Cardiff University, 2005. 631
[32] G. E. Karniadakis, A. Beskok, and N. Aluru, Microflows and Nanoflows: Fundamentals 632
and Simulation. Springer Science & Business Media, 2005.
633
[33] S. Roy, R. R. F. Chuang, B. A. Cruden, and M. Meyyappan, “Modeling gas flow 634
through microchannels and nanopores,” J. Appl. Phys., vol. 93, no. 8, pp. 4870–4879, 635
Mar. 2003. 636
29 [34] J. F. O’Hanlon, A user’s guide to vacuum technology, 3rd edition. John Wiley & Sons, 637
2005. 638
[35] N. P. Pham, A. Toumi, and A. Turatsinze, “Effect of Styrene-Butadiene Copolymer 639
Coating on Properties of Rubberized Cement-Based Composites,” in Strain-Hardening 640
Cement-Based Composites, vol. 15, V. Mechtcherine, V. Slowik, and P. Kabele, Eds.
641
Dordrecht: Springer Netherlands, 2018, pp. 342–350. 642
[36] J. Verdier and M. Carcassès, “Equivalent gas permeability of concrete samples subjected 643
to drying,” Mag. Concr. Res., vol. 56, no. 4, pp. 223–230, May 2004. 644
[37] F. A. Florence, J. Rushing, K. E. Newsham, and T. A. Blasingame, “Improved 645
Permeability Prediction Relations for Low Permeability Sands,” 2007. 646
[38] F. Cassagnabère, “Produits préfabriqués en béton filé : vers l’amélioration des 647
performances du matériau pour mieux gérer le procédé de production,” PhD Thesis, 648
Université de Toulouse, Université Toulouse III-Paul Sabatier, 2007. 649
[39] M. Binh, “Etude de la perméabilité des mortiers de ciment soumis à l’alcali réaction,” 650
Rapport de stage de recherche, Université de Toulouse, Université Toulouse III-Paul 651
Sabatier, 2007. 652
[40] P. Van den Heede, E. Gruyaert, and N. De Belie, “Transport properties of high-volume 653
fly ash concrete: Capillary water sorption, water sorption under vacuum and gas 654
permeability,” Cem. Concr. Compos., vol. 32, no. 10, pp. 749–756, Nov. 2010. 655
[41] J. Castro, D. Bentz, and J. Weiss, “Effect of sample conditioning on the water absorption 656
of concrete,” Cem. Concr. Compos., vol. 33, no. 8, pp. 805–813, 2011. 657
[42] M. T. Van Genuchten, “A closed-form equation for predicting the hydraulic conductivity 658
of unsaturated soils,” Soil Sci. Soc. Am. J., vol. 44, no. 5, pp. 892–898, 1980. 659
660 661
![Figure 1: Types and codes of samples [9], [19]](https://thumb-eu.123doks.com/thumbv2/123doknet/14248215.487813/5.892.124.766.123.321/figure-types-codes-samples.webp)

![Figure 4: Knudsen number, flow regime classifications for porous media [14], [32], [33]](https://thumb-eu.123doks.com/thumbv2/123doknet/14248215.487813/11.892.115.694.641.886/figure-knudsen-number-flow-regime-classifications-porous-media.webp)