The Journal of Heredity 78:153-159. 1987.
Further genetic analysis and linkage
relationships of isozyme loci
in the pea
Confirmation of the diploid nature of the genome
ABSTRACT: Allozyme polymorphism Is described and the mode of Inheritance determined for 15 loci In Plsum sattvum. The approximate position on the pea linkage map Is described for 12 of these loci. The remaining three loci formed a single group that assorted Independently of morphological markers on each of the seven currently recognized linkage groups. Possible cases of gene duplication are Identified In the alcohol dehydrogenase and esterase enzyme systems, but In neither case was polyplokly a likely explanation for the paired loci. Nor did the arrangement of the isozyme loci on the linkage map give any Indication that the pea genome Is of polyplokj derivation. We conclude that the "polymeric" genes that have been described In the pea are probably not homologous pairs and do not reflect a polyplold ancestry.
Norman F. Weeden
Gerald A. Marx
The authors are affiliated with the Department of Horticultural Sciences, N Y S Agricultural Experi-ment Station, Cornell University, Geneva, N Y 14456. Special thanks are due to A. C. Emmo for valuable technical assistance and to K. A. Suiter for the use of an improved version of his LINKAGE-1 program. This research was supported in part by an appropria-tion of funds under the Hatch Act (project no. 33491). © 1987, American Genetic Association.
A L I N K A G E M A P provides a summary of the
arrangement of genes on chromosomes and constitutes a valuable genetic tool for breed-ers, population biologists, and cytogeneti-cists. The analysis of loci coding biochemi-cally identifiable components such as pro-teins or RNAs further augments the infor-mation value of linkage maps because ho-mologous loci can often be recognized in oth-er species. In plants, intoth-erspecific compari-sons of the number of isozymes present and their intracellular compartmentation have revealed consistent patterns of expression in many plant species". Deviations from the expected pattern of isozyme expression have helped to identify cases of gene duplica-tion9-28 or to confirm12, or reject10 the poly-ploid nature of a genome.
The garden pea is generally treated as a diploid, for it possesses a relatively low chro-mosome number (n = 7), and the chromo-somes exhibit normal pairing at meiosis. However, systematic considerations have led Goldblatt7 to suggest that the subfamily Pa-pilionoideae, which includes the genus
Pi-sum, is of polyploid derivation. Furthermore,
at least five cases of "polymeric" genes, pairs of genes that appear to produce the same
phenotypic effects, have been identified in the pea. Lamprecht15'16 suggested that such a large number of duplicate genes demon-strated the polyploid nature of the pea ge-nome.
Despite the availability of an extensive linkage map for the pea2, only 20 genes or multigene clusters, specifying identifiable p r o t e i n s , have been l o c a t e d on t h i s map1-5'13'17-18'21-24-38 precluding evaluation of the ploidy level of the pea genome through the use of such biochemical markers. The purpose of the study reported here was to increase the number of isozyme loci available on the pea linkage map. The data were used to examine the question of polyploid deriva-tion.
Materials and Methods
Seed were obtained from the collection of genetic variants at the New York State Agri-cultural Experiment Station, Geneva, NY; from PI accessions maintained at the North-east Regional Plant Introduction Station, Geneva, NY; and from the collection at the John Innes Institution, Norwich, England. The parental lines used for the described
crosses and their phenotypes for marker genes are presented in Table I. Plants were grown and crosses made in the greenhouse with supplemental lighting used when need-ed to obtain a 16-hour day.
Linkage studies were performed on F2 populations growing in the greenhouse. Mor-phological characters were scored at various stages during the development of the plant. Segregation and linkage analysis was per-formed using the computer program LINK-AGE-13 1.
Most isozyme systems were assayed on ex-tracts from young leaves, obtained as de-scribed previously35. For several isozymes, however, minor modifications of the proce-dure were necessary for optimal results. For peroxidase isozymes, young healthy root tis-sue was extracted in buffer that did not con-tain 2-mercaptoethanol. In order to induce alcohol dehydrogenase isozymes, roots were submerged in water for 15 hours before sam-pling. This anaerobic treatment did not sig-nificantly affect the expression of the other enzymes we assayed. Peptidase phenotypes were determined using extracts from seed allowed to imbibe overnight.
Horizontal starch gel electrophoresis on gels of 10 percent starch was performed as described by Gottlieb8. Samples extracted in the tris-HCl buffer were placed on a pH 8.1 tris-citrate/lithium borate system29. The phosphate extraction buffer was used for samples subjected to electrophoresis on ei-ther a pH 6.5 histidine3 or a p / / 6.1 citrate/ N-(3-aminopropyl)-morpholine4 gel system. The assays for aspartate aminotransferase (AAT; EC 2.6.1.1), methylumbelliferyl es-terase (EST; EC 3.1.1.-), 6-phosphogluco-nate dehydrogenase (6PGD; EC 1.1.1.44) and p h o s p h o g l u c o m u t a s e ( P G M ; EC 2.7.5.1) have been described previously38. The peroxidase (PRX; EC 1.11.1.7) assay also was based on a standard recipe: 25 ml of 0.1 M acetate pH 5.0 buffer containing 1 drop 30 percent hydrogen peroxide and 25 mg 3-amino-9-ethylcarbazole (dissolved in 2 ml N,N-dimethylformamide). Alcohol dehy-drogenase (ADH; EC 1.1.1.1) was assayed according to Shaw and Prasad30. The beta-galactosidase (GAL; EC 3.2.1.23) assay con-sisted of 0.5 mM methylumbellyferyl-beta-D-galactoside in 0.1 M sodium citrate, pH 4.5. The beta N-acetyl-glucosaminidase (NAG; EC 3.2.1.30) assay also involved the methylumbellyferyl substrate, consisting of 0.1 M sodium citrate pH 4.5, containing 5 mg 4-methylumbelliferyl-N-acetyl-beta-D-glucosaminide. Mannose 6-phosphate isom-erase (MPI; EC 5.3.8.1) was assayed by the double-coupled technique described in Nich-ols and Ruddle2 3. Peptidase (PEP; EC
3.4.15.-) was assayed using an agarose over-lay in which 5 ml of a 1.4 percent SeaPlaque (FMC Corporation, Rockland, Maine) solu-tion at 37°C was combined with 5 ml of assay mix and the resulting solution poured onto the cut surface of the gel. The assay mix was modified from Nichols and Ruddle23 and in-cluded 4 ml 0.1 M tris-HCl ptf 8.0, 1.0 ml
0.1 M MgCl2, 6 mg L-glycyl-L-leucine, 10 mg L-phenylalanyl-L-proline, 5 mg dianisi-dine, 2 units peroxidase, and 0.5 mg snake venom.
Except where noted, reagents were ob-tained from Sigma Chemical Company, St. Louis, Missouri. The N-(3-aminopropyl) morpholine used in the pH 6.1 gel buffer was
Table I. Relevant morphological marker genes in parental lines
Line 83-11 83-12 Wellensiek's tester PI 179449 B78-288 A1078-236 A1O78-238 PI 358612 B77-257 A1078-235 C879-344 A683-168 22-11 JI36 A1078-239 PI 343997 JI21 A683-222 Abbreviation used in present paper a b c d e
f
g h i j k I m n 0 P 9 r Marker traits* _ a, i, le d, i,f, st, b,fa, gp, cr,fs,fl, wsp, r, tl — d i, k, M, st,f, b, le,/s, wlo i, wb, M,f, le, gp, pi, r — f,fi,pi f, le, cejs i, Pu, Pur, st, bf,le,ce,fs,pl
i, s, wb, st,f, b, le, pi, tl, r a, wa1, st,f, le, gp, cr, wlo, pi, r, bt M
If, M,f, ce, crjs wb, s, cp * For description of characters see Blixt2
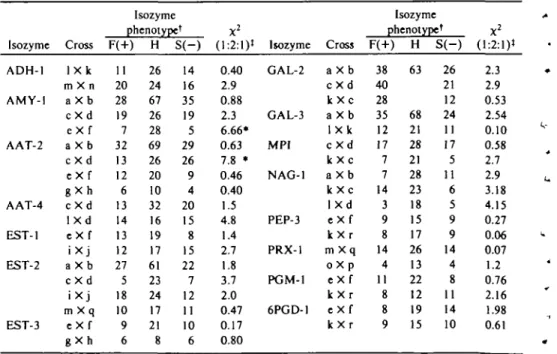
Table II. Segregation of iioxyme phenotype* in Pitum sativum
Isozyme ADH-1 AMY-1 AAT-2 AAT-4 EST-1 EST-2 EST-3 Cross I X k m X n a X b c X d e X f a X b c X d e X f g X h c X d I X d e X f i X j a X b c X d i X j m X q e X f g X h Isozyme phenotype* F(+) 11 20 28 19 7 32 13 12 6 13 14 13 12 27 5 18 10 9 6 H 26 24 67 26 28 69 26 20 10 32 16 19 17 61 23 24 17 21 8
s(-)
14 16 35 19 5 29 26 9 4 20 15 8 15 22 7 12 11 10 6 X2 (1:2:1)5 0.40 2.9 0.88 2.3 6.66* 0.63 7.8 • 0.46 0.40 1.5 4.8 1.4 2.7 1.8 3.7 2.0 0.47 0.17 0.80 Isozyme GAL-2 GAL-3 MPI NAG-1 PEP-3 PRX-1 PGM-1 6PGD-1 Cross a X b c X d k X c a X b I X k c X d k X c a X b k X c I X d e X f k X r m X q OX p e X f k X r e X f k X r Isozyme phenotype*F(+)
38 40 28 35 12 17 7 7 14 3 9 8 14 4 11 8 8 9 H 63 68 21 28 21 28 23 18 15 17 26 13 22 12 19 15S(-)
26 21 12 24 11 17 5 11 6 5 9 9 14 4 8 11 14 10 X2 (1:2:1)5 2.3 2.9 0.53 2.54 0.10 0.58 2.7 2.9 3.18 4.15 0.27 0.06 0.07 1.2 0.76 2.16 1.98 0.61t Phenotype designations: F(+) = fast variant (or, for GAL-2 in crosses c X d and k X c, activity present); H = heterozygous; S(—) ™ slow variant (or, for GAL-2 in crosses c X d, and k X c, activity absent)
1 Chi square for GAL-2 in crosses c X d and k X c was calculated on the basis of an expected 3:1 ratio • Significant at P = 0.05
purchased from Aldrich Chemical Compa-ny, Milwaukee, Wisconsin.
Results Alcohol dehydrogenasc
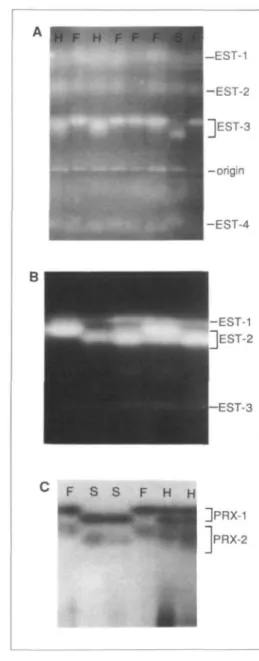
A single ADH band was observed in dry and imbibed seed extracts. Root and leaf ma-terial lacked significant ADH activity unless the tissue was placed under anaerobic condi-tions for approximately 15 hours, whereupon three activity bands could be seen after elec-trophorcsis. The most anodal of these bands, ADH-1, corresponded to the form found in seed extracts. Polymorphism was observed in ADH-1 but not in the most slowly migrating form, ADH-2 (Figure \A). Segregation analysis demonstrated that the polymor-phism in ADH-1 behaved as a monogenic trait in segregating populations (Table II). The mobility of the band intermediate be-tween ADH-1 and ADH-2 shadowed that of ADH-1 (Figure \A), suggesting that it was the hybrid dimer between 1 and ADH-2 subunits. The ADH isozymes in pea thus appear to be specified by two loci, Adh-1 and
Adh-2. Amylase
A single amylase band was observed after electrophoresis of leaf extracts from inbred lines. This amylase was not activated by CaCl2, was inhibited by 1 X 10~5 M CuCl2 and was active at low pH. It therefore ap-pears to be a beta-amylase. Two variants were observed, and crosses between plants which possessed the alternate phenotypes gave hybrids showing both forms (Figure 15). Self-pollination of these hybrids pro-duced an F2 population with the 1:2:1 ratio for amylase phenotypes expected for diallelic inheritance (Table II).
Aspartate aminotransferase
Four zones of AAT activity could be seen on gels38. Cell fractionation studies demon-strated that each zone represented the AAT from a separate subcellular compartment, and the genetic basis of the plastid isozyme (AAT-2) and the mitochondrial isozyme (AAT-3) was discussed previously37'38. Here we report the identification of a rare variant in AAT-4, the cytosolic form (Figure 1C). Segregation analysis of the polymorphism in AAT-4 (Table II) indicated monogenic con-trol. This locus, Aat-c, assorted independent-ly of Aat-m and Aat-p.
Estentse
Four leaf esterases can be observed on the
pH 6.1 gel (Figure 2-4). Electrophoresis on a
H S F H
UADH-1
-ADH-2
-AAT-1
AAT-4
-amylase
H H
FIGURE 1 A shows alcohol dehydrogenase phe-notypes obtained from extracts of pea roots sub-merged in water for 15 hours previous to extrac-tion. Phenotype designations are the same as given in Table II with H = heterozygous, S •• slow, and F " fast. B—amylase phenotypes obtained from an F2 population. Parental phenotypes are single-banded. Both bands are expressed in plants hetero-zygous at Amy-I. C—pea aspartate aminotrans-ferase patterns, demonstrating variation in the cy-tosolic isozyme, AAT-4. The 3-banded AAT-4 phenotype observed in heterozygous plants indi-cates that this isozyme possesses a dimcric struc-ture. Anode is at top of figure.
histidine, pH 6.5 gel gave better resolution of the EST-2 bands as well as adequate resolu-tion of the EST-3 allozymes (Figure IB), but EST-1 variation was difficult to interpret and the EST-4 isozymes could not be ob-served on this gel. EST-2 behaved as a mono-meric enzyme, for the hybrid phenotype ex-hibited only the two parental bands. In con-trast, EST-3 appeared to be a dimeric enzyme because the hybrid phenotype was 3-banded (Figure 2A). The variants of EST-3 showed simple segregation ratios (Table II),
-EST-4
-EST-3
F S S F H H
HPRX-1 PRX-2
FIGURE 2 A shows esterase patterns on a pH 6.1 gel system. Segregation for EST-3 is apparent with H «• heterozygous, S = slow, and F = fast phenotypes. B—esterase phenotypes on a histi-dine, pH 6.5 gel. Segregation can be seen for EST-2. The esterase activity between EST-2 and EST-3 is produced by an unnamed esterase that is not always observable in leaf extracts. C—phenotypes of the anodal peroxidases in root extracts from an F2 population segregating at Px-I. The fainter, more diffuse PRX-2 bands exhibit the same segre-gation pattern as the PRX-1 bands and may be a product of the same gene. Anode is at top of figure.
indicating control by a single locus, Est-3, which assorted independently of Est-2 and
Est-4.
Galactosidase
There are three galactosidase isozymes ob-servable in most pea leaf extracts36. Only two, which migrate cathodally on the p / / 6.1
gel, were investigated in the studies reported here. Several cathodal variants showed very low activity and were treated as GAL 'minus' mutants. When such variants were crossed with lines exhibiting normal expression of beta galactosidase it was often difficult to distinguish the heterozygous phenotype from the normal in segregating populations. In such cases we only differentiated GAL 'plus' and GAL 'minus' phenotypes. Both cathodal isozymes exhibited simple Mendelian inheri-tance (Table II). Joint segregation analysis demonstrated that the two isozymes were coded by distinct loci, designated Gal-2 and
Gal-3ib.
Mannosc phosphate isomerase
One MPI isozyme could be seen near the front (/?/= 0.85) on the ptf 8.1 gel. The two MPI variants observed were too similar in mobility to resolve the individual bands in the heterozygous phenotype; thus we could not establish a quaternary structure for the en-zyme. Genetic analysis demonstrated that a single locus, Mpi, was responsible for the observed polymorphism (Table II).
Beta-N-acetyl-glucosaminidase
One clearly defined zone of activity, NAG-1, was observed in root or leaf extracts
from homozygous lines. Only two forms of NAG-1 were found among the pea lines test-ed, and genetic studies indicated that these were allozymic variants (Table II). The hy-brid phenotype exhibited a 3-banded pheno-type, suggesting that the active enzyme is a dimer. A second zone of NAG activity occa-sionally was seen near the origin; however, we could not clearly resolve variants or con-sistently obtain activity in this region.
Peptidases
A number of peptidases were observed in seed extracts using the dipeptides
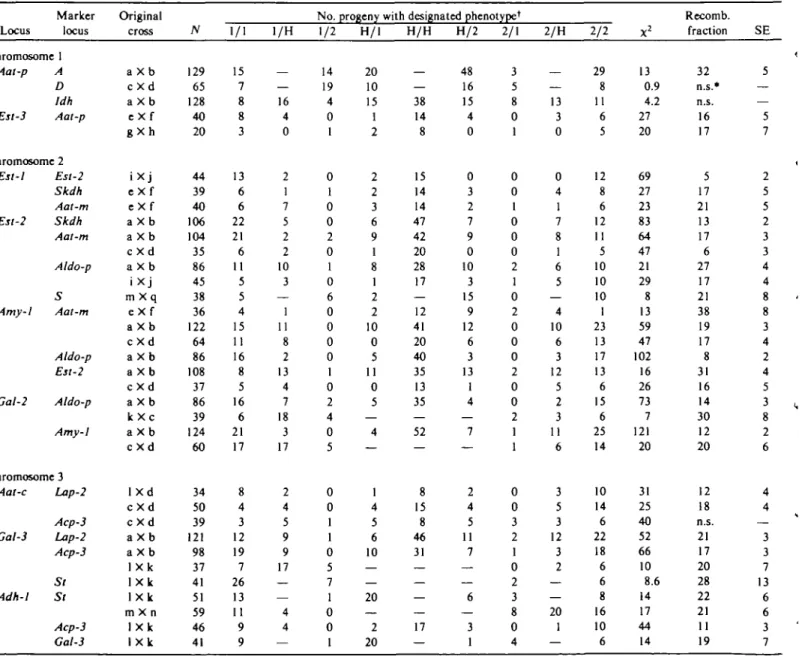
phenylala-Table IlL Joint segregation analysis in erotics of Puum Mmtivum
Locus Marker locus Chromosome 1 Aat-p Esl-3 A D Idh Aat-p Chromosome 2 Est-1 Est-2 Amy-I Gal-2 Est-2 Skdh Aat-m Skdh Aat-m Aldo-p S Aat-m Aldo-p Est-2 Aldo-p Amy-I Chromosome 3 Aat-c Gal-3 Adh-1 Lap-2 Acp-3 Lap-2 Acp-3 St St Acp-3 Gal-3 Original cross a X b c X d a X b e X f g X h i X j e X f e X f a X b a X b c X d a X b i X j m X q e X f a X b c X d a X b a X b c X d a X b k X c a X b c X d l x d c X d c X d a X b a X b 1 X k l X k l X k m X n l X k I X k N 129 65 128 40 20 44 39 40 106 104 35 86 45 38 36 122 64 86 108 37 86 39 124 60 34 50 39 121 98 37 41 51 59 46 41 1/1 15 7 8 8 3 13 6 6 22 21 6 11 5 5 4 15 11 16 8 5 16 6 21 17 8 4 3 12 19 7 26 13 11 9 9 1/H — — 16 4 0 2 1 7 5 2 2 10 3 — 1 11 8 2 13 4 7 18 3 17 2 4 5 9 9 17 — — 4 4 — No. 1/2 14 19 4 0 1 0 1 0 0 2 0 1 0 6 0 0 0 0 1 0 2 4 0 5 0 0 1 1 0 5 7 1 0 0 1 progeny with H/l 20 10 15 1 2 2 2 3 6 9 1 8 1 2 2 10 0 5 11 0 5 — 4 — 1 4 5 6 10 — — 20 2 20 designated phenotype* H/H — — 38 14 8 15 14 14 47 42 20 28 17 — 12 41 20 40 35 13 35 — 52 — 8 15 8 46 31 — — — 17 — H/2 48 16 15 4 0 0 3 2 7 9 0 10 3 15 9 12 6 3 13 1 4 — 7 — 2 4 5 11 7 — — 6 3 1 2/1 3 5 8 0 1 0 0 1 0 0 0 2 1 0 2 0 0 0 2 0 0 2 1 1 0 0 3 2 1 0 2 3 8 0 4 2/H — — 13 3 0 0 4 1 7 8 1 6 5 — 4 10 6 3 12 5 2 3 11 6 3 5 3 12 3 2 — — 20 1 — 2/2 29 8 11 6 5 12 8 6 12 11 5 10 10 10 1 23 13 17 13 6 15 6 25 14 10 14 6 22 18 6 6 8 16 10 6 X2 13 0.9 4.2 27 20 69 27 23 83 64 47 21 29 8 13 59 47 102 16 26 73 7 121 20 31 25 40 52 66 10 8.6 14 17 44 14 Recomb. fraction 32 n.s.* n.s. 16 17 5 17 21 13 17 6 27 17 21 38 19 17 8 31 16 14 30 12 20 12 18 n.s. 21 17 20 28 22 21 11 19 SE 5 — — 5 7 2 5 5 2 3 3 4 4 8 8 3 4 2 4 5 3 8 2 6 4 4 — 3 3 7 13 6 6 3 7 * 1 ° phenotype of female parent, 2 - phenotype of male parent, H >
* n J. - not significant at P « 0.05
phenotype of Fi plants if different than parents
nine-proline and glycyl-leucine. The most anodal, weakly staining isozyme, PEP-1, possessed the same mobility as the previously defined27-38 LAP-1 isozyme and appeared to be the same protein. We did not observe a peptidase corresponding to LAP-2; however, PEP-3 also possessed weak LAP activity and would occasionally appear on gels assayed for LAP. This isozyme exhibited significant-ly greater activity when the substrate alanyl beta-naphthylamide was substituted for the leucyl derivative. Variants of PEP-3 gated as allelic forms (Table II). This segre-gation was independent of segresegre-gation at ei-ther Lap-1 or Lap-2 and was ascribed to a third locus, Pep-3.
Peroxidase
Several zones of PRX activity could be seen when root extracts were subjected to electrophoresis (Figure 2C). Genetic analy-sis was performed on only the two most anod-al peroxidases, PRX-1 and PRX-2. PRX-1 produced an intense, sharp band near the front (/?/= 0.7-0.8) whereas PRX-2 formed a more lightly staining broader zone with a mobility of approximately 0.6. Both zones gave identical segregation patterns in F2 pop-ulations; thus we could not determine if the two zones were products of distinct but tight-ly linked loci or if one was a
post-translation-E»t-3 Aat-p 2 • -Gal-2 • 'Amy • 'Aldo-p ~ 'Aof-171 : :EiM,2 oh- -Skdh 3 • 'Aat-c . .lop-2 M- • . -Gal-3 • 'Acp-3 (Adh-1) it' fa. . b: : Np. . I * . • t • ; ; Pgm-p l cp. . - - P x - 1 OP- w> . .Acp-1 - -Nag-1 •+• • -cipgdc J_ f.--(Mpi) org . .Acp-2 Esl-4 B t - . I I linkage group a a> • a a. .0 E a a.
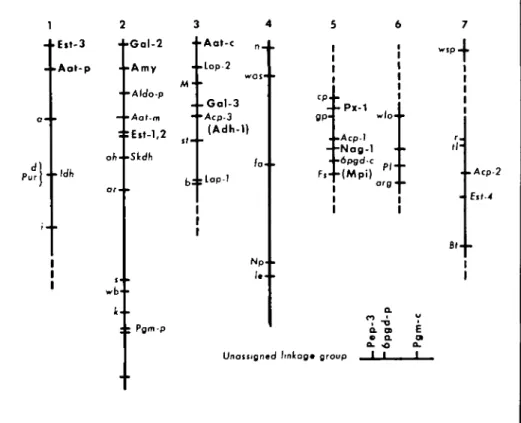
FIGURE 3 Linkage relationships of 15 isozyme loci (shown in bold) with previously mapped morpho-logical and isozyme markers. The seven vertical bars represent the seven chromosomal linkage groups as presented in Blixt2. The horizontal bar represents an eighth linkage group that assorts independently of
all other markers shown. This eighth linkage group may be associated with chromosome 7 on the basis of its linlcage to a ribosomal DNA cluster (see discussion in text). Dashed lines at ends of certain linkage groups indicate the positions of other markers not used in our studies.
Tmble m . Continued Locus Marker locus Chromosome 5 Px-1 Nag-1 Mpi Unmapped Pgm-c Pep-3 Gp Acp-1 Cr Ce 6pgd-c Fs Acp-1 6pgd-c Ce Gp Cr Fs 6pgd-c linkage group 6pgd-c Pep-3 6pgd-c Original cross o X p O X p m X q m X q m Xq m X q m X q a X b k X c k X c a X b l X d l X d c X d c X d c Xd k X c e X f l X r e X f l X r e X f l X r N 16 19 53 49 50 53 51 46 37 43 46 26 26 59 61 59 31 41 27 33 27 33 34 1/1 4 1 8 13 12 7 12 9 3 5 11 4 3 6 6 16 2 10 6 2 5 2 9 1/H — 3 5 — — 6 — 2 3 0 0 2 — — — — 2 1 3 3 4 5 0 No. 1/2 0 0 1 1 2 11 2 0 0 1 0 0 2 10 11 0 0 0 0 0 0 2 0
progeny with designated phenotype' H / l 0 2 5 16 15 7 15 1 1 0 0 1 2 7 5 24 3 4 2 6 2 1 1 H/H — 7 14 — — 13 — 27 17 21 25 15 — — — — 9 16 9 10 9 12 15 H/2 10 2 6 6 9 5 9 0 0 2 3 1 16 19 22 3 2 2 1 3 1 2 1 2/1 0 0 2 1 5 33 7 0 2 0 0 0 0 3 1 1 0 0 1 1 1 1 0 2/H — 0 4 — — 3 — 4 2 1 3 1 — — — — 8 2 1 2 1 0 0 2/2 2 4 8 12 7 8 6 3 8 13 4 2 3 15 16 15 5 6 4 6 4 8 8 X2 16 11 14 23 5.5 11 3.4 48 25 64 56 21 6.8 2.9 4.7 42 8.0 38 18 10 16 18 57 Recomb. fraction 0.0 21 28 17 34 32 n.s. 8 17 6 7 10 17 n.s. 34 (nj.) 7 28 12 18 28 21 25 3 SE — 7 5 6 8 6 — 3 5 3 3 4 8 — — 3 7 4 6 7 6 6 2
al modification of the other. The intensely staining peroxidase appears to be the one previously investigated by Matthews and Williams22. We have therefore used their lo-cus designation, Px-1.
Phosphoglucomutasc and
6-phosphogluconatc dehydrogenase
The phenotypes and segregation data for the PGM and 6PGD isozymes in the pea have been described previously34'37-38. The results presented in Table II confirm that both the cytosolic isozyme of PGM and the plastid isozyme of 6PGD show simple segre-gation ratios.
Linkages observed
Analysis of joint segregation ratios for de-viations from random assortment revealed six linkage groups, five of which could be associated with chromosomal markers.
Chromosome 1: Two isozyme loci, Aat-p
and Est-3, were added to the linkage map for chromosome 1; Aat-p appeared to be about 30 map units from A. Est-3 was linked to
Aat-p but assorted independently of A
(Ta-ble III). Two other loci, Idh and D, located about 35 map units towards the centromere from A, also segregated in at least some of the crosses used to map Aat-p and Est-3. However, linkage was not observed between the two pairs of loci (Table III). Therefore
Aat-p and Est-3 were placed on the opposite
side of A from Idh and D (Figure 3).
Chromosome 2: Four isozyme markers, Est-I, Est-2, Amy-1, and Gal-2, were added
to the region of chromosome 2 distal to Oh (Figure 3). The two esterase loci were tightly linked and appeared to be located between two previously mapped isozyme loci, Skdh and Aat-m (Table III). Amy-1 and Gal-2 were placed distal to Aldo-p so that the en-tire sequence of loci was: (Skdh,
Oh)—(Est-1, Est-2)—Aat-m—Aldo-p—Amy-I — Gal-2.
Chromosome 3: The loci Aat-c, Adh-1,
and Gal-3 displayed linkage with markers on chromosome 3. Aat-c was placed distal to M and Lap-2 on the basis of relative linkage distances (Table III). Both Adh-1 and Gal-3 mapped between M and 5 / , Gal-3 being clos-er to M. Adh-1 was tightly linked with Acp-3 (Table III), but we could not determine whether the former locus was on the M or the 5 / side of Acp-3. Thus, we have tentatively placed the two loci together on the linkage map (Figure 3) in spite of the significant recombination frequency observed between them.
Chromosome 5: Three isozyme loci were
added to the linkage map of this chromosome (Figure 3). In a 6-point cross, Px-1 showed
closest linkage to Acp-1 and no linkage to Fs (Table III). These results place Px-1 on the
Gp side of Acp-1. The second cross (o X p)
confirmed that Px-1 was very near to Gp, for no recombinants were observed among the
16 plants analyzed.
Nag-1 mapped close to 6pgd-c, showing
only 6-10 percent recombination with this locus. Three-point crosses involving either
Acp-1 or Ce and the two tightly linked loci
indicated that Nag-1 was between Acp-1 and
6pgd-c. Mpi also exhibited linkage with 6pgd-c; however, Mpi appeared to be closer
to Fs than 6pgd-c, possibly on the far side of
Fs from 6pgd-c. The 4-point cross involving
the morphological markers Gp, Cr, and Fs placed Mpi only seven rccombinant units from Fs (Table III).
Unmapped linkage group: A set of three
isozyme loci showed linkage among them-selves but not with any of the markers shown in Figure 3. This group included 6pgd-p,
Pgm-c, and Pep-3. The group spans some
20-25 recombinant units, the order of the loci being: Pep-3—6pgd-p—Pgm-c.
Discussion
The linkage data we generated during our mapping of isozyme loci provided a rigorous test of the linkage map published by Blixt2 and confirmed its overall accuracy. The map for chromosome 1 required extension to in-clude Aat-p and Est-3 but otherwise was not modified. However, conflicting data now ex-ist in the literature regarding the proper posi-tion of Aat-p relative to A. Mahmoud et al.18 reported linkage between A and an aspartate aminotransferase locus (Got). Although the investigators did not determine the intracel-lular compartmentation of the AAT iso-zyme, their report of linkage with A indicates that the isozyme was the plastid-specific form encoded by Aat-p. Mahmoud et al.18 placed the locus between A and D on the basis of a statistically nonsignificant devi-ation from random assortment involving
Aat-p and D. Aat-p lies a significant distance
from A, and we would have expected to see linkage between it and both D and Idh if it were located between A and D. As no such linkage was observed (Table III), we have placed Aat-p and Est-3 distal to A; however, further studies will be necessary to confirm this location.
The majority of the chromosome 2 linkage group was corroborated by the results of the isozyme mapping. The Ar—Oh—Aldo-p linkage has been extended to permit space for
Amy-1 and Gal-2. Relative map distances
indicate that Gal-2 is farther from Oh than is
Chi-5, the most distal locus on Blixt's map.
Chi-5 was not included among the markers
we used, so that we were unable to directly test this possibility. Linkage between iso-zyme loci in the Oh region and markers to-ward the opposite end of the chromosome was observed only in cross m X q (Table III) in which Est-2 displayed linkage with S.
Nearly the entire sequence of morphologi-cal markers on chromosome 3 was confirmed by isozyme studies. We have previously re-ported that Aat-c is on the opposite side of
Tac relative to S/20. New evidence indicates that uni, the most distal marker on the stand-ard linkage map for one arm of chromosome 3, is allelic to tac (Marx, unpub. data). Aat-c thus becomes the most distal marker on this arm of chromosome 3.
The linkage map for chromosome 5, at least between Cp and Fs, also was supported by isozyme results. Unfortunately, isozyme loci were not found beyond Cp, which pre-cluded the use of isozyme loci to test the hypothesis of Lamm14 that the chromosome 7 linkage group actually belongs with chro-mosome 5. Evidence suggesting that the
Pep-3—6pgd-p—Pgm-c linkage group is on
chromosome 7 has recently been reported25. The group was found to be linked with
Rrn-2, one of the two clusters of rRNA genes in
the pea genome. The RNA gene clusters probably correspond to the two nucleolar or-ganizer regions on chromosomes 4 and 7, with Rrn-2 being the array on chromosome 7. The absence of linkage between this group and the classical chromosome 7 markers is compatible with Lamm's hypothesis, but also can be explained by assuming that the iso-zyme loci are on the satellite portion of the long arm of the chromosome and thus are too far from the other markers to show linkage.
Other investigators have presented evi-dence for additional isozymes in the systems we have examined. Przybylska et al.26 report-ed two amylase loci, Amy-1 and Amy-2, were expressed in seed extracts. The single amylase we observed in leaf extracts appar-ently is identical to the more anodal of the two seed amylases (Przybylska, pers. com-mun.), and we have used her nomenclature
(Amy-1) for this locus. The chromosomal
location of a locus coding a seed amylase recently has been reported by Mahmoud et al.18. This locus was designated Amy and was found to be linked with K on the opposite end of chromosome 2 from Amy-1. At present we do not know if Amy is the same as Amy-2 of Przybylska or if it represents a third isozyme in seed.
Hunt and Barnes13 demonstrated that a seed esterase was linked to Fw, a gene for
Fusarium wilt resistance located on
chromo-some 4. Mahmoud et al.18 using the
some 4 marker, Br, confirmed this location of the esterase locus. This esterase does not cor-respond to any of the four major esterases we have observed in leaf extracts, although we have verified its presence in seed using poly-acrylamide gel electrophoresis.
Most of the enzyme systems examined contained more than one isozyme; however, these multiple loci do not necessarily repsent duplication of genetic material as a re-sult of polyploidy. In the AAT, ALDO, PGM, and 6PGD enzyme systems each iso-zyme is located in a different subcellular compartment. The origin of such forms may predate the existence of the typical plant cell33 and therefore cannot be attributed to polyploidy within the Leguminosae. The re-maining polygenic systems (ACP, ADH, EST, GAL, LAP, NAG, and PRX) are more difficult to evaluate for duplicate genes. One characteristic of a duplicate gene system specifying multimeric enzymes is the inter-genic combination of subunits to produce a fixed heterozygous pattern. Of the multi-meric enzymes examined ( I D H , A A T , ALDO, 6PGD, EST-3, NAG-1, and ADH) only ADH displayed an intergenic hybrid band (Figure \A). Thus, 1 and ADH-2 could be isozymes coded by duplicate loci. Yet similar ADH phenotypes have been de-scribed in many diploid species6-19'32, and it is doubtful that the two loci in pea were formed as a consequence of polyploidy.
The remaining enzyme systems (ACP, EST, GAL, LAP, and PRX) are not particu-larly useful for investigating the ploidy level of a species because diploid plants vary in the number of isozymes present per cell. Nor does a consensus exist regarding the number of isozymes expected in each system. The Est-1—Est-2 cluster could represent a du-plication resulting from unequal crossing over, but not from polyploidy.
Examples of duplicated linkage patterns, which would be expected even in allopoly-ploids12, were not observed in the pea. One pair of polymeric genes identified by Lam-precht consists of/(on chromosome 3) and/5 (on chromosome 5). F i s linked to Acp-3 and Gal-3, whereas Fs is not closely linked to any of the remaining Acp or Gal loci. Acp-1 is over 20 recombinant units from Fs3i. Acp-2
is on chromosome 7, and Gal-2 is on chromo-some 2 (Figure 3). Similar analysis demon-strates that linkage relationships with other polymeric loci (e.g., Pu and Pur, P and V) give no indication of duplicated linkage
groups. We conclude that these polymeric genes are not vestiges of a previous polyploi-dy event. If the Papilionoideae are derived from a polyploid ancestor as suggested by Goldblatt7, at least Pisum has undergone di-ploidization to such an extent that, with re-gard to expressed isozyme loci, its genome no longer retains any evidence of a polyploid heritage.
References
1. ALMGARD, G. and K. OHLUND. Inheritance and location of a biochemical character in Pisum. Pi-sum Nev/sletl. 2:9. 1970.
2. BLIXT. S. The pea. In Handbook of Genetics. R. C. King, Ed. Plenum Press, N.Y., Vol. 2, p. 181-221. 1974.
3. CARDY, B. J., C. W. STUBER, and M. M. GOOD-MAN. Techniques for starch gel electrophoresis of enzymes from maize (Zea mays L.). Dept. of Statistics Mimeo Series No. 1317, North Caroli-na State Univ., Raleigh. 1980.
4. CLAYTON, J. W. and D. N. TRETIAK. Amine-citrate buffers for pH control in starch gel elec-trophoresis. / . Fish. Res. Bd. Can. 29:1169-1172. 1972.
5. DAVIES, D. R. The rQ locus and legumin synthesis
in Pisum sativum. Biochem. Genet. 18:1207-1219. 1980.
6. FREELINO, M. and D. SCHWARZ. Genetic
rela-tionships between the multiple alcohol dehydro-genases of maize. Biochem. Genet. 8:27-36.1973. 7. GOLDBLATT, P. Cytology and the phytogeny of
Leguminosae. In Advances in Legume Systemat-ics. R. M. Polhill and P. H. Raven, Eds. Royal Botanic Gardens, Kew, Richmond, p. 427-463. 1981.
8. GOTTLIEB, L. D. Enzyme differentiation and phylogeny in Clarkia franciscana, C. rubicunda, and C. amoena. Evolution 27:205-214. 1973. 9. . Gene duplication and fixed heterozygosity
for alcohol dehydrogenase in the diploid plant Clarkia franciscana. PNAS 71:1816-1818.1974. 10. . Gene number in species of Astereae that have different chromosome numbers. PNAS 78:3726-3729.1981.
11. . Conservation and duplication of isozymes in plants. Science 216:373-380. 1982.
12. HART, G. E. and P. J. LANGSTON. Chromosom-al location and evolution of isozyme structurChromosom-al genes in hexaploid wheat. Heredity 39:263-277.
1977.
13. H U N T , J. S. and M. F. BARNES. Molecular di-versity and plant disease resistance: An electro-phoretic comparison of near-isogenic lines of wilt-resistant or -susceptible Pisum sativum L. cv. William Massey. Euphytica 31:341-348. 1982. 14. LAMM, R. Cytological studies in Pisum.
Heredi-tas 37:356-372. 1951.
15. LAMPRECHT, H. The inheritance of the number of flowers per inflorescence and the origin of Pi-sum, illustrated by polymeric genes. Agri Hon. Genet. 5:16-25. 1947.
16. . New and hitherto known polymeric genes of Pisum. Agri Hort. Genet. 11:40-54. 1953. 17. M A H M O U D . S . H. and J. A. GATEHOUSE
Inher-itance and mapping of vicilin storage protein genes in Pisum sativum L. Heredity 53:185-191. 1984.
18. , , and D. BOULTER. Inheritance and
mapping of isoenzymes in pea (Pisum sativum L.). TAG 68:559-566. 1984.
19. MARSHALL, D. R., P. BROUE.and R. N. O R A M Genetic control of alcohol dehydrogenase iso-zymes in narrow-leafed lupins. J. Hered. 65:198-203.1974.
20. MARX, G. A., N. F. W E E D E N . and R. PROVVI-DENTI Linkage relationships among markers in chromosome 3 and En, a gene conferring virus resistance. Pisum Newslett. 17:57-60. 1985. 21. M A T T A, N. K. and J. A. GATEHOUSE.
Inheri-tance and mapping of storage protein genes in Pisum sativum L. Heredity 48:383-392. 1982. 22. MATTHEWS P. and H. WILLIAMS. Genetics of
root isoperoxidase variants in Pisum. John lnnes 63 Annual Report, p. 43. 1972.
23. NICHOLS, E. A. and F. H. RUDDLE, A review of enzyme polymorphism, linkage and electropho-retic conditions for mouse and somatic cell hy-brids in starch gels. J. Histochem. Cytochem. 21:1066-1081. 1973.
24. POLANS. N. O., N. F. WEEDEN, and W. F. THOMPSON. The inheritance, organization and mapping of rbcS and cab multigene families in pea. PNAS 82:5083-5087. 1985.
25. , , and . The distribution, inher-itance and linkage relationships of ribosomal DNA spacer length variants in pea. TAG In press. 1987.
26. PRZYBYLSKA, J., S. BLIXT, H. PARZYSZ, Z. ZIMNIAK-PRZYBYLSKA. Isoenzyme variation in the genus Pisum I. Electrophoretic patterns of several enzyme systems. Genetlca Polonica 23:103-121. 1982.
27. SCANDALIOS, J. G. and L. G. ESPIRITU. Mutant aminopeptidases in Pisum salioum 1. Develop-mental genetics and chemical characteristics. Mol. Gen. Genet. 105:101-112. 1969.
28. SCHWARTZ, D. and T. ENDO. Alcohol
dehydro-genase polymorphism in maize. Simple and com-pound loci. Genetics 53:709-715. 1966. 29. SELANDER, R. K., M. H. SMITH, S. Y. YANG,
W. E. JOHNSON, and J. B. G E N T R Y . Biochemi-cal polymorphism and systematics in the genus Peromyscus. I. Variation in the old-field mouse (Peromyscus polionotus). Unic. Texas Publ. 7103:49-90. 1971.
30. SHAW, C. R. and R. PRASAD. Starch gel
electro-phoresis—a compilation of recipes. Biochem. Genet. 4:297-320. 1970.
' 3 1 . SUITER, K. A., J. F. W E N D E L , and J. S. C A S E LINKAGE-1: a PASCAL computer program for the detection and analysis of genetic linkage. / . Hered. 74:203-204. 1983.
32. TORRES, A. M. Genetics of sunflower alcohol dehydrogenase: Adh-2, nonlinkage to Adh-I and Adh-1 early alleles. Biochem. Genet. 12:385-392. 1974.
33. WEEDEN, N. F. Genetic and biochemical impli-cations of the endosymbiotic origin of the chloro-plast. J. Mol. Evol. 17:133-139.1981. 34. . Pea 6-phosphogluconate dehydrogenase
isozymes. Pisum Newslett. 15:56-58. 1983. 35. . Distinguishing among white seeded bean
cultivars by means of allozyme genotypes. Eu-phytica 33:199-208. 1984.
36. . Identification and partial characterization of 3 beta-galactosidase isozymej in pea leaves. Pisum Newsl. 17:76-78. 1985.
37. and L. D. GOTTLIEB. The genetics of chlo-roplast enzymes. J. Hered. 71:392-396. 1980. 38. and G. A. MARX. Chromosomal locations
of twelve isozyme loci in Pisum sativum. J. Hered. 75:365-370. 1984.