HAL Id: hal-01463281
https://hal.archives-ouvertes.fr/hal-01463281
Submitted on 9 Feb 2017
HAL is a multi-disciplinary open access
archive for the deposit and dissemination of sci-entific research documents, whether they are pub-lished or not. The documents may come from teaching and research institutions in France or abroad, or from public or private research centers.
L’archive ouverte pluridisciplinaire HAL, est destinée au dépôt et à la diffusion de documents scientifiques de niveau recherche, publiés ou non, émanant des établissements d’enseignement et de recherche français ou étrangers, des laboratoires publics ou privés.
refrigeration systems
F.T. Ndoye, P. Schalbart, G. Alvarez, D. Leducq
To cite this version:
F.T. Ndoye, P. Schalbart, G. Alvarez, D. Leducq. Numerical study of energy performance of nanofluids for refrigeration systems. 3rd IIR International Conference on Sustainability and the Cold Chain, ICCC 2014, Jun 2014, London, France. pp.428-435. �hal-01463281�
3rd IIR International Conference on Sustainability and the Cold Chain, London, UK, 2014
NUMERICAL STUDY OF ENERGY PERFORMANCE OF
NANOFLUIDS FOR REFRIGERATION SYSTEMS
F. T. NDOYE*, P. SCHALBART, G. ALVAREZ, D. LEDUCQ
Irstea, Refrigeration Process Engineering Research Unit
1 rue Pierre-Gilles de Gennes CS10030, F-92761Antony Cedex, France
*Fax: +33 1 40966475, fatou-toutie.ndoye@irstea.fr
ABSTRACT
A mathematical model was developed to predict the energy performances of refrigerating systems using nanofluids for application in refrigeration plants of cold chain. The model was based on a combination of the Effectiveness-Number of Transfer Units method and classical heat transfer and fluid hydrodynamic correlations. Simulations were done for a tubular heat exchanger in laminar and turbulent regimes, for various types of NPs and a wide range of volume fraction. It was shown that heat transfer coefficients significantly increased with the increase of NPs concentration whatever the flow regime, but the pressure drop also increased. Calculation of a Performance Evaluation Criterion has shown that the energy performance is strongly dependent on the type of NPs, their volume fraction and the flow regime. These criterion data also showed the existence of optimum parameters for which the use of nanofluids is energetically interesting. The model was validated using published data.
1.
INTRODUCTION
One of the major concerns of the cold chain sector is to improve the energy efficiency of refrigeration systems while reducing their environmental impact. Several researches have been conducted in the field of refrigeration technologies and various methods have been proposed in order to enhance heat transfer rate and diminish refrigerant charge. Secondary refrigeration architecture has been identified as a good strategy of reduction of refrigerant charge, but is thermally less efficient than traditional direct refrigeration systems (Macchi et al., 1999; Wang et al., 2010). A way to overcome this issue could be the use of secondary fluid such as nanofluids (NFs) with excellent heat transfer properties.
NFs are a new class of solid-liquid composite materials consisting of solid nanoparticles (NPs), with typically sizes of 1-100 nm, suspended in a liquid solvent. NFs recently gained worldwide attention in heat transfer field due to their higher thermal conductivity in comparison with conventional heat transfer fluids (e.g. water, ethylene glycol, etc). The increase in thermal conductivity because of very small sizes and large surface specific areas of NPs results in an enhancement of heat transfer properties. Recent studies have revealed that the enhancement of thermal conductivity is accompanied by an increase in viscosity leading to pressure drop and pumping power increasing (Ferrouillat et al., 2011; Maré et al., 2011;
3rd IIR International Conference on Sustainability and the Cold Chain, London, UK, 2014
of finding a compromise between thermal transfer enhancements and pumping energy losses, before implementing NPs in heat exchangers.
A few studies have focused on the use of NFs in heat exchangers for refrigeration applications. Sarkar (2011) and Kumaresan et al. (2013) have studied the use of NFs in a secondary loop for refrigeration. But these authors have only evaluated the thermal performance of the system without considering pressure drop issues. Moreover, they worked at temperatures above 0°C. So, to the best of author's knowledge, there is no publication available that dealed with the use of NFs in a secondary loop of a refrigeration system for freezing and chilling applications and focusing on the evaluation of the practical benefit of using NFs by comparing the heat flow rate transferred to the required pumping power in the refrigeration plant. This work aimed to investigate the potential applicability of NFs in current indirect refrigeration systems and throughout the food cold chain. Specifically, the study deals with the numerical evaluation of the energy performance of several types of NPs when they are used in secondary loop of refrigeration plants. The paper presents the mathematical model developed to simulate the effect of various parameters on heat transfer rate and pressure drop of NFs flowing through a tubular heat exchanger. The energy performance of each type of NF is assessed through a Performance Evaluation Criterion (PEC) and the model is validated using experimental results of the literature.
2. MATHEMATICAL MODELLING AND SIMULATION
The purpose of the modelling was to simulate thermal performance of a NF flowing through a heat exchanger in a refrigeration plant. As heat transfer and hydrodynamics are the most critical factors, they can be compared through a global energy approach using the PEC defined as the ratio of heat flow rate transferred to the required pumping power in the system (Ferrouillat et al., 2011):
P v T T Cp m PEC o i (1)The model developed is based on a combination of the Effectiveness-Number of Transfer Units (-NTU) method and classical heat transfer and fluid hydrodynamic correlations. It allows to evaluate the convective heat transfer rate and to estimate the viscous pressure drop.
Several assumptions have been made for the simulations: i) NF is the internal fluid and refrigerant the external one; ii) NF and refrigerant flow in counter-current; iii) refrigerant is evaporating so its specific heat is infinite; iv) base fluid and NPs are in thermal equilibrium; v) fluid flow regime is fully developed; vi) thermophysical properties are taken at bulk temperature.
2.1 Thermophisical properties of nanofluids
Several models are proposed in the literature to estimate the different thermophysical properties (density, specific heat, thermal conductivity and dynamic viscosity) of NFs. Table 1 showed the models chosen in this work.
3rd IIR International Conference on Sustainability and the Cold Chain, London, UK, 2014
Table 1. Model equations for calculation of thermophysical properties of NFs Thermophysical
property Model equation Reference
Density nf
1v
bf vp (Vajjha et al., 2009) Specific heat
nf p p v bf bf v nf Cp Cp 1 Cp (Murshed, 2011) Thermal conductivity
P bf v bf P P bf v bf P bf nf k k k 1 n k k k 1 n k 1 n k k k (Hamilton and Crosser, 1962) Dynamic viscosity
v
2 v v nf 1 2.5 10.05 0.00273exp16.6 2.2 Convective heat transfer modelling
Applying the -NTU approach, the NF outlet temperature Th,o can be calculated
using the heat exchanger effectiveness E defined as the ratio between the actual heat transfer rate and the maximum possible heat transfer rate. The effectiveness of a counter-current flow heat exchanger is calculated with:
r
r r C 1 NTU exp C 1 C 1 NTU exp 1 E (2) where E is given by i, c i, h o , h i , h T T T T E (3)Given that the refrigerant flowing outside the tube is evaporating, the heat capacity ratio Cr = 0, therefore, the effectiveness is given by:
E1exp
NTU)
(4)The overall heat transfer coefficient U can be obtained using the -NTU approach: Cp m A U NTU (5)
Neglecting fouling and contact resistances, the overall heat transfer coefficient is related to the total thermal resistance by the following equation:
e w i h 1 R h 1 U 1 (6) The thermal resistance of the tube wall Rw is given by:
i e w i w d d ln k 2 d R (7)
The internal heat transfer coefficient hi is determined using the Nusselt number
calculated with the classical correlations: eq. (8) in laminar flow regime (Re<2300) and the correlation of Gnielinski (eq. (9)) in transition and turbulent regime.
3rd IIR International Conference on Sustainability and the Cold Chain, London, UK, 2014
/8
Pr 1
7 . 12 1 Nu 3 / 2 2 / 1 (9)In this formula, the Darcy coefficient
is given by:
2 10 Re 1.64 log 82 . 1 (10)2.3 Pressure drop modelling
The pressure drop is deduced from the following expression
2 nf 2 h A m d 2 L P (11)
The Darcy coefficient is calculated using eq. (10) in transition and turbulent regime and the Poiseuille equation (eq. (12)) in laminar flow regime:
Re 64
(12)
The flowing fluid mass flow rate m is calculated from the velocity v obtained from Reynolds number in the following way:
4 d v m 2 i nf (13)
3.
RESULTS AND DISCUSSION
The problem was solved for a tubular heat exchanger designed with straight copper tube with a length of 0.5 m, an inner diameter of 4 mm and a 1 mm thickness. The inlet temperature of NF was fixed at 20°C and the evaporator temperature at -30°C. Laminar and in turbulent regimes flowing were tested. An ethylene-glycol /water (EG 50/50) mixture was chosen as base fluid and several types of NPs (Al2O3, TiO2, SiO2, Co, Fe and CuO) with specific thermo-physical properties
were simulated. Equations were solved using a Matlab code.
0 0.05 0.1 0.15 0.2 0.25 0.3 0.35 0.4 0 0.2 0.4 0.6 0.8 1 1.2 1.4 1.6 1.8 2 Volume fraction PE Cnf /P E Cbf Al 2O3 SiO2 TiO 2 Co Fe CuO
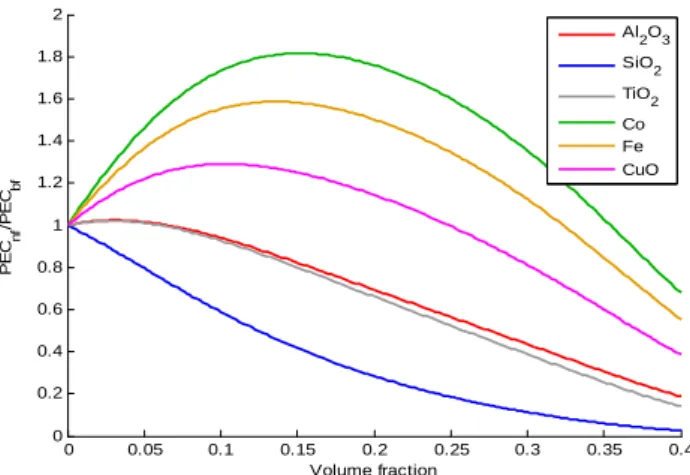
Figure 1.
Variation of the NFs and base fluid PEC ratio as a function of the NPs volume fraction for various types of NPs and for a Re = 10003rd IIR International Conference on Sustainability and the Cold Chain, London, UK, 2014
Figure 1 shows the evolutions of the ratio between NF and base fluid PEC (PECnf/PECbf) according to the NPs volume fraction for a Reynolds number of
1000. It can be seen that the NFs performance strongly depends on the NPs volume fraction and on the type of NPs. For Co, Fe and CuO NPs, the PEC ratio starts to increase for low volume fraction up to about 10% and then rapidly decreases, resulting in the existence of an optimum value of volume fraction that would maximise the energy performance of NFs. Maximum gains of 82%, 59% and 29% were respectively attained for Co, Fe and CuO. At the opposite the three others tested NPs (Al2O3, TiO2, SiO2) did not show any thermal performance increase
with NPs volume fraction. One can notice a rapid decrease of the PEC ratio in the case of SiO2 while the PEC ratio of Al2O3 and TiO2 show slower decreases in
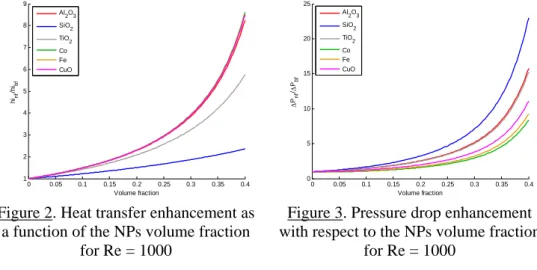
similar trends. These three latter types of NPs seem to be energetically less interesting than the base fluid even if a heat transfer enhancement occurred as shown in figure 2. It can be seen that the heat transfer coefficient increased by a factor as high as 9 undoubtedly due to the enhancement of thermal conductivity and of viscosity. It should be noted that despite this dramatic increase, the NF properties remain in the domain of validity of the heat transfer correlations used as it was verified with the calculation of Prandtl numbers for each case studied. Figure 3 shows the pressure drop of the various NFs studied in function of the NPs volume fraction respectively for Re = 1000. It can be observed that the evolution of pressure drop can be correlated to the evolution of the PEC ratio presented on figures 1. Indeed, the increase in pressure loss in function of NPs type corresponds to the decrease of energy performance. The largest pressure drop was obtained for SiO2-NF and the lowest for Co-NF. Inversely, in figure 1, the best energy
performance is found for Co-NF and the worst for SiO2-NF. Similar results were
obtained with simulation in turbulent regime (Re = 4000). The results about the pressure drop suggested an increase of the required pumping power compared to the base fluid and it seems that the energy performance of the NF is strongly driven by this pumping power, whatever the heat transfer enhancement. Pumping power is directly related to the NF viscosity which then represents a critical factor that deserves to be treated with care.
0 0.05 0.1 0.15 0.2 0.25 0.3 0.35 0.4 1 2 3 4 5 6 7 8 9 Volume fraction hinf /h ibf Al2O3 SiO2 TiO2 Co Fe CuO 0 0.05 0.1 0.15 0.2 0.25 0.3 0.35 0.4 0 5 10 15 20 25 Volume fraction Pnf / Pbf Al2O3 SiO2 TiO2 Co Fe CuO
Figure 2. Heat transfer enhancement as a function of the NPs volume fraction
for Re = 1000
Figure 3. Pressure drop enhancement with respect to the NPs volume fraction
3rd IIR International Conference on Sustainability and the Cold Chain, London, UK, 2014
4. MODEL VALIDATION
The model developed in this work was validated using published experimental data (Ferrouillat et al. 2011). This publication was chosen because it was the only one where we found all necessary input and output data to validate the model. However, the article deals with only one type of NP (SiO2) and with temperatures
between 20 and 70°C in cooling conditions. Despite this temperature range very different of what we can have in refrigeration field, validation of the model in these conditions can help to give confidence in the simulation results.
The NFs used were colloidal suspensions of SiO2 NPs in water of 5%, 16% and
34% mass fractions (respectively 2.3%, 7.95% and 18.93% volume fractions). The SiO2 NF was flowing inside the inner tube of a tube-in-tube heat exchanger with a
constant inlet temperature of 50°C. The inner tube has the same geometrical dimensions as those used for the previous simulation. The cooling water was counter-flow circulated in a 10 mm diameter and 1 mm thick outer tube with an inlet temperature of 20°C. NFs viscosity was calculated using empirical correlations established by authors depending on the NP mass fraction.
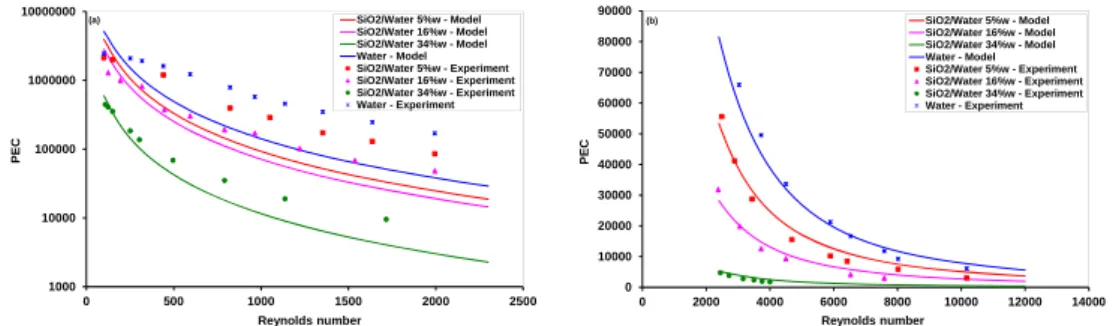
Figures 4(a) and (b) compare the evolution of experimental and simulated PEC criteria according to Reynolds number and SiO2 mass fraction respectively in
laminar and turbulent regime. It can be seen on figure 4(a) that the model failed to represent experimental results obtained with NFs in laminar region. At the opposite, very good agreement was obtained for turbulent Reynolds number for water as well as for NFs as shown in figure 4(b). The large difference found between predicted PEC and measured PEC in laminar conditions can be explained by the uncertainties on measured Nusselt numbers. Indeed, Ferrouillat et al. (2011) reported that relative errors up to 78% were found for low Reynolds numbers (Re < 1000) while uncertainties were only of the order of magnitude of 5% for high Reynolds numbers (Re > 2300). Authors attributed these high uncertainties to the probable longitudinal conduction effect along the tube wall. They also underlined that Poiseulles's law underestimates the pressure drop measurements for 1000 < Re < 2300 because of inserted thermocouples.
1000 10000 100000 1000000 10000000 0 500 1000 1500 2000 2500 PE C Reynolds number SiO2/Water 5%w - Model SiO2/Water 16%w - Model SiO2/Water 34%w - Model Water - Model SiO2/Water 5%w - Experiment SiO2/Water 16%w - Experiment SiO2/Water 34%w - Experiment Water - Experiment (a) 0 10000 20000 30000 40000 50000 60000 70000 80000 90000 0 2000 4000 6000 8000 10000 12000 14000 PE C Reynolds number SiO2/Water 5%w - Model SiO2/Water 16%w - Model SiO2/Water 34%w - Model Water - Model SiO2/Water 5%w - Experiment SiO2/Water 16%w - Experiment SiO2/Water 34%w - Experiment Water - Experiment (b)
Figure 4. Comparison between measured and predicted PEC values for SiO2/water
NFs at different concentrations in (a) laminar and (b) turbulent regimes Considering energy performance, it can be observed in figures 4 that the PEC values of the SiO2/water NFs are lower than those corresponding of water,
3rd IIR International Conference on Sustainability and the Cold Chain, London, UK, 2014
whatever the NPs concentration. This result means that the global thermal-hydraulic balance is unfavorable in comparison with pure water. Despite the significant heat transfer enhancement up to 30% observed by authors, a large increase in pumping power due to viscosity increase makes the balance rather negative. These findings about SiO2 are consistent with the simulation results
presented in previous section about SiO2/Ethylène glycol NFs.
5.
CONCLUSION
A model has been developed to assess the potential of different NFs to be used in refrigeration plants through the cold chain, in terms of energy performance. Simulation results showed that heat transfer coefficients significantly increased with the increase of NPs concentration for laminar and turbulent flow regimes. It was noticed that the heat transfer enhancement is strongly dependent on the type and the concentration of NPs. However, the pressure drop which is directly related to the pumping power also increased with the increase of NPs concentration whatever the flow regime. The compromise between thermal gain by heat transfer improvement and energy loss by pumping power increasing was evaluated through the PEC. Simulation results about the PEC have shown that some of the studied NFs (Al2O3, TiO2, SiO2) were clearly less efficient than the base fluid while the
others (Co, Fe, CuO) had a favourable energy performance. For these latter, it was found an optimum value of NPs concentration for which the PEC is maximised, depending on the type of NPs. Therefore, there would be no interest to work on particle concentrations beyond this value. The model was validated using published data and it was shown that classical existing correlations success to represent heat transfer and pressure loss behaviours of NFs in heat exchangers, when the required thermal and physical properties are taken into account. This work confirms the potential of NFs to intensify heat transfer when they are used in heat exchangers. This study also showed the great potential of NFs to improve energy efficiency and consequently to reduce environmental footprint of the overall cold chain.
NOMENCLATURE
Latin symbols Greek symbols
A Cp Cr d E h k m n Nu L Flow area (m2) Specific heat (J/kg K) Heat capacity ratio (-) Tube diameter (m)
Heat transfer effectiveness (-) heat transfer coefficient (W/m2 K) Thermal conductivity (W/m K) Mass flow rate (kg/s)
Shape factor (-) Nusselt number (-) Length (m) P Subscripts e i
Pressure drop (Pa) Darcy coefficient Dynamic viscosity (Pa.s) Density (kg/m3) Concentration (-) Sphericity (-) external inner
3rd IIR International Conference on Sustainability and the Cold Chain, London, UK, 2014 Re Rw T v U v Reynolds number (-) Thermal resistance (m2 K/W) Temperature (K) Velocity (m/s)
Overall heat transfer coef.(W/m2 K) Volumetric flow rate (m3/s)
o p v w Outlet; Outer Particle Volume Wall
REFERENCES
Ferrouillat, S., Bontemps, A., Poncelet, O., Soriano, O. & Gruss, J.-A. 2013, Influence of nanoparticle shape factor on convective heat transfer and energetic performance of water-based SiO2 and ZnO nanofluids, Applied Thermal
Engineering, 51 (1–2): 839-851.
Ferrouillat, S., Bontemps, A., Ribeiro, J.-P., Gruss, J.-A. & Soriano, O. 2011, Hydraulic and heat transfer study of SiO2/water nanofluids in horizontal tubes with imposed wall temperature boundary conditions, International Journal of Heat and
Fluid Flow, 32 (2): 424-439.
Hamilton, R. L. & Crosser, O. K. 1962, Thermal conductivity of heterogeneous two-component systems, I&EC Fund, 1 (3): 187-191.
Kumaresan, V., Mohaideen Abdul Khader, S., Karthikeyan, S. & Velraj, R. 2013, Convective heat transfer characteristics of CNT nanofluids in a tubular heat exchanger of various lengths for energy efficient cooling/heating system,
International Journal of Heat and Mass Transfer, 60 (0): 413-421.
Macchi, H., Guilpart, J. & Mahungu, A. (1999). Reduction de charge: comparaison entre detente directe, recirculation et réfrigération indirecte. Journée Française du Froid – Interclima 47–63.
Mahbubul, I. M., Saidur, R. & Amalina, M. A. 2013, Heat Transfer and Pressure Drop Characteristics of Al2O3-R141b Nanorefrigerant in Horizontal Smooth Circular Tube, Procedia Engineering, 56 (0): 323-329.
Maré, T., Halelfadl, S., Sow, O., Estellé, P., Duret, S. & Bazantay, F. 2011, Comparison of the thermal performances of two nanofluids at low temperature in a plate heat exchanger, Experimental Thermal and Fluid Science, 35 (8): 1535-1543. Murshed, S. M. S. 2011, Determination of effective specific heat of nanofluids,
Journal of Experimental Nanoscience, 6 (5): 539-546.
Sarkar, J. 2011, Performance of nanofluid-cooled shell and tube gas cooler in transcritical CO2 refrigeration systems, Applied Thermal Engineering, 31 (14–15): 2541-2548.
Vajjha, R. S., Das, D. K. & Mahagaonkar, B. M. 2009, Density Measurement of Different Nanofluids and Their Comparison With Theory, Petroleum Science and
Technology, 27 (6): 612-624.
Wang, K., Eisele, M., Hwang, Y. & Radermacher, R. 2010, Review of secondary loop refrigeration systems, International Journal of Refrigeration, 33 (2): 212-234.