Any correspondence concerning this service should be sent
to the repository administrator:
[email protected]
This is an author’s version published in:
http://oatao.univ-toulouse.fr/22449
Official URL
http://ceur-ws.org/Vol-2125/paper_102.pdf
Open Archive Toulouse Archive Ouverte
OATAO is an open access repository that collects the work of Toulouse
researchers and makes it freely available over the web where possible
To cite this version:
Ramiandrisoa, Faneva and Mothe, Josiane
and Benamara, Farah and Moriceau, Véronique IRIT at e-Risk 2018.
(2018) In: 9th Conference and Labs of the Evaluation Forum, Living
Labs (CLEF 2018), 10 September 2018 - 14 September 2018
IRIT
at e-Risk 2018
Faneva Ramiandrisoa1, Josiane Mothe1, Farah Benamara1, and V´eronique Moriceau1,2
1
IRIT, UMR5505, CNRS & Universit´e de Toulouse, France {faneva.ramiandrisoa,josiane.mothe,benamara}@irit.fr
2
LIMSI, CNRS, Universit´e Paris-Sud, Universit´e Paris-Saclay, France [email protected]
Abstract. The 2018 CLEF eRisk is composed of two tasks: (1) early de-tection of signs of depression and (2) early dede-tection of signs of anorexia. In this paper, we present the methods we developed when participating to these two tasks. We used two types of representations of the texts: one uses linguistic features and the other uses text vectorization. These representations are combined in different ways in models that are trained using a machine learning approach. These models are then used to built the 5 runs we submitted for task (1) and the 2 runs for task (2), which differences are also detailed in this paper. For task (1), best results were obtained when combining the methods based on features and text vec-torization, and for task (2), the method based on text vectorization gives the best results.
Keywords: Information retrieval · Depression detection · Anorexia de-tection · Social media · Natural language processing · Machine learning
1
Introduction
The CLEF eRisk pilot task aims at detecting early trace of risk on the Internet, especially those related to safety and health. The main goal of eRisk is: ”to pioneer a new interdisciplinary research area that would be potentially applicable to a wide variety of situations and to many different personal profiles, such as potential paedophiles, stalkers, individuals with a latent tendency to fall into the hands of criminal organisations, people with suicidal inclinations, or people susceptible to depression” [8].
To achieve this goal, the task organizers proposed two exploratory tasks: early risk detection of depression and early risk detection of anorexia [9]. The challenge is to detect early traces of these diseases in texts published by users in social media.
This paper describes the participation of the IRIT team at CLEF 2018 eRisk pilot task for early detection of depression and early detection of anorexia. The team submitted 5 runs for the depression task and 2 runs for the anorexia one. These runs as well as the way they have been obtained and results are described in this paper.
The remaining of this paper is organized as follows: Section 2 gives a de-scription of the two eRisk pilot tasks. Section 3 details our participation to early detection of signs of depression. Then Section 4 details our participation to early detection of signs of anorexia. Finally, Section 5 concludes this paper.
2
Tasks Description
For both tasks, the main goal is to detect as soon as possible some signs of changes in texts: signs of depression for task (1) and signs of anorexia for task (2). The detection is based on a text collection sorted in a chronological order and divided into 10 chunks3.
Both tasks were divided into two stages: training stage and testing stage. For both tasks, the training stage began on November 30, 2017, when the two training collections were released. The testing stage began on February 6, 2018, when the chunks 1 of the two test collections were released. Then a new chunk for each task was release every week, until April 10, 2018 when chunks 10 were provided. Every week during the testing stage, participants had to send a run where the system had to make a three-way decision for each user: annotate the user as depressed/anorexic (task (1)/task (2)), annotate the user as non depressed/non anorexic, or wait to see more chunks (i.e. the next chunk of data). As soon as the system annotates a user, this decision could not be changed for future chunks of data, in other word, the decision was final. For chunk 10, systems had to make a decision for each user in the test collection, i.e. the decision for the latest chunk was two-way: annotate the user as depressed/anorexic, or annotate the user as non depressed/non anorexic.
For the evaluation of systems, a new measure (see Section 2.1) was defined to take into account the correctness of the system decision and the delay taken to emit its decision (i.e. how early in the series of chunks the decision was taken). More details about the characteristics of both tasks can be found in [9].
2.1 Evaluation metric
For both tasks, an error measure for early risk detection (ERDE) [7] is used. Using this measure, the fewer writings used to make the decision, the better the system.
The ERDE value of the system is the mean of the ERDE obtained for each user computed with Equation 1.
ERDEo(d, k) =
cf p if d = positive AN D ground truth = negative (F P )
cf n if d = negative AN D ground truth = positive (F N )
lco(k) · ctp if d = positive AN D ground truth = positive (T P )
0 if d = negative AN D ground truth = negative (T N )
(1)
Where:
3
chunk 1 contains the first 10% of each users writings (the oldest), chunk 2 contains the second 10% and so forth.
– cf n= ctp= 1;
– cf p= proportion of positive cases in the test collection;
– d = binary decision for the user taken by the system with delay k; – lco(k) = 1+e1k−o;
– o is a parameter and equal 5 for ERDE5and equal 50 for ERDE50. The delay k is the number of writings needed to make the decision. For example, suppose a user had 100 writings in each chunk and the system gave a decision for the user after the chunk 3 of data, then the delay k was set to 300. Standard classification measures, such as the F-measure, Precision and Re-call, are also employed to compare participant’s systems.
3
Task 1: Early Detection of Signs of Depression
3.1 Dataset
The dataset of this second edition of eRisk on depression detection is an extension of first edition described in [8, 7]. It is composed of chronological sequences of posts and comments from Reddit4 social media platform, for a total of 214 depressed users and a random control group of 1,493 users.
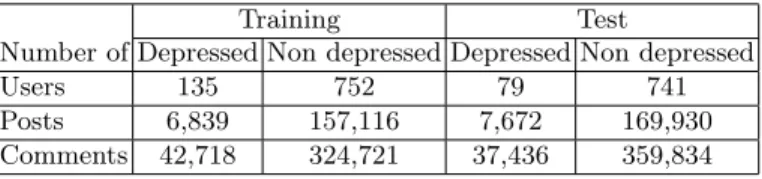
The construction of the CLEF 2018 eRisk depression dataset is the same as for CLEF 2017 eRisk: the organizers have collected a maximum number of sub-missions (posts and comments) from any subreddits for each user and the users with fewer than 10 submissions were excluded. In the collection, users are clas-sified as depressed and non depressed. A user is considered as depressed if s/he expresses having been diagnosed with depression in his/her posts/comments such as ”I was diagnosed with depression”, and then it was manually verified if it was really genuine. These posts/comments that contain self-expressions of depression were discarded from the dataset in order to make a non-trivial detection. On the other hand, users are considered as non depressed if their posts/comments in depression subreddits do not contain any expression of depression. Others users and their posts were also crawled from random subreddits and considered as non depressed. In total, the training dataset contains 135 depressed users and 752 non depressed users, while the test dataset contains 79 depressed users and 741 non depressed users. Table 1 reports a summary of some characteristics of the training and test datasets.
3.2 Additional dataset
During the training stage, we used an additional dataset to build our models: the Clpsych 2016 dataset [11]. We added this other dataset in order to get more information regarding depressed users during the training stage. This dataset is composed of forum posts written between July 2012 and June 2015, where each post is annotated using a semaphore pattern to indicate the level of risk in the
4
Table 1. Distribution of training and test data on eRisk 2018 data collection for depression detection.
Training Test
Number of Depressed Non depressed Depressed Non depressed
Users 135 752 79 741
Posts 6,839 157,116 7,672 169,930
Comments 42,718 324,721 37,436 359,834
text; this dataset is not only depression-related but rather it considers various mental diseases such as Crisis (there is an imminent risk of being harmed, or harming themselves or others), Red (there is a risk and the user needs help as soon as possible), Amber (there is a risk but the user does not need help immediately), and Green (there is no risk).
As the problem for depression detection is a binary classification (depressed or non-depressed), we changed the Clpsych 2016 dataset annotations as follows: if a post is tagged as Crisis or Red or Amber, the post is annotated as depressed (even if this is another mental trouble) and if a post is tagged as Green, it is considered as non depressed. We used Clpsych 2016 training and test data sets as additional data during the training stage. As results, we get additional data that contains 473 depressed users and 715 non depressed users.
3.3 Models
Two types of models have been used for early detection of depression which resulted in 5 different runs submitted.
Feature-based model
This kind of model requires feature engineering relying on a set of statistical or linguistic-based features. For each user, features are computed as follows: the feature value for each of his/her writings (posts or comments) is computed, then the value over his/her writings in the chunk are averaged. When several chunks are used for a given user, the feature values obtained are averaged.
Table 2 presents the features (in total 58) we extracted from users’ writings. Some of them have already been used in our participation in eRisk 2017 (the first edition) [10] and in our previous work [1], while others are inspired from the work of Trotzek et al. [16] (the latter are put in bold font).
Table 2: Details of the features extracted from texts. Non-bold features were initially used in our previous works [10, 1] while bold-font features are new features, inspired from the literature of the domain [16].
1-18 Bag of words 18 most frequent uni-grams in the training set.
NumberName Hypothesis or tool/resource used 19-22 Part-Of-Speech
fre-quency
Higher usage of adjectives, verbs and ad-verbs and lower usage of nouns [2]. 23 Negation Depressive users use more negative words
like: no, not, didnt, can’t, ...
24 Capitalized Depressive users tend to put emphasis on the target they mention.
25 Punctuation marks ! or ? or any combination of both tend to express doubt and surprise [17].
26 Emoticons Another way to express sentiment or feeling.
27 Average number of posts
Depressed users have a much lower number of posts.
28 Average number of words per post
Posts of depressed user are more longer. 29 Minimum number of
posts
Generally depressive users have a lower value.
30 Average number of comments
Depressed users have a much lower number of comments.
31 Average number of words per comment
Comments of depressed and non depressed users have different means.
32 Ratio of Posting Time High frequency of publications in deep night (00 pm - 07 am).
33-37 First person pronouns High use of : I, me, myself, mine, my. 38 All first person
pro-nouns
Sum of frequency of each first pronoun [17]. 39 I in subjective context Depressive users refers to themselves
fre-quently (all I targeted by an adjective). 40 I subject of be High use of I’m.
41 Over-generalization Depressed users tend to use intense quan-tifiers and superlatives [15].
42 Temporal expressions High use of words that refer to past: last,before,ago, ...[15].
43 Past tense verbs Depressive people talk more about the past.
44 Past tense auxiliaries Same motivation as above.
45 Past frequency Combination of temporal expressions and past tense verbs.
NumberName Hypothesis or tool/resource used 46 Depression symptoms
and related drugs
From Wikipedia list5and list of De Choud-hury et al. [2].
47 Frequency of ”depress” Depressed people talk often about the depression.
48 Relevant 3-grams 25 3-grams described from [3]. 49 Relevant 5-grams 25 5-grams described from [3].
50-51 Sentiment Use of NRC-Sentiment-Emotion-Lexicons6[12] to trace the polarity in users writings.
52 Emotions Frequency of emotions from specific cat-egories: anger, fear, surprise, sadness and disgust.
53 Sleepy Words Depressive users talk more about their sleeping.
54 Gunning Fog Index Estimate of the years of education that a person needs to understand the text at first reading [16].
55 Flesch Reading Ease
Measure how difficult to understand a text is [16].
56 Linsear Write For-mula
Developed for the U.S. Air Force to calcu-late the readability of their technical man-uals [16]7.
57 New Dale-Chall Readability
Measure the difficulty of comprehension that persons encounter when reading a text [16]. It is inspired from Flesch Reading Ease measure [4].
58 Drugs name The chemical and brand names of an-tidepressants from WebMD8 available in United States[16].
At training stage, we built 2 models where the first (Model 58 feat) used all the features from Table 2 and the second (Model 18 feat) only eighteen features which are : Part-Of-Speech frequency without adjectives, Negation, Capitalized, Emoticons, All first pronouns, I in subjective concept, I subject to be, Past tense
5 http://en.wikipedia.org/wiki/List of antidepressants, Accessed on 2017-02-23 6
http://saifmohammad.com/WebPages/NRC-Emotion-Lexicon.htm, Accessed on 2017-02-23
7
http://www.streetdirectory.com/travel guide/15675/writing/how to choose the be-st readability formula for your document.html, Accessed on 2018-02-25
8
http://www.webmd.com/depression/guide/depression-medications-antidepressants, Accessed on 2018-01-10
auxiliaries, Depression symptoms & related drugs, Frequency of ”depress”, Rele-vant 3-grams, Gunning Fog Index, Flesch Reading Ease, Linsear Write Formula, New Dale-Chall Readability, and Drugs name. We chose these eighteen features for the second model because the combination of these features, among other combinations we tested, gave the best results on the training data. We used Chi-squared ranking to rank features and then choose the combinations that used the best ranked features. The two models are built with Random Forest trained with the following parameters: class weight=”balanced”, max features=”sqrt”, n estimators=60, min weight fraction leaf=0.0, criterion=’entropy’, random sta te=2.
Text vectorization model
This model is based on text vectorization relying on doc2vec [6] to represent user’s writings (posts or comments) as a vector. We first compute the vectors for each writing and then average them to get the final vector of the user.
We trained two separate models, Distributed Bag of Words and Distributed Memory model, as done in [16] on eRisk 2018 training dataset (on depression) and Clpsych 2016 dataset. The output of these two models are concatenated, giving a 200-dimensional vector per text, as done by Trotzek et al. [16] and recommended by Le and Mikolov [6]. To avoid unseen vector for a text in eRisk test dataset, we used an inference step that outputs a new text vector without changing the trained models (i.e. all network weights). We call doc2vec train data this concatenation of these two models.
As above, we trained two other separate vector models but this time on both eRisk 2018 complete dataset (training and test datasets on depression) and Clpsych 2016 dataset. We used the test dataset to avoid unseen vector for a text in the test set and to have a better vector representation of text because all vectors weights are computed from words in both training and test sets which is not the case of an inference step. As the release of test datasets during the eRisk task is done chunk by chunk, and in order to have doc2vec trained on both training and test datasets, we re-trained the two doc2vec models on the training and the part of test sets. The output of these two models are also concatenated, giving a 200-dimensional vector per text. We call doc2vec all data this concatenation of these two models.
Two models based on text vectorization have been built, namely Model doc2vec train data and Model doc2vec all data. Recall that the latter uses the training data and test data available at the time it is run.
Both models used a logistic regression classifier trained on the vectors of the eRisk 2018 training and Clpsych 2016 datasets, built with doc2vec train data for first model and doc2vec all data for the second. The parameters used during training for both models based on text vectorization are as follows: class weight= ”balanced”, random state=1, max iter=100, solver=”liblinear”.
3.4 Results
We submitted five runs: LIIRA, LIIRB, LIIRC, LIIRD and LIIRE. Table 3 reports which combinations are used for each run. We can see that in LIIRA run, we first uses Model 58 feat until chunk 2, then we changed to Model 18 feat. LIIRE uses only Model 18 feat. The three other runs are a combination of two models, one based on features and the other based on text vectorization. LIIRC and LIIRB are similar; the difference is the time in chunk they started. Although we experimented the use of doc2vec model only but decided not to use as a run because of its poor results when used alone.
Table 3. Models used in each run.
Name Models used
Used for the first time in chunk LIIRA Model 58 feat (chunk 1-2) and Model 18 feat (chunk 3-10) 1 LIIRB Combination of Model 18 feat and Model doc2vec train data 3 LIIRC Combination of Model 18 feat and Model doc2vec train data 4 LIIRD Combination of Model 18 feat and Model doc2vec all data 4
LIIRE Model 18 feat 6
Each week (chunk released), these five systems took a decision about each user: he or she is depressed/non depressed; alternatively, the system could wait for more chunks (see section 2). To solve this problem for LIIRA and LIIRE, which are not a combination of two models, we defined a threshold on the pre-diction confidence scores associated to the system decision on a user. If the confidence score exceeds the set threshold, the user is annotated otherwise the system waits for more chunks. This solution is used to annotate the user as non-depressed while user is annotated as non-depressed as soon as the system predicts it whatever the the prediction confidence score. Table 4 shows the evolution of the threshold for both runs according to the chunks.
For the other three runs LIIRB, LIIRC, and LIIRD, a user is defined as de-pressed if the two models they are composed of predict that the user is dede-pressed. In other cases, a user is considered as depressed if the model based on text vec-torization predicts that the user is depressed, but we consider various threshold on the confidence score depending on the number of documents the model uses: the user will be considered as depressed if the system associates a probability higher than 0.55 when using at least 20 documents written by that user, 0.7 when using 10 documents, and above 0.9 when using more than 200 documents. Reversely, a user is considered as non-depressed if the model based on text vec-torization predicts that the user is non-depressed with probabilities below 0.45 when using at least 100 documents, 0.4 when using at least 50 documents, 0.3 with at least 20 documents and all probabilities below 0.1. At chunk 9, users who are not tagged by systems as depressed are considered as non depressed.
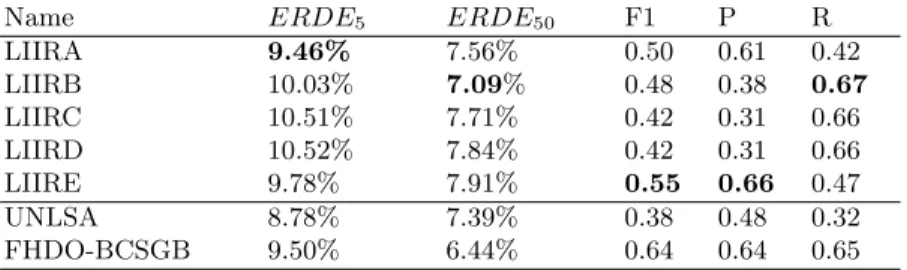
Our results are quite good in terms of ERDE (see section 2.1). LIIRA gives the best ERDE5while LIIRE achieved the best Precision and F-measure. LIIRB
Table 4. Evolution of the decision threshold for the LIIRA and LIIRE runs according to the considered chunk
.
Chunk
Model 1 2 3 4 5 6 7 8 9 10
LIIRA 0.95 0.95 0.95 0.9 0.9 0.8 0.5 0.5 0.5 0.5
LIIRE - - - 0.8 0.7 0.65 0.6 0.5
achieves the best ERDE50 and Recall. Table 5 gives all the results we obtained during the task.
Table 5. Results for our 5 runs and the runs that achieved the best ERDE5 and best
ERDE50. The lower, the better.
Name ERDE5 ERDE50 F1 P R
LIIRA 9.46% 7.56% 0.50 0.61 0.42 LIIRB 10.03% 7.09% 0.48 0.38 0.67 LIIRC 10.51% 7.71% 0.42 0.31 0.66 LIIRD 10.52% 7.84% 0.42 0.31 0.66 LIIRE 9.78% 7.91% 0.55 0.66 0.47 UNLSA 8.78% 7.39% 0.38 0.48 0.32 FHDO-BCSGB 9.50% 6.44% 0.64 0.64 0.65
Compared to other participants, over the 45 runs, we achieved the second Precision, the fifth F-measure, the sixth ERDE5and the seventh ERDE50. More details on results can be found in [9]. The best results in the competition are: 8.78% for ERDE5, 6.44% for ERDE50, 0.64 for F-measure, 0.67 for Precision and 0.95 for Recall. These values are from different runs.
4
Task 2: Early Detection of Signs of Anorexia
4.1 Dataset
This is the first edition for eRisk on early detection of signs of anorexia. The dataset for this task has the same format as the dataset for the depression detection task described above and the source of data is also the same (Reddit forum).
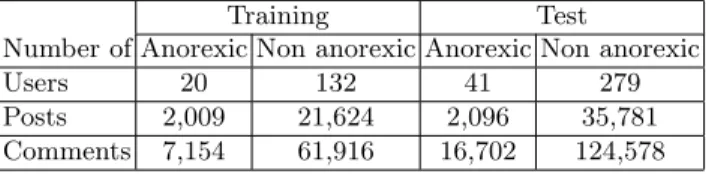
In this task, we focus on two kinds of Reddit forum users: those who were diagnosed with anorexia (61 users, 20 users in the training set and 41 in the testing set) and those who are not (control group) (411 users from which 132 are in the training set and 279 users in the testing set). In the collection, each user has a sequence of writings in chronological order. Table 6 reports a summary of some basic characteristics of the training and test datasets.
4.2 Model
In this section, we describe the model we used to built the 2 runs we submitted for early detection of anorexia and detail later the differences between the runs.
Table 6. Distribution of training and test data on eRisk 2018 data collection for anorexia detection.
Training Test
Number of Anorexic Non anorexic Anorexic Non anorexic
Users 20 132 41 279
Posts 2,009 21,624 2,096 35,781
Comments 7,154 61,916 16,702 124,578
The model is based on text vectorization using doc2vec like for the previous task. Each user is represented by a vector which is the average of the vectors of each writing of that user.
As for depression detection, we trained two separate models, Distributed Bag of Words and Distributed Memory model, on eRisk 2018 anorexia train-ing dataset. The output of these two models are concatenated, givtrain-ing a 200-dimensional vector per text, as done for depression detection and recommended by the developers of doc2vec [6].
A logistic regression classifier was then trained on the 200-dimensional vec-tors of the training set with the following parameters: class weight=”balanced”, random state=1, max iter=100, solver=”liblinear”. We called the model we built Model doc2vec.
4.3 Results
We submitted two runs: LIIRA and LIIRB. Both runs are based on the same model Model doc2vec described above. The difference is that LIIRA is used for the first time in chunk 3 while LIIRB in chunk 6.
For both runs, a user is considered as anorexic if the model predicts that he/she is with a probability higher than 0.55 when using at least 20 documents written by the user, 0.7 when using at least 10 documents, all probabilities above 0.9 when useing more than 200 documents. A user is considered as non anorexic if the model predicts that the user is with a probability below 0.45 and at least 100 documents, 0.4 and at least 50 documents, 0.3 and at least 20 documents, and all probabilities below 0.1. At chunk 7 for LIIRA and chunk 10 for LIIRB, users who are not tagged by the model as anorexic are considered as non anorexic.
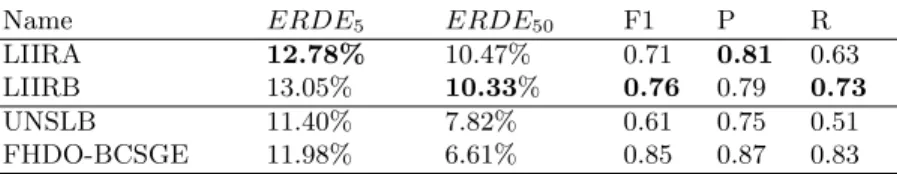
Table 7 gives the results we obtained. Among our two runs, LIIRA achieves the best ERDE5 and Precision while LIIRB achieves the best ERDE50, Recall and F-measure. Our results are encouraging although they can be improved.
Compared to other participants, over the 34 runs, we achieved the fifth F-measure, the eighth Precision, the ninth Recall, the eleventh ERDE5 and the fourteenth ERDE50. More details on results can be found in [9]. The best re-sults in the competition are: 11.40% for ERDE5, 6.61% for ERDE50, 0.85 for F-measure, 0.91 for Precision and 0.88 for Recall. These values are from differ-ent runs.
Table 7. Results for our 2 runs and the runs that achieved the best ERDE5 and best
ERDE50
Name ERDE5 ERDE50 F1 P R
LIIRA 12.78% 10.47% 0.71 0.81 0.63
LIIRB 13.05% 10.33% 0.76 0.79 0.73
UNSLB 11.40% 7.82% 0.61 0.75 0.51
FHDO-BCSGE 11.98% 6.61% 0.85 0.87 0.83
5
Conclusion and Future Work
In this paper, we presented our participation to the CLEF 2018 eRisk for both tasks : (1) early detection of depression signs and (2) early detection of signs of anorexia. We submitted 5 runs for the task (1) and 2 runs for the task (2) that are based on machine learning technique that relies on various linguistic features and/or classifier based on text vectorization.
For task (1) we achieved the second Precision, the fifth F-measure, the sixth ERDE5 and the seventh ERDE50; for task (2) we achieved the fifth F-measure, the eighth Precision, the ninth Recall, the eleventh ERDE5 and the fourth ERDE50.
For future work, we will analyse the features used for task (1) to get better results and identify those that can be adapted to task (2). Another direction is to analyse deeply the impact of using the different features in the various tasks in order to know which features are more specific of which risk detection. For example, we could compare the features used in the e-risk challenges and in the TRAC challenge [13]; this latter challenge aims at detecting the existence of aggressiveness in a text [5]. We would like to complete the features with key phrase representation, following our previous research on this topic [14]. Finally, we would like to develop a model based on deep learning in order to avoid the feature engineering step and to give insights on how well such approach could capture the discriminating features.
References
1. Benamara, F., Moriceau, V., Mothe, J., Ramiandrisoa, F., He, Z.: Automatic De-tection of Depressive Users in Social Media. In: 15e Confrence en Recherche dIn-formation et Applications (CORIA) (2018)
2. Choudhury, M.D., Gamon, M., Counts, S., Horvitz, E.: Predicting de-pression via social media. In: Proceedings of the Seventh International Conference on Weblogs and Social Media. The AAAI Press (2013), http://www.aaai.org/ocs/index.php/ICWSM/ICWSM13/paper/view/6124 3. Colombo, G.B., Burnap, P., Hodorog, A., Scourfield, J.: Analysing the
connectivity and communication of suicidal users on Twitter. Computer Communications 73 (2016). https://doi.org/10.1016/j.comcom.2015.07.018, https://doi.org/10.1016/j.comcom.2015.07.018
4. Dale, E., Chall, J.S.: A formula for predicting readability. Educational Research Bulletin pp. 11–28 (1948)
5. Kumar, R., Ojha, A.K., Malmasi, S., Zampieri, M.: Benchmarking Aggression Iden-tification in Social Media. In: Proceedings of the First Workshop on Trolling, Ag-gression and Cyberbulling (TRAC). Santa Fe, USA (2018)
6. Le, Q.V., Mikolov, T.: Distributed representations of sentences and docu-ments. In: Proceedings of the 31th International Conference on Machine Learn-ing, ICML 2014, BeijLearn-ing, China, 21-26 June 2014. pp. 1188–1196 (2014), http://jmlr.org/proceedings/papers/v32/le14.html
7. Losada, D.E., Crestani, F.: A test collection for research on depression and language use. In: Conference Labs of the Evaluation Forum. p. 12. Springer (2016)
8. Losada, D.E., Crestani, F., Parapar, J.: eRISK 2017: CLEF Lab on Early Risk Prediction on the Internet: Experimental foundations. In: Proceedings Conference and Labs of the Evaluation Forum CLEF 2017. Dublin, Ireland (2017)
9. Losada, D.E., Crestani, F., Parapar, J.: Overview of eRisk – Early Risk Predic-tion on the Internet. In: Experimental IR Meets Multilinguality, Multimodality, and Interaction. Proceedings of the Ninth International Conference of the CLEF Association (CLEF 2018). Avignon, France (2018)
10. Malam, I.A., Arziki, M., Bellazrak, M.N., Benamara, F., Kaidi, A.E., Es-Saghir, B., He, Z., Housni, M., Moriceau, V., Mothe, J., Ramiandrisoa, F.: IRIT at e-risk. In: International Conference of the CLEF Association, CLEF 2017 Labs Working Notes, Dublin, Ireland, September, 11/09/2017-14/09/2017. ISSN 1613-0073, vol. 1866. CEUR Workshop Proceedings (2017), http://ceur-ws.org/Vol-1866/paper 135.pdf
11. Milne, D.N., Pink, G., Hachey, B., Calvo, R.A.: Clpsych 2016 shared task: Triag-ing content in online peer-support forums. In: ProceedTriag-ings of the 3rd Workshop on Computational Linguistics and Clinical Psychology: From Linguistic Signal to Clin-ical Reality, CLPsych@NAACL-HLT 2016, June 16, 2016, San Diego, California, USA. pp. 118–127 (2016), http://aclweb.org/anthology/W/W16/W16-0312.pdf 12. Mohammad, S., Turney, P.D.: Crowdsourcing a word-emotion association
lex-icon. Computational Intelligence 29(3) (2013). https://doi.org/10.1111/j.1467-8640.2012.00460.x, https://doi.org/10.1111/j.1467-8640.2012.00460.x
13. Mothe, J., Ramiandrisoa, F.: IRIT at TRAC 2018. In: Proceedings of the First Workshop on Trolling, Aggression and Cyberbulling (TRAC). Santa Fe, USA (in review) (2018)
14. Mothe, J., Ramiandrisoa, F., Rasolomanana, M.: Automatic Keyphrase Extraction using Graph-based Methods. In: ACM Symposium on Applied Computing (SAC). ACM (2018)
15. Mowery, D.L., Park, A., Bryan, C., Conway, M.: Towards automatically clas-sifying depressive symptoms from Twitter data for population health. In: Proceedings of the Workshop on Computational Modeling of People’s Opin-ions, Personality, and Emotions in Social Media, PEOPLES@COLING (2016), https://aclanthology.info/papers/W16-4320/w16-4320
16. Trotzek, M., Koitka, S., Friedrich, C.M.: Linguistic metadata augmented classifiers at the CLEF 2017 task for early detection of depression. In: Working Notes of CLEF (2017), http://ceur-ws.org/Vol-1866/paper 54.pdf
17. Wang, X., Zhang, C., Ji, Y., Sun, L., Wu, L., Bao, Z.: A depression de-tection model based on sentiment analysis in micro-blog social network. In: Trends and Applications in Knowledge Discovery and Data Mining -PAKDD 2013 International Workshops. Lecture Notes in Computer Sci-ence, vol. 7867. Springer (2013). https://doi.org/10.1007/978-3-642-40319-4 18, https://doi.org/10.1007/978-3-642-40319-4 18