Differential Levels of Soluble Inflammatory Markers by Human
Immunodeficiency Virus Controller Status and Demographics
The MIT Faculty has made this article openly available.
Please share
how this access benefits you. Your story matters.
Citation
Li, J. Z., K. B. Arnold, J. Lo, A.-S. Dugast, J. Plants, H. J. Ribaudo,
K. Cesa, et al. “Differential Levels of Soluble Inflammatory
Markers by Human Immunodeficiency Virus Controller Status and
Demographics.” Open Forum Infectious Diseases 2, no. 1 (December
16, 2014): ofu117–ofu117.
As Published
http://dx.doi.org/10.1093/ofid/ofu117
Publisher
Oxford University Press
Version
Final published version
Citable link
http://hdl.handle.net/1721.1/99496
Terms of Use
Creative Commons Attribution
M A J O R A R T I C L E
Differential Levels of Soluble In
flammatory
Markers by Human Immunode
ficiency Virus
Controller Status and Demographics
Jonathan Z. Li,1,aKelly B. Arnold,2,aJanet Lo,3Anne-Sophie Dugast,4Jill Plants,5Heather J. Ribaudo,6Kevin Cesa,3 Andrea Heisey,1Daniel R. Kuritzkes,1Douglas A. Lauffenburger,2Galit Alter,4Alan Landay,5Steven Grinspoon,3and Florencia Pereyra1,3
1Brigham and Women’s Hospital, Harvard Medical School, Cambridge, Massachusetts;2Massachusetts Institute of Technology, Cambridge; 3Massachusetts General Hospital, Boston;4Ragon Institute of MGH, MIT, and Harvard, Cambridge, Massachusetts;5Rush University Medical Center,
Chicago, Illinois; and6Harvard School of Public Health, Boston, Massachusetts
Background. Human immunodeficiency virus (HIV)-1 elite controllers (ECs) represent an ideal population to study the effects of HIV persistence on chronic inflammation in the absence of antiretroviral therapy (ART).
Methods. Twenty inflammatory markers measured in cohorts of ECs, HIV suppressed noncontrollers, and HIV-uninfected controls were compared using rank-based tests and partial least squares discriminant analysis (PLSDA). Spearman correlations were determined among the inflammatory markers, residual viremia by the single-copy assay, and CD4+T cell slope.
Results. Significant differences were seen between cohorts in 15 of the soluble inflammatory markers. Human immunodeficiency virus-1 ECs were found to have the highest levels for all of the markers with the exception of RANTES. In particular, median levels of 7 inflammatory markers (soluble CD14 [sCD14], interferon [IFN]-γ, IFN-γ-inducible protein [IP]-10, interleukin [IL]-4, IL-10, sCD40L, and granulocyte-macrophage colony-stimulating factor) were twice as high in the HIV-1 ECs compared with either of the HIV-suppressed or uninfected groups. Multivariate PLSDA analysis of inflammatory markers improved differentiation between the patient cohorts, dis-cerning gender differences in inflammatory profile amongst individuals on suppressive ART. Soluble markers of inflammation in ECs were not associated with either levels of residual HIV-1 viremia or CD4+
T cell decline. Conclusions. Despite maintaining relatively low levels of viremia, HIV-1 ECs had elevated levels of a set of key inflammatory markers. Additional studies are needed to determine whether ECs may benefit from ART and to further evaluate the observed gender differences.
Keywords. antiretroviral therapy; gender; HIV elite controllers; inflammation; low-level viremia.
The use of antiretroviral therapy (ART) has led to a dra-matic decline in the mortality rates of individuals
infected with human immunodeficiency virus (HIV). However, the life expectancy of patients with HIV may be shorter compared with the general population, even for individuals on ART with relatively preserved CD4+ cell counts [1,2]. A significant contributor to the excess mortality is likely from non-acquired im-mune deficiency syndrome (AIDS)-defining events, which represent a growing cause of morbidity and mor-tality in patients infected with HIV [3,4]. In particular, patients infected with HIV have been found to be at higher risk for cardiovascular disease and serious card-iac events [5,6]. One proposed mechanism involves elevated levels of inflammation found in HIV patients on ART compared with those who are HIV-uninfected. Soluble markers of inflammation have been associated
Received 25 August 2014; accepted 10 December 2014. a
J. Z. L. and K. B. A. authors contributed equally to this study.
Presented in part: 2013 International Workshop on HIV & Hepatitis Virus Drug Resistance and Curative Strategies, Toronto, Canada.
Correspondence: Jonathan Li, MD, MMSc, Division of Infectious Diseases, Brig-ham and Women’s Hospital, 65 Landsdowne Street, Rm 435 Cambridge, MA 02139 (jli22@partners.org).
Open Forum Infectious Diseases
© The Author 2014. Published by Oxford University Press on behalf of the Infectious Diseases Society of America. This is an Open Access article distributed under the terms of the Creative Commons Attribution-NonCommercial-NoDerivs licence (http:// creativecommons.org/licenses/by-nc-nd/4.0/), which permits non-commercial reproduction and distribution of the work, in any medium, provided the original work is not altered or transformed in any way, and that the work is properly cited. For commercial re-use, please contact journals.permissions@oup.com.
with elevated arterial wall inflammation [7] and coronary artery disease [8,9] in patients infected with HIV. In addition, soluble markers of inflammation have been found to better predict non-AIDS-defining events than cellular markers of T-cell acti-vation [10].
Human immunodeficiency virus-1 elite controllers (ECs) represent an exceptional group of patients who are able to sup-press HIV-1 viremia in the absence of ART. Human immuno-deficiency virus-1 ECs represent an ideal population to study the effects of HIV low-level viremia on systemic inflammation in the absence of any ART-specific effects. Elite controllers have stronger HIV-specific CD8+T-cell responses and higher levels of T-cell activation compared with either chronically HIV-infected patients on suppressive ART or HIV-unHIV-infected indi-viduals [11]. Furthermore, T-cell activation has been linked to lower CD4+T-cell counts in this population [12]. However, relatively little is known about the effects of systemic inflam-mation and soluble markers of innate immune activation in HIV-1 ECs. There is evidence that ECs have elevated levels of C-reactive protein [13], innate immune system activation [14], and plasma lipopolysaccharide (LPS), which is related to the mucosal translocation of bacterial products and is associated in noncontrollers with elevated levels of soluble monocyte and macrophage markers of inflammation [8]. In addition, we have previously reported increased sCD14 in HIV-1 ECs compared with HIV-suppressed subjects and increased coro-nary atherosclerosis compared with HIV-uninfected controls [15]. However, the role that chronic low-level viral replication, which can be suppressed with combination ART, has on this phenomenon is unknown. In this follow-up study, we hypoth-esize that chronic low-level viral replication is associated with systemic inflammation in ECs and in turn with CD4+T-cell loss. To test these hypotheses, we have (1) expanded both the number of ECs and the types of inflammatory markers tested, (2) evaluated the relationship between low-level viral load and soluble markers of inflammation in HIV-1 ECs, and (3) determined the relationship between soluble markers of inflammation with viral load and CD4+T cell decline in HIV-1 ECs.
MATERIALS AND METHODS
Study Subjects
Human immunodeficiency virus-1 ECs able to suppress HIV-1 viral load in the absence of ART were identified from the Inter-national HIV Controllers Study [16]. Levels of inflammation in 42 HIV-1 ECs were compared with 2 comparison cohorts: 80 HIV-suppressed, chronically infected, HIV-1 non-ECs (“HIV suppressed”) and 43 HIV-uninfected individuals. Both compar-ison cohorts were previously described and included individuals ages 40–60 with no known cardiovascular or renal disease who underwent computed tomography angiography [15].
Measurement of Human Immunodeficiency Virus-1 RNA and Soluble Markers of Inflammation
Low-level HIV-1 viral load was measured using the single-copy assay as previously described [17]. The limit of detection was standardized to the highest limit for any individual (0.9 cop-ies/mL). Four soluble markers of inflammation previously asso-ciated with coronary artery disease and HIV disease progression were measured in the plasma by enzyme-linked immunosor-bent assays: soluble CD14 (sCD14), monocyte chemoattractant protein (MCP)-1, high-sensitivity interleukin (IL)-6 (R&D Sys-tems), and sCD163 (Trillium Diagnostics). In addition, 16 ad-ditional soluble markers of inflammation were evaluated in the plasma by the Luminex xMAP assay: interferon (IFN)-γ, IFN-γ-inducible protein (IP)-10, IL-1β, IL-4, IL-5, IL-6, IL-8, IL-10, IL-12p70, IL-13, tumor necrosis factor-α, macrophage inflam-matory protein (MIP)-1α, MIP-1β, RANTES, sCD40L, and granulocyte-macrophage colony-stimulating factor (GM-CSF).
Statistical Analysis and Multivariate Analysis
The soluble markers of inflammation were compared between the HIV-1 ECs and cohorts of HIV-suppressed and HIV-uninfected controls usingk-sample rank-based tests or the Jonckheere-Terpstra test for trend. Changes in absolute CD4+T-cell count over time were calculated using a linear regression model to determine the slope. Spearman correlations were evaluated be-tween the soluble markers of inflammation in ECs with residual viremia or CD4+T-cell slope. Multiple testing was controlled using a 5% false discovery rate based on the Benjamini-Hochberg approach. Human immunodeficiency virus-1 ECs were included in the CD4+T-cell slope analysis if they had at least 3 recorded CD4+T-cell measurements in the absence of antiretroviral treat-ment. A subset of these EC participants were described in a pre-vious report of CD4+cell decline and residual viremia [17].
Partial least squares discriminant analysis (PLSDA) [18] was used to determine multivariate biomarker profiles that best dis-tinguished between EC, HIV-suppressed, and HIV-uninfected subjects. We also created a separate model to evaluate profile differences between HIV-suppressed men and women. In brief, PLSDA uses covariance to identify linear combinations of independent, or latent, variables that best differentiate be-tween the HIV cohorts. Every patient sample is assigned a score, which can be visualized in the latent variable space (score plots). Latent variable loadings (loadings plots) can then be used to identify biomarker profiles associated with dif-ferent cohort classes. High-sensitivity IL-6 measurements were excluded from PLSDA analysis due to missing measurements in several samples. Variable Importance Projection (VIP) scores can be calculated for each biomarker in the model and are a commonly used measure for feature selection. In general, vari-ables that contribute considerably to classification in the model have a VIP score >1, and variables with a VIP score <1 are good candidates to remove. To reduce the risk of overfitting, we
included only biomarkers with a VIP score >1 in all models. In-dividuals where 3 or more biomarker measurements were miss-ing were excluded; this included 1 HIV-negative individual and 1 HIV-suppressed individual. Before analysis, all data were nor-malized with mean centering and variance scaling. Both of these are commonly used methods for preprocessing data be-fore multivariate analysis. Mean centering involves subtracting the mean from each column of data. Variance scaling involves dividing each column of data by the standard deviation of that column. Both of these methods ensure that the model is not bi-ased towards variables with naturally higher raw values or var-iance than other variables. Cross-validation is commonly performed to evaluate how the models perform on unknown data. We performed cross-validation by iteratively excluding random subsets (∼10%) of data during model calibration, then we used this excluded data to test model predictions.
RESULTS
Human Immunodeficiency Virus-1 Elite Controllers Have Elevated Soluble Markers of Inflammation
We compared levels of 20 soluble markers of inflammation amongst 42 HIV-1 ECs, a previously described cohort of 80 suppressed chronically infected non-ECs, and 43 HIV-uninfected participants, all of whom were between the ages of 40–60 [15]. There were no significant differences in age between
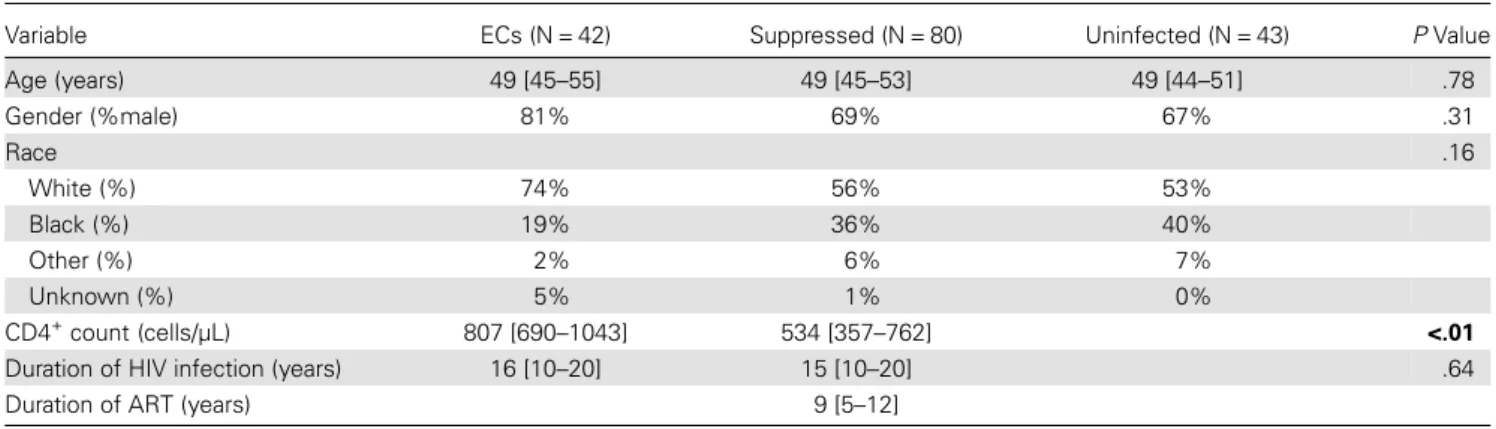
the 3 groups (median 49 years for all 3 groups,P = .78; Table1). The HIV-1 ECs had a higher proportion of male participants, but this was also not statistically significant (% male: 81% ECs vs 69% HIV-suppressed vs 67% HIV-uninfected,P = .31). There were no significant difference in the duration of HIV infection between HIV-1 ECs and suppressed individuals (P = .64), but HIV-1 ECs did have higher CD4+cell counts (Table1).
A comparison of the 20 soluble markers of inflammation showed significant differences between cohorts in 15 of the
markers (Table2). Of the soluble inflammatory markers that
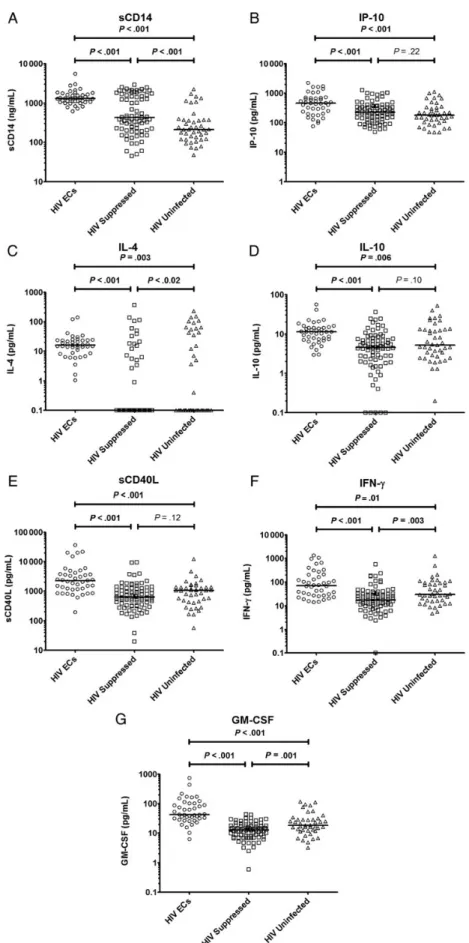
differed between groups, the HIV-1 ECs were found to have the highest levels for all of the markers, with the exception of RANTES. In particular, median levels of 7 inflammatory mark-ers (sCD14, IP-10, IL-4, IL-10, sCD40L, IFN-γ, and GM-CSF) were twice as high in the HIV-1 ECs compared with either of the HIV-suppressed or uninfected groups (Figure1). For the soluble markers sCD14 and IL-4, the median values were more than 3 times as high in HIV-1 ECs compared with either of the other groups.
Multivariate Soluble Inflammatory Markers Model Improve the Identification of Elite Controllers
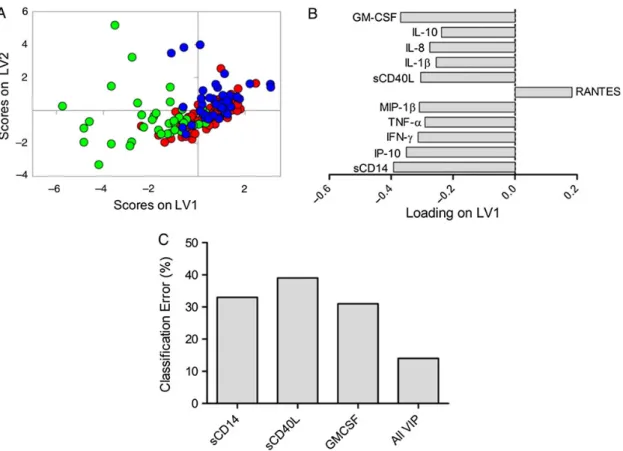
We sought to discover a multivariate biomarker profile that best distinguished between ECs, suppressed, and HIV-uninfected subjects. For this analysis, PLSDA modeling was performed using 11 of the soluble markers of inflammation that contributed best to the classification of subjects in each model (VIP score >1). With this combination of markers, the model was able to categorize ECs with 86% classification accu-racy and 85% cross-validation accuaccu-racy (Figure2A and B). The use of this multivariate inflammatory profile was more accurate for differentiating ECs than using any of the most significant soluble markers individually (Figure2C).
The EC classification accuracy of the PLSDA model was bet-ter for men than for women (85% men vs 75% women). Closer inspection revealed that this was at least partially due to eleva-tion of inflammatory markers in HIV-suppressed women, which was not observed in men. When levels of inflammatory markers were compared between HIV-suppressed men and women, sCD163 and sCD14 levels were significantly higher in women after correcting for multiple comparisons: sCD163 and sCD14 (men vs women, sCD163: 1077 vs 1596 ng/mL,P = .001; sCD14: 314 vs 1854 ng/mL,P < .001). Although sCD14 levels were 1.7 times higher in HIV-suppressed versus uninfected
Table 1. Baseline Characteristics of the HIV ECs, HIV-Suppressed, and HIV-Uninfected Patient Cohortsa
Variable ECs (N = 42) Suppressed (N = 80) Uninfected (N = 43) P Value
Age (years) 49 [45–55] 49 [45–53] 49 [44–51] .78 Gender (%male) 81% 69% 67% .31 Race .16 White (%) 74% 56% 53% Black (%) 19% 36% 40% Other (%) 2% 6% 7% Unknown (%) 5% 1% 0% CD4+count (cells/µL) 807 [690–1043] 534 [357–762] <.01
Duration of HIV infection (years) 16 [10–20] 15 [10–20] .64
Duration of ART (years) 9 [5–12]
BoldedP value represents statistical significance.
Abbreviations: ART, antiretroviral therapy; ECs, elite controllers; HIV, human immunodeficiency virus. a
men, the levels of sCD14 was 6.2 times higher in HIV-sup-pressed versus uninfected women (Supplementary Tables 1 and 2). Baseline demographics showed no significant differenc-es between HIV-supprdifferenc-essed and uninfected participants within each gender (Supplementary Table 3), but the proportion of black participants was higher in HIV-suppressed women than men (56% vs 27%;Supplementary Table 4).
To explore differences in multivariate inflammatory profiles between HIV-suppressed men and women, we generated a sepa-rate PLSDA model explicitly focused on this. We found that HIV-suppressed women had distinct multivariate inflammatory profiles and clustered separately from HIV-suppressed men, HIV-negative men, and HIV-negative women (Figure3A). The multivariate profile for HIV-suppressed women showed higher levels of CD163, sCD14, and IL-6 and lower levels of GM-CSF, IL-10, IL-13, and IL-1β (Figure3B). This profile was more
accu-rate for classifying these groups that any one of these factors alone.
Relationship Between Soluble Markers of Inflammation, Low Level Viremia, and CD4+T-cell Kinetics
CD4+cell counts were collected over a median 6.7 years in the ECs (Q1–Q3: 3.6–10.0 years). The CD4+ T-cell slope was
significantly associated with plasma residual viremia (Spearman r = −0.37, P = .02). In addition, the viral loads were stratified into the following 3 categories: <1 copy/mL, 1–10 copies/mL, and >10 copies/mL. The median (interquartile range [IQR]) viral loads for the 3 categories were as follows: <1 copy: 0.9 (IQR, 0.9–0.9) copies/mL, 1–10 copies/mL: 4.5 (IQR, 1–5) cop-ies/mL, and >10 copies/mL: 41.5 (IQR, 17–86) copies/mL. A significant trend was detected in this stratified analysis of higher viral loads associated with greater rates of CD4+T cell decline in HIV-1 ECs (Figure4).
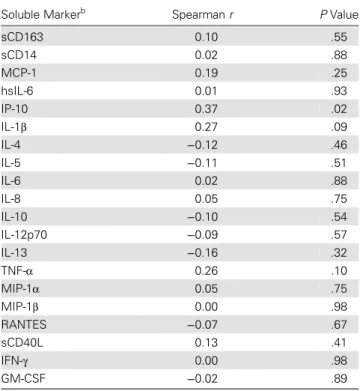
The relationship of residual viremia and CD4+T-cell slopes were also evaluated with each of the 20 soluble markers of inflammation. The only notable association was between levels of residual viremia and IP-10 levels (Table3), although statisti-cal significance did not hold after adjustment for multiple comparisons.
DISCUSSION
In the present study, we report one of the largest analysis to date of soluble markers of inflammation in HIV-1 ECs and its rela-tionship with low-level plasma viremia and CD4+T cell decline.
Table 2. Soluble Markers of Inflammation Between Participant Cohortsa
Soluble Markerb ECs Suppressed Uninfected Kruskal
–Wallis P Value sCD163 972 [835–1487] 1264 [823–1898] 862 [652–1295] .03 sCD14 1292 [1079–1649] 428 [222–1589] 213 [123–375] <.001 MCP-1 258 [216–288] 264 [196–366] 229 [190–276] .21 hsIL-6 1.1 [0.7–2.0] 1.0 [0.7–1.6] 0.9 [0.5–1.6] .48 IP-10 461 [239–689] 225 [127–354] 182 [103–330] <.001 IL-1β 5 [3–8] 2 [1–4] 5 [3–9] <.001 IL-4 16 [9–24] 0 [0–0.4] 0 [0–44] <.001 IL-5 2.1 [1.4–3.7] 0.9 [0.5–1.6] 1.5 [0.9–2.4] <.001 IL-6 5 [3–8] 6 [3–10] 7 [3–14] .25 IL-8 23 [13–36] 8 [5–13] 14 [9–26] <.001 IL-10 11 [7–14] 5 [2–7] 5 [3–13] <.001 IL-12p70 15 [9–62] 10 [6–16] 13 [9–21] .003 IL-13 9 [5–18] 4 [1–7] 8 [3–22] <.001 TNF-α 17 [13–27] 12 [8–15] 14 [10–19] <.001 MIP-1α 11 [5–18] 5 [3–8] 7 [5–10] <.001 MIP-1β 43 [26–81] 31 [21–46] 42 [27–79] .01 RANTES 1393 [876–2221] 2579 [2216–3200] 2253 [1625–3557] <.001 sCD40L 2247 [1185–3860] 629 [344–1235] 1063 [452–1386] <.001 IFN-γ 71 [27–205] 18 [11–32] 30 [16–92] <.001 GM-CSF 43 [32–102] 13 [8–18] 18 [12–29] <.001
Abbreviations: ECs, elite controllers; GM-CSF, granulocyte-macrophage colony-stimulating factor; HIV, human immunodeficiency virus; hs, high-sensitivity; IFN, interferon; IL, interleukin; IP-10, IFN-γ-inducible protein 10; MCP, monocyte chemoattractant protein; MIP, macrophage inflammatory protein; sCD163, soluble CD163; TNF, tumor necrosis factor.
a
Multiple testing was controlled using the Benjamini-Hochberg approach. AdjustedP values with a <5% false discovery rate are highlighted in bold. b
The sCD163, sCD14, MCP-1, soluble TNF-receptor I, and hsIL-6 levels were measured using enzyme-linked immunosorbent assays, and the remaining soluble markers were measured by a Luminex-based methodology. The sCD14 and sCD163 values are in ng/mL and the other markers in pg/mL.
Figure 1. Levels of soluble CD14 (sCD14) (A), interferon-γ-inducible protein (IP)-10 (B), interleukin (IL)-4 (C), IL-10 (D), sCD40L (E), interferon (IFN)-γ (F), and granulocyte-macrophage colony-stimulating factor (GM-CSF) (G) among human immunodeficiency virus (HIV)-1 elite controllers, HIV-suppressed, and HIV-uninfected controls. Abbreviation: ECs, elite controllers.
Figure 2. Partial least squares discriminant analysis (PLSDA) reveals elite controller (EC) plasma profiles of inflammatory markers are distinct from human immunodeficiency virus (HIV)-negative and HIV-suppressed profiles. (A) Partial least squares discriminant analysis identified a multivariate profile of 11 inflammatory markers that was able to classify ECs with 86% classification accuracy and 85% cross-validation accuracy (green dots, elite controllers; blue dots, HIV negative; red dots, HIV suppressed). (B) Latent variable 1 (LV1) represents the multivariate profile that differentiates EC from HIV-uninfected and HIV-suppressed, indicating that the EC profile was associated with elevation of soluble CD14 (sCD14), interferon-γ-inducible protein (IP)-10, interferon (IFN)-γ, tumor necrosis factor (TNF)-α, macrophage inflammatory protein (MIP)-1β, sCD40L, interleukin (IL)-1β, IL-8, IL-10, granulocyte-macrophage colony-stimulating factor (GM-CSF), and reduced RANTES. (C) Classification error rates of the 3 most highly predictive markers and all markers in combination. Abbreviation: VIP, variable importance projection.
Figure 3. Human immunodeficiency virus (HIV)-suppressed men and HIV-suppressed women have distinct inflammatory profiles. (A) Partial least squares discriminant analysis revealed distinct inflammatory profiles in HIV-suppressed women (red circles) compared with HIV-uninfected women (blue circles). Human immunodeficiency virus-suppressed men (red squares) and HIV-uninfected men (blue squares) clustered more closely in the multivariate space. Model performed with 89% classification accuracy and 88% cross-validation accuracy for classifying HIV-suppressed women. (B) Human immunodeficiency virus-suppressed women were associated with increased soluble CD163 (sCD163), sCD14, and interleukin (IL)-6, and decreased IL-1β, IL-10, IL-13, and granulocyte-macrophage colony-stimulating factor (GM-CSF).
Our results show that ECs have increased inflammatory markers and unique inflammatory signatures in multivariable models compared with HIV-suppressed and HIV-uninfected individu-als. Furthermore, we demonstrate that this heightened inflamma-tion could not easily be explained by HIV-1 plasma viral load and was not significantly associated with CD4+
T cell decline in this population.
There is increasing evidence that even in the absence of clini-cally sustained high-level viremia, ECs have higher levels of T-cell and monocyte/macrophage activation, can exhibit progressive CD4+T cell decline [14,17,19], and have higher subclinical ath-erosclerosis than HIV-suppressed patients [13,15]. The results of this study demonstrate that these 2 clinically relevant processes, viral replication and systemic inflammation, may be driven by distinct pathways. Human immunodeficiency virus-1 ECs were found to have significantly higher levels of several inflammatory markers, most prominently sCD14 and 4, but also IP-10, IL-10, sCD40L, IFN-γ, and GM-CSF. Soluble CD14 is marker of monocyte/macrophage activation and bacterial translocation [20,21], and levels of sCD14 have been associated with athero-sclerotic disease in both HIV-infected patients [9] and HIV-uninfected individuals [22]. Our results are also supported by previousfindings that show an elevated level of LPS and proin-flammatory CD14+
CD16+monocytes in ECs [12,14,23]. Despite the reported preservation of gut mucosal CD4+cells in ECs [24], these results are concerning for increased gut mucosal dysfunc-tion and bacterial translocadysfunc-tion in ECs. The elevated levels of IL-4
in ECs was surprising because IL-4 has been associated with a Th2-dominant T-cell activity, and HIV controllers have been found to have similar levels of IL-4-producing CD4+cells com-pared with noncontrollers on ART and to maintain an efficient Th1 cellular response to HIV [25]. Interleukin-4 has been found to both enhance [26,27] and inhibit HIV production [28,29] pending on the cell type. Interleukin-4 has been found to de-crease CCR5 expression, and promoter polymorphisms that increase IL-4 transcription has been associated with delayed dis-ease progression [30]. A number of the other elevated
inflamma-tory markers in ECs (eg, IP-10, IL-10, sCD40L, IFN-γ) have previously been associated with markers of HIV disease progres-sion in ECs [31] and noncontrollers [32–34], and can be lowered in the setting of ART [35–37]. The heightened inflammatory state
found in ECs may suggest a benefit for ART treatment, and, in fact, a small pilot study demonstrated trends in the lowering of inflammatory markers, including sCD14, in HIV controllers after initiation of ART [38]. Thesefindings should be further ex-plored in larger prospective studies.
Figure 4. CD4+cell slope by human immunodeficiency virus (HIV)-1 plasma viral load category. Median CD4+cell slope, interquartile range, and number of elite controllers in each group are listed at the bottom.
Table 3. Correlations Between HIV-1 Viral Load and Soluble Markers of Inflammation in HIV-1 ECsa
Soluble Markerb Spearmanr P Value
sCD163 0.10 .55 sCD14 0.02 .88 MCP-1 0.19 .25 hsIL-6 0.01 .93 IP-10 0.37 .02 IL-1β 0.27 .09 IL-4 −0.12 .46 IL-5 −0.11 .51 IL-6 0.02 .88 IL-8 0.05 .75 IL-10 −0.10 .54 IL-12p70 −0.09 .57 IL-13 −0.16 .32 TNF-α 0.26 .10 MIP-1α 0.05 .75 MIP-1β 0.00 .98 RANTES −0.07 .67 sCD40L 0.13 .41 IFN-γ 0.00 .98 GM-CSF −0.02 .89
Abbreviations: ECs, elite controllers; GM-CSF, granulocyte-macrophage colony-stimulating factor; HIV, human immunodeficiency virus; hs, high-sensitivity; IFN, interferon; IL, interleukin; IP-10, IFN-γ-inducible protein 10; MCP, monocyte chemoattractant protein; MIP, macrophage inflammatory protein; sCD163, soluble CD163; TNF, tumor necrosis factor.
a
Multiple testing was controlled using the Benjamini-Hochberg approach. None of the correlations were found to have a <5% false discovery rate. b
The sCD163, sCD14, MCP-1, soluble TNF-receptor I, and hsIL-6 levels were measured using ELISA, and the remaining soluble markers were measured by a Luminex-based methodology.
The multivariable PLSDA modeling revealed that the use of multivariate biomarker profiling with combinations of inflam-matory markers improved our ability to categorize participants within the cohorts. The strength of partial least squares model-ing for the analysis of inflammatory biomarkers lies in its ability to create predictive models in situations when traditional mul-tiple linear regression is inappropriate, such as in the setting of a large number of factors and/or factors that are highly collinear. Given the increasing focus on soluble markers of inflammation and the growing diversity of candidate biomarkers, such an ap-proach may represent another step in improving their clinical predictive value. In addition, the PLSDA modeling revealed a gender difference because the inflammatory profile for female HIV-suppressed participants tended to be different than female HIV-uninfected participants, whereas male HIV-suppressed participants had similar biomarker profiles compared with male HIV-uninfected participants. The most prominent inflam-matory marker differences in HIV-suppressed women were the significantly higher levels of sCD14 and sCD163, although this analysis was confounded by the fact that the proportion of black participants was much higher for HIV-suppressed women compared with men. These intriguing findings (1) potentially support reports of gender- and race-specific differences in in-flammation [39–41] and coronary artery disease in HIV-infected individuals [42,43] and (2) highlight the need for additional studies on this issue.
Although HIV controllers maintain persistent low levels of HIV viral load, they are at risk of progressive CD4+cell decline [44]. Whereas an actively engaged adaptive immune system contributes to virologic control, it does not completely suppress viral replication. CD4+cell decline in ECs was significantly as-sociated with levels of residual viremia [17], which is consistent with prior reports that viral load “blips” may contribute to CD4+cell loss in HIV controllers [45]. In this population, the etiology of CD4+T cell decline may be multifactorial because T-cell activation has also been found to be associated with lower CD4+cell counts [12]. It is interesting to note that al-though initiation of ART in HIV controllers has resulted in di-minished HIV reservoir size [46], lower levels of residual viremia, and T-cell activation [38], it is only associated with a modest or no increase in CD4+cell counts [38,47]. The etiology behind this blunted CD4+cell response to ART remains un-clear. We did notfind significant associations between the solu-ble markers of inflammation and either levels of residual viremia or CD4+cell decline. The lack of an association between certain inflammatory markers and HIV viral load in ECs have been described previously [31] and suggests that persistent viral replication may not be the primary driver behind the in flamma-tion seen in ECs.
There are a few notable limitations to this study. Due to sam-ple limitations, evaluations of low-level viral load were not per-formed in the HIV-suppressed cohort, and the relationship
between plasma viral and the soluble markers of inflammation were only evaluated in the ECs. Although we found no signi fi-cant correlation between soluble markers of inflammation and viral load, this was a largely cross-sectional retrospective study, and the potential contribution of long-standing low-level repli-cation cannot be ruled out. Larger longitudinal interventional studies are needed in ECs, given a previous report suggesting possible declines in soluble inflammatory markers after ART initiation [38]. It is possible that ART treatment can at least par-tially restore immune reconstitution of gut-associated lymphoid tissue and lymphatic tissue architecture [48], leading to eventual decreases in soluble inflammatory markers, especially from monocyte/macrophage activation. Although we did not detect significant associations between soluble markers of inflamma-tion and CD4+T-cell slope, CD4+cell slopes have large coeffi-cients of variation [49], and a larger sample size may be needed to fully explore these relationships.
CONCLUSIONS
Historically, HIV-1 ECs were thought to be a privileged popu-lation at relatively little risk of HIV progression and clinical dis-ease. However, it is now clear that ECs have higher levels of chronic inflammation than non-ECs on ART and are at in-creased risk for HIV disease progression and non-AIDS events. Our results show that ECs had a number of elevated levels of markers inflammation that were not associated with plasma viral load. In addition, the clinical predictive value of individual soluble markers of inflammation may improve with multivari-ate biomarker profile modeling. In ECs, viral load was associat-ed with CD4+T cell decline, but not inflammatory marker levels. Thus, a multifaceted interventional approach may be needed to optimally reduce the heightened inflammatory profile of these individuals. A prospective treatment study sponsored by the AIDS Clinical Trials Group (ACTG A5308) to evaluate the impact of ART in ECs is currently underway.
Supplementary Data
Supplementary materialis available online atOpen Forum Infectious Diseases (http://OpenForumInfectiousDiseases.oxfordjournals.org/).
Acknowledgments
We thank the patients for participation.
Financial support. This study was supported in part by The Interna-tional HIV Controllers Study, funded by the Bill and Melinda Gates Foun-dation, the AIDS Healthcare FounFoun-dation, and the Harvard University Center for AIDS Research (CFAR), a National Institutes of Health (NIH)-funded program (NIH P30 AI060354), which is supported by the following NIH Co-Funding and Participating Institutes and Centers: National Insti-tute of Allergy and Infectious Diseases, National Cancer InstiInsti-tute, Eunice Kennedy Shriver National Institute of Child Health and Human Develop-ment, National Heart, Lung, and Blood Institute, National Institute on Drug Abuse, National Institute of Mental Health, National Institute on Aging,
Fogarty International Center, and Office of AIDS Research (to F. P.); a Ragon Institute postdoctoral fellowship (to K. B. A.); NIH U19-AI0859 (to D. A. L.); Chicago DCFAR P30 AI082151-04 and subcontract U01 AI 068636 to the Rush Immunology Support Laboratory (to A. L.); and a sub-contract from NIH U01 AI068636 to the Harvard Virology Support Labo-ratory (to D. R. K.).
Potential conflicts of interest. S. G. reports consulting for Navidea, Theratechnologies, AstraZeneca, Novo Nordisk, and receiving research grants from Theratechnologies, Gilead, Amgen, and KOWA Pharmaceuti-cals. All authors have submitted the ICMJE Form for Disclosure of Potential Conflicts of Interest. Conflicts that the editors consider relevant to the con-tent of the manuscript have been disclosed.
References
1. Nakagawa F, Lodwick RK, Smith CJ, et al. Projected life expectancy of people with HIV according to timing of diagnosis. AIDS2012; 26: 335–43.
2. Hogg R, Lima V, Sterne J, et al. Life expectancy of individuals on com-bination antiretroviral therapy in high-income countries: a collaborative analysis of 14 cohort studies. Lancet2008; 372:293–9.
3. Masia M, Padilla S, Alvarez D, et al. Risk, predictors, and mortality as-sociated with non-AIDS events in newly diagnosed HIV-infected pa-tients: role of antiretroviral therapy. AIDS2013; 27:181–9.
4. Neuhaus J, Angus B, Kowalska JD, et al. Risk of all-cause mortality as-sociated with nonfatal AIDS and serious non-AIDS events among adults infected with HIV. AIDS2010; 24:697–706.
5. Freiberg MS, Chang CC, Kuller LH, et al. HIV infection and the risk of acute myocardial infarction. JAMA Intern Med2013; 0:1–9. 6. Crowell TA, Gebo KA, Blankson JN, et al. HIV elite controllers are
hospitalized more often than persons with medically controlled HIV. In: Conference on Retroviruses and Opportunistic Infections; March 3–6, 2014 (Abstract 556); Boston, MA.
7. Subramanian S, Tawakol A, Burdo TH, et al. Arterial inflammation in patients with HIV. JAMA2012; 308:379–86.
8. Burdo TH, Lo J, Abbara S, et al. Soluble CD163, a novel marker of ac-tivated macrophages, is elevated and associated with noncalcified coro-nary plaque in HIV-infected patients. J Infect Dis2011; 204:1227–36. 9. Kelesidis T, Kendall MA, Yang OO, et al. Biomarkers of microbial trans-location and macrophage activation: association with progression of sub-clinical atherosclerosis in HIV-1 infection. J Infect Dis2012; 206:1558–67. 10. Tenorio A, Zheng E, Bosch RJ, et al. Soluble markers of inflammation and coagulation, but not T cell activation, predict non-AIDS-defining events during suppressive ART. In: 20th Conference on Retroviruses and Opportunistic Infections; March 3–Mar 6, 2012 (Abstract 790); Atlanta, GA.
11. Betts MR, Nason MC, West SM, et al. HIV nonprogressors preferen-tially maintain highly functional HIV-specific CD8+ T cells. Blood 2006; 107:4781–9.
12. Hunt PW, Brenchley J, Sinclair E, et al. Relationship between T cell ac-tivation and CD4+ T cell count in HIV-seropositive individuals with undetectable plasma HIV RNA levels in the absence of therapy. J Infect Dis2008; 197:126–33.
13. Hsue PY, Hunt PW, Schnell A, et al. Role of viral replication, antiretro-viral therapy, and immunodeficiency in HIV-associated atherosclerosis. AIDS2009; 23:1059–67.
14. Krishnan S, Wilson EM, Sheikh V, et al. Evidence for innate immune system activation in HIV type 1-infected elite controllers. J Infect Dis 2014; 209:931–9.
15. Pereyra F, Lo J, Triant VA, et al. Increased coronary atherosclerosis and immune activation in HIV-1 elite controllers. AIDS2012; 26:2409–12. 16. Pereyra F, Jia X, McLaren PJ, et al. The major genetic determinants of HIV-1 control affect HLA class I peptide presentation. Science2010; 330:1551–7.
17. Pereyra F, Palmer S, Miura T, et al. Persistent low-level viremia in HIV-1 elite controllers and relationship to immunologic parameters. J Infect Dis2009; 200:984–90.
18. Lau KS, Juchheim AM, Cavaliere KR, et al. In vivo systems analysis iden-tifies spatial and temporal aspects of the modulation of TNF-alpha-induced apoptosis and proliferation by MAPKs. Sci Signal2011; 4:ra16. 19. Okulicz JF, Marconi VC, Landrum ML, et al. Clinical outcomes of elite controllers, viremic controllers, and long-term nonprogressors in the US Department of Defense HIV natural history study. J Infect Dis 2009; 200:1714–23.
20. Fabriek BO, Dijkstra CD, van den Berg TK. The macrophage scavenger receptor CD163. Immunobiology2005; 210:153–60.
21. Hiki N, Berger D, Prigl C, et al. Endotoxin binding and elimination by monocytes: secretion of soluble CD14 represents an inducible mecha-nism counteracting reduced expression of membrane CD14 in patients with sepsis and in a patient with paroxysmal nocturnal hemoglobinuria. Infect Immun1998; 66:1135–41.
22. Morange PE, Tiret L, Saut N, et al. TLR4/Asp299Gly, CD14/C-260 T, plasma levels of the soluble receptor CD14 and the risk of coronary heart disease: The PRIME Study. Eur J Hum Genet2004; 12:1041–9. 23. Spivak AM, Salgado M, Rabi SA, et al. Circulating monocytes are not a
major reservoir of HIV-1 in elite suppressors. J Virol2011; 85:10399–403. 24. Ferre AL, Hunt PW, Critchfield JW, et al. Mucosal immune responses to HIV-1 in elite controllers: a potential correlate of immune control. Blood2009; 113:3978–89.
25. Vingert B, Benati D, Lambotte O, et al. HIV controllers maintain a pop-ulation of highly efficient Th1 effector cells in contrast to patients treat-ed in the long term. J Virol2012; 86:10661–74.
26. Wang J, Harada A, Matsushita S, et al. IL-4 and a glucocorticoid up-regulate CXCR4 expression on human CD4+ T lymphocytes and enhance HIV-1 replication. J Leukoc Biol1998; 64:642–9.
27. Mikovits JA, Meyers AM, Ortaldo JR, et al. IL-4 and IL-13 have over-lapping but distinct effects on HIV production in monocytes. J Leukoc Biol1994; 56:340–6.
28. Naif HM, Li S, Ho-Shon M, et al. The state of maturation of monocytes into macrophages determines the effects of IL-4 and IL-13 on HIV rep-lication. J Immunol1997; 158:501–11.
29. Gauthier S, Tremblay MJ. Interleukin-4 inhibits an early phase in the HIV-1 life cycle in the human colorectal cell line HT-29. Clin Immunol 2010; 135:146–55.
30. Nakayama EE, Meyer L, Iwamoto A, et al. Protective effect of interleu-kin-4 -589 T polymorphism on human immunodeficiency virus type 1 disease progression: relationship with virus load. J Infect Dis2002; 185:1183–6.
31. Noel N, Boufassa F, Lecuroux C, et al. Elevated IP10 levels are associated with immune activation and low CD4(+) T-cell counts in HIV control-ler patients. AIDS2014; 28:467–76.
32. Keating SM, Golub ET, Nowicki M, et al. The effect of HIV infection and HAART on inflammatory biomarkers in a population-based cohort of women. AIDS2011; 25:1823–32.
33. Cozzi-Lepri A, French MA, Baxter J, et al. Resumption of HIV replica-tion is associated with monocyte/macrophage derived cytokine and che-mokine changes: results from a large international clinical trial. AIDS 2011; 25:1207–17.
34. Leeansyah E, Malone DF, Anthony DD, et al. Soluble biomarkers of HIV transmission, disease progression and comorbidities. Curr Opin HIV AIDS2013; 8:117–24.
35. Jenabian MA, Patel M, Kema I, et al. Soluble CD40-ligand (sCD40L, sCD154) plays an immunosuppressive role via regulatory T-cell expan-sion in HIV infection. Clin Exp Immunol2014; 178:102–11. 36. Stylianou E, Aukrust P, Bendtzen K, et al. Interferons and interferon
(IFN)-inducible protein 10 during highly active anti-retroviral therapy (HAART)-possible immunosuppressive role of IFN-alpha in HIV infec-tion. Clin Exp Immunol2000; 119:479–85.
37. Watanabe D, Uehira T, Yonemoto H, et al. Sustained high levels of serum interferon-gamma during HIV-1 infection: a specific trend different from other cytokines. Viral Immunol2010; 23:619–25. 38. Hatano H, Yukl SA, Ferre AL, et al. Prospective antiretroviral treatment
of asymptomatic, HIV-1 infected controllers. PLoS Pathog2013; 9: e1003691.
39. Chang JJ, Woods M, Lindsay RJ, et al. Higher expression of several in-terferon-stimulated genes in HIV-1-infected females after adjusting for the level of viral replication. J Infect Dis2013; 208:830–8.
40. Meier A, Chang JJ, Chan ES, et al. Sex differences in the Toll-like recep-tor-mediated response of plasmacytoid dendritic cells to HIV-1. Nat Med2009; 15:955–9.
41. Borges AH, O’Connor JL, Phillips AN, et al. Factors associated with D-dimer levels in HIV-infected individuals. PLoS One2014; 9:e90978. 42. Triant VA, Lee H, Hadigan C, et al. Increased acute myocardial
infarc-tion rates and cardiovascular risk factors among patients with human immunodeficiency virus disease. J Clin Endocrinol Metab 2007; 92: 2506–12.
43. Fitch KV, Srinivasa S, Abbara S, et al. Atherosclerotic plaque and im-mune activation in HIV-infected women. J Infect Dis2015. (In Press). 44. Groves KC, Bibby DF, Clark DA, et al. Disease progression in HIV-1-infected viremic controllers. J Acquir Immune Defic Syndr 2012; 61:407–16.
45. Boufassa F, Saez-Cirion A, Lechenadec J, et al. CD4 dynamics over a 15 year-period among HIV controllers enrolled in the ANRS French obser-vatory. PLoS One2011; 6:e18726.
46. Chun TW, Shawn Justement J, Murray D, et al. Effect of antiretroviral therapy on HIV reservoirs in elite controllers. J Infect Dis2013; 208: 1443–7.
47. Boufassa F, Lechenadec J, Meyer L, et al. Blunted response to combina-tion antiretroviral therapy in HIV elite controllers: an internacombina-tional HIV controller collaboration. PLoS One2014; 9:e85516.
48. Asmuth DM, Ma ZM, Mann S, et al. Gastrointestinal-associated lym-phoid tissue immune reconstitution in a randomized clinical trial of ral-tegravir versus non-nucleoside reverse transcriptase inhibitor-based regimens. AIDS2012; 26:1625–34.
49. Mellors JW, Margolick JB, Phair JP, et al. Prognostic value of HIV-1 RNA, CD4 cell count, and CD4 cell count slope for progression to AIDS and death in untreated HIV-1 infection. JAMA 2007; 297: 2349–50.