Electronic Supplementary Materials
2
This file contains additional Information on Methods and Results: 1- Tracking data
4
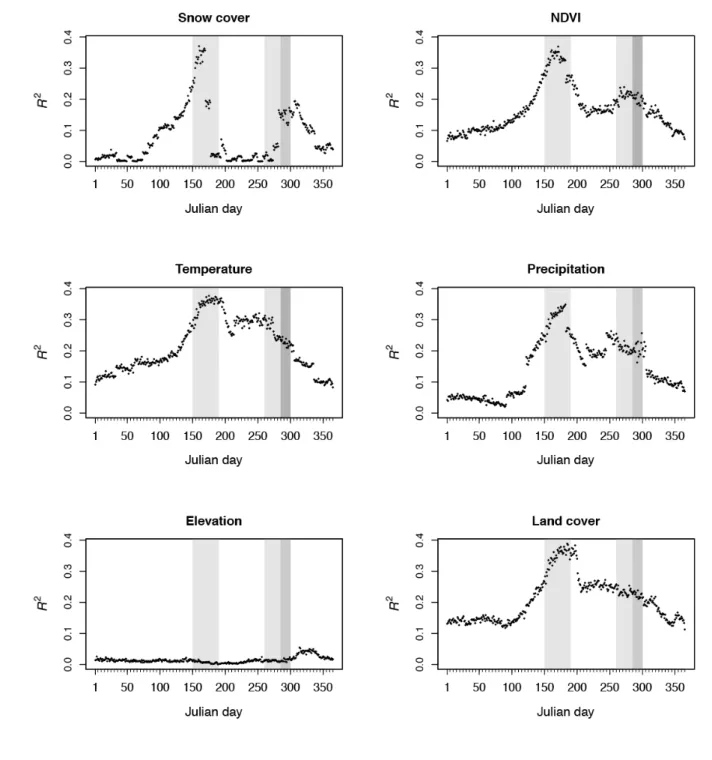
2- Detailed description of the variables used to estimate habitat suitability models (table S1). 3- The relative contribution of the assessed environmental variables to the daily habitat
6
suitable models (figure S1).
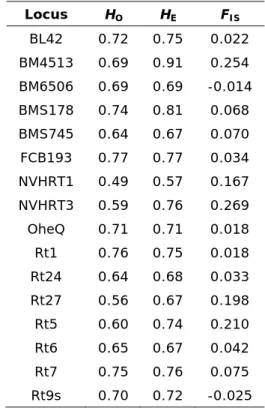
4- Information on microsatellite loci used for caribou and diversity statistics (table S2).
8
5- Correlation among predictive distances (figure S2). 6- Landscape genetic method validation (figures S3 & S4).
10
7- Causal modelling (table S3 and figure S5).
8- Landscape genetic results validation (figures S6 & S7).
12
9- Additional references.
14
1-Tracking data
16
To fit the models, we used the locations of 296 caribou (53 males and 243 females) of the George herd between 1986 and 2012 and 233 caribou (71 males and 162 females) of the
Rivière-18
aux-Feuilles herd between 1991 and 2012 fitted with ARGOS satellite-tracking collars (Telonics, ARGOS platform, Mesa, Arizona, USA) (Table 1). Most females were captured on the calving
20
grounds at sites separated by several kilometres (e.g., range for 2007 to 2009 (mean (SE)): Rivière-George: 21 (3) km; Rivière-aux-Feuilles: 83 (12) km), therefore we considered individuals
22
to be independent because capture sites within a given year were spread over several thousands of km2 and representative of the area used by the entire herd. Males were mainly captured on winter
24
areas. All captures used a net-gun fired from a helicopter and physical contention, a standard procedure for ungulates [1]. Anaesthetics were never used during captures, which followed
26
guidelines from the Canadian Council on animal Care. On average, we followed 44 females (SE ± 5) each year and females were monitored on average for 2.0 years (SE ± 0.1) with some
28
individuals followed for up to 10 years. Locations were usually collected every 5 days (65.7% of the database) but frequency ranged from one location every day (1.3%) up to one per 7 days (0.9%).
30
We filtered the data using a similar algorithm as Austin et al. [2] to eliminate aberrant locations: we selected the most accurate location for a given transmission period based on signal quality and
32
we excluded locations leading to movements higher than 50 kilometres per day [3].
34
2- Detailed description of the variables used to estimate habitat suitability models
36
Table S1. Description of the variables used to estimate habitat suitability models for caribou in
Quebec and Labrador.
38
Variable Description
Elevation Elevation determined from a global digital elevation model (DEM) Snow Surface covered by snow [500m]; available every 8 days 1
NDVI Normalized difference vegetation index (1km); available every 10 days 2
Precipitation Average monthly precipitation (mm) [1km] 3
Temperature Average monthly maximum temperature (°C * 10) [1km] 3
Open area Disturbed areas (Burnt area, urban or built-up) [400m] 4
Water Water bodies (rivers and lakes) [400m] 4
Lichen Subpolar needleleaved evergreen forest open canopy - lichen understory [400m] 4
Grassland Temperate, subpolar or polar grassland, with sparse shrub or tree layers [400m] 4
Shrubland Temperate or subpolar shrubland (Broadleaved evergreen, broadleaved deciduous and/or needleleaved evergreen shrublands) [400m] 4
Closed Forest Temperate or subpolar closed forest (Broadleaved evergreen, broadleaved deciduous and/or needleleaved evergreen closed forests) [400m] 4
Open Forest Temperate or subpolar open forest (Broadleaved evergreen, broadleaved deciduous and/or needleleaved evergreen open forests) [400m] 4 Note: Distances in brackets denote the initial resolution at which the variable was acquired
40
1 MODIS satellite images [National Snow and Ice Data Center, Boulder, Colorado; http://nsidc.org/; 4]. 2 NDVI data acquired by the National Oceanic and Atmospheric Administration Advanced Very High Resolution
42
Radiometer (NOAA-AVHRR) satellite series [5] and processed by the Canada Centre for Remote Sensing (CCRS, Department of Natural Resources Canada, Ottawa, Ont.)
44
3 WorldClim Version 1.4 [6]
4 Determined from landcover layer [GlobeCover 2009 [Global Land Cover Map]; 7]
46
3-
The relative contribution of the assessed environmental variables to the daily48
habitat suitable models
50
Figure S1. The relative contribution of the assessed environmental variables to the daily habitat
52
suitability models. Grey boxes delimit the calving period (Julian days 155-190) and the rutting period (Julian days 260-300) for forest-dwelling caribou [8] and migratory caribou [3]. Dark-grey
54
boxes show the rutting peak for migratory caribou [Julian days 285-300; 3].
56
4-
Information on microsatellite loci used for caribou and diversity statistics
58
Table S2. Information on microsatellite loci used for caribou and diversity statistics. Observed
heterozygosity (HO), expected heterozygosity (HE), and Weir & Cockerham's inbreeding coefficient
60
(FIS) are reported. Locus HO HE FIS BL42 0.72 0.75 0.022 BM4513 0.69 0.91 0.254 BM6506 0.69 0.69 -0.014 BMS178 0.74 0.81 0.068 BMS745 0.64 0.67 0.070 FCB193 0.77 0.77 0.034 NVHRT1 0.49 0.57 0.167 NVHRT3 0.59 0.76 0.269 OheQ 0.71 0.71 0.018 Rt1 0.76 0.75 0.018 Rt24 0.64 0.68 0.033 Rt27 0.56 0.67 0.198 Rt5 0.60 0.74 0.210 Rt6 0.65 0.67 0.042 Rt7 0.75 0.76 0.075 Rt9s 0.70 0.72 -0.02562
5- Correlation among predictive distances
64
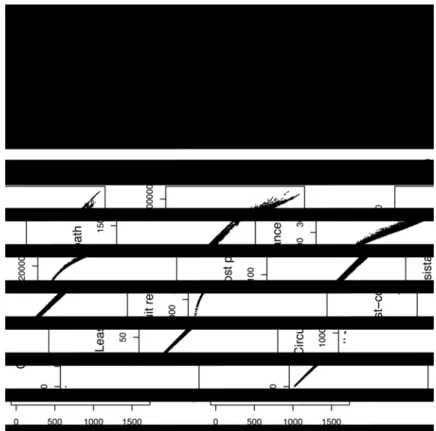
Figure S2. Relationship among the three different predictive distances, i.e., Geodesic distances (in
66
km), Least-cost path and circuit resistance estimated among caribou pairs for the Julian Day 300. The upper right inset shows the Pearson’s correlation coefficient among pair of distances.
68
6- Landscape genetic method validation
72
Figure S3. Landscape genetic method validation. Map of sample locations of caribou, showing
migratory caribou for which we had both genetic and tracking information and used for method
74
validation (see Methods). Grey squares: Rivières-aux-Feuilles migratory herd; grey dots: Rivière-George migratory herd; black squares: forest-dwelling caribou; black triangles: mountain caribou.
76
The annual ranges of migratory herd are delineated by dotted and dashed contour lines for Rivières-aux-Feuilles and Rivière-George herds, respectively.
80
82
Figure S4. Landscape genetic method validation. Temporal changes in correlation coefficient
(Mantel’s r) of genetic relatedness (Lynch and Ritland [9] relationship coefficient) against Geodesic
84
geographic distance (IBD); least-cost path; and circuit resistance, for which we had both genetic and location information for migratory caribou (see Methods). Pearson’s correlation coefficient
86
between the daily Mantel’s r correlations obtained for the models based on the whole dataset and the data subset is indicated. Grey boxes delimit the calving period (Julian days 155-190) and the
88
rut period (Julian days 260-300) for forest-dwelling caribou [8] and migratory caribou [3]. Dark-grey boxes show the rutting peak for migratory caribou (Julian days 285-300; [3]).
7-
Causal modelling
92
Causal modelling analyses based on partial Mantel tests showed that all variables explained a significant part of genetic relatedness among individuals (table S3). The respective influences of
94
barriers and distance, however, significantly changed over time. While after controlling for distance (Isolation-by-Distance; IBD) and barriers (Isolation by Barrier; IBB), the circuit resistance models
96
always showed a significant negative relationship to relatedness (table S3), the effect of distance and barrier on genetic relatedness either switched from negative to positive (i.e., r > 0) when the
98
circuit resistance model was controlled for, or was non-significant in 34% and 16% of the IBD and IBB models, respectively (table S3 and figure S3). In particular, IBD and IBB models were not
100
significant during the calving and rut periods, once circuit resistance models were controlled for.
102
Table S3. Partial Mantel tests used in the causal modelling framework to assess the degree of
association between each genetic distance matrix and four cost distance matrices, representing the
104
two null models (Isolation by Distance, Isolation by Barrier), and the two correct landscape resistance models. The expected outcomes are for the situation where the landscape resistance
106
model is a true driver of the observed genetic differentiation.
Variable
Test number Dependent Independent Covariates Expected Outcome Results* mean ± sd Mantel'r
#1 Genetic Circuit IBD Significant 100.00 -0.18 ± 0.02 #2 Genetic IBD Circuit Not significant 100.00 0.09 ± 0.02 #3 Genetic Circuit IBD IBB Significant 100.00 -0.18 ± 0.02 4 Genetic IBD Circuit IBB Not significant 84.4 -0.09 ± 0.02
108
• Percentage of significant tests out of 365 Mantel tests.
110
112
Figure S5. The relative Mantel’ r coefficients estimated by partial Mantel tests from the correlation
of genetic versus geographic distances between pairs of caribou, once alternative distances were
114
controlled for (indicated by | ). Geodesic distance (IBD), Circuit theory resistance distance (Circuit) and geographic Barrier (IBB), respectively. The solid line in each box shows the median of the
116
Mantel’ r coefficients distribution, the box shows the 25% and 75% quantiles, and the whiskers show the full range of the coefficients.
8- Landscape genetic models validation
120
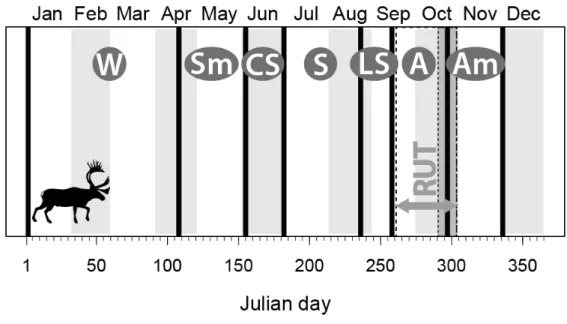
Figure S6. Landscape genetic method validation. Schematic representation of the biological
122
seasons for migratory caribou in Québec/Labrador. The vertical black lines indicate the seasonal periods independently defined on the base on the rate of travel (First Passage Time analysis; M. Le
124
Corre, C. Dussault and S.D. Côté, unpublished data). Legends: W winter, Sm spring migration, CS calving season, LS late summer, A autumn, Am autumn migration. The dashed-lines delimited the
126
overlapping rut period for boreal forest caribou [8] and migratory caribou [3]. Dark-grey box shows the rutting peak for migratory caribou [3].
130
Figure S7. Landscape genetic models validation. Temporal changes in correlation coefficient
132
(Mantel’s r) of genetic relatedness (Lynch and Ritland [9] relationship coefficient) against Geodesic geographic distance (IBD); least-cost path; and circuit resistance, obtained using a repeated split
134
sampling approach in which models were calibrated over 70% of the data (n[total]=336, n[female]=281 and n[male]=55; black line=average over 10 replicates) and evaluated over the
136
remaining 30% (n[total]=144, n[female]=129 and n[male]=15; red line=average over 10 replicates). Grey boxes delimit the calving period (Julian days 155-190) and the rut period (Julian
138
days 260-300) for forest-dwelling caribou [8] and migratory caribou [3]. Dark-grey boxes show the rutting peak for migratory caribou (Julian days 285-300; [3])
140
Table S4. Repeated split sampling testing the effect of the distances (i.e., geodesic distance, least
cost-path or circuit connectivity) and the seasons (see figure S6) on the Mantel’s r coefficients. rho
144
corresponds to Spearman correlation coefficient between values predicted by the training data set and values observed in the testing data set, average ± se over 10 repeats obtained using a
146
repeated split sampling approach in which models were calibrated over 70% of the data (n[total]=336, n[female]=281 and n[male]=55) and evaluated over the remaining 30%
148
(n[total]=144, n[female]=129 and n[male]=15); and R2 the proportion of variance explained by the training models.
150
Whole data Male Female
Model rho R2 rho R2 rho R2
#1 ~Distance + Season 0.95±0.01 0.92 0.53±0.09 0.83 0.94±0.02 0.92
#2 ~Distance 0.70±0.01 0.63 0.52±0.05 0.63 0.69±0.04 0.63
#3 ~Season 0.48±0.02 0.29 0.16±0.06 0.19 0.48±0.05 0.29
9- References
154
[1] Bookhout, T.A. 1996 Research and management techniques for wildlife and habitats. Maryland.
156
USA, The Wildlife Society.
[2] Austin, D., McMillan, J.I. & Bowen, W.D. 2003 A three-stage algorithm for filtering erroneous
158
Argos satellite locations. Mar. Mamm. Sci. 19, 371-383.
[3] Boulet, M., Couturier, S., Côté, S.D., Otto, R.D. & Bernatchez, L. 2007 Integrative use of
160
spatial, genetic, and demographic analyses for investigating genetic connectivity between
migratory, montane, and sedentary caribou herds. Mol. Ecol. 16, 4223-4240.
(doi:10.1111/j.1365-162
294X.2007.03476.x).
[4] Armstrong, R.L. & Brodzik, M.J. 2005 Northern Hemisphere EASE-Grid Weekly Snow Cover and
164
Sea Ice Extent Version 3. (Boulder, Colorado USA, National Snow and Ice Data Center.
[5] Tucker, C.J., Pinzon, J.E., Brown, M.E., Slayback, D.A., Mahoney, R., Vermote, E.F. & Saleous,
166
N.E. 2005 An extended AVHRR 8-km NDVI dataset compatible with MODIS and SPOT vegetation NDVI data. International Journal Remote Sensing 26, 4485-4498.
168
[6] Hijmans, R.J., Cameron, S.E., Parra, J.L., Jones, P.G. & Jarvis, A. 2005 Very high resolution interpolated climate surfaces for global land areas. International Journal of Climatology 25,
1965-170
1978.
[7] Arino, O., Ramos, P., Jose, J., Kalogirou, V., Bontemps, S., Defourny, P. & Van Bogaert, E.
172
2012 Global Land Cover Map for 2009 (GlobCover 2009). (European Space Agency (ESA) & Université catholique de Louvain (UCL).
174
[8] Lesmerises, R., Ouellet, J.-P., Dussault, C. & St-Laurent, M.-H. 2013 The influence of landscape matrix on isolated patch use by wide-ranging animals: conservation lessons for woodland caribou.
176
Ecology and Evolution.
[9] Lynch, M. & Ritland, K. 1999 Estimation of pairwise relatedness with molecular markers.
178
Genetics 152, 1753-1766.


![Figure S4. Landscape genetic method validation. Temporal changes in correlation coefficient (Mantel’s r) of genetic relatedness (Lynch and Ritland [9] relationship coefficient) against Geodesic](https://thumb-eu.123doks.com/thumbv2/123doknet/15018705.682345/8.892.131.772.146.427/landscape-validation-temporal-correlation-coefficient-relatedness-relationship-coefficient.webp)


