HAL Id: hal-00298357
https://hal.archives-ouvertes.fr/hal-00298357
Submitted on 5 Mar 2008
HAL is a multi-disciplinary open access
archive for the deposit and dissemination of
sci-entific research documents, whether they are
pub-lished or not. The documents may come from
teaching and research institutions in France or
abroad, or from public or private research centers.
L’archive ouverte pluridisciplinaire HAL, est
destinée au dépôt et à la diffusion de documents
scientifiques de niveau recherche, publiés ou non,
émanant des établissements d’enseignement et de
recherche français ou étrangers, des laboratoires
publics ou privés.
Antarctica from oxygen isotope ratio measurements
M. R. Price, K. J. Heywood, K. W. Nicholls
To cite this version:
M. R. Price, K. J. Heywood, K. W. Nicholls. Ice-shelf ? ocean interactions at Fimbul Ice Shelf,
Antarctica from oxygen isotope ratio measurements. Ocean Science, European Geosciences Union,
2008, 4 (1), pp.89-98. �hal-00298357�
Ocean Sci., 4, 89–98, 2008 www.ocean-sci.net/4/89/2008/
© Author(s) 2008. This work is distributed under the Creative Commons Attribution 3.0 License.
Ocean Science
Ice-shelf – ocean interactions at Fimbul Ice Shelf, Antarctica from
oxygen isotope ratio measurements
M. R. Price1, K. J. Heywood1, and K. W. Nicholls2
1School of Environmental Sciences, University of East Anglia, Norwich, NR4 7TJ, UK
2British Antarctic Survey, High Cross, Madingley Road, Cambridge, CB3 0ET, UK
Received: 3 September 2007 – Published in Ocean Sci. Discuss.: 18 September 2007 Revised: 7 January 2008 – Accepted: 4 February 2008 – Published: 5 March 2008
Abstract. Melt water from the floating ice shelves at the
margins of the southeastern Weddell Sea makes a signifi-cant contribution to the fresh water budget of the region. In February 2005 a multi-institution team conducted an oceano-graphic campaign at Fimbul Ice Shelf on the Greenwich Meridian as part of the Autosub Under Ice programme. This included a mission of the autonomous submarine Autosub 25 km into the cavity beneath Fimbul Ice Shelf, and a num-ber of ship-based hydrographic sections on the continental shelf and adjacent to the ice shelf front. The measurements reveal two significant sources of glacial melt water at Fim-bul Ice Shelf: the main cavity under the ice shelf and an ice tongue, Trolltunga, that protrudes from the main ice front and out over the continental slope into deep water. Glacial melt water is concentrated in a 200 m thick Ice Shelf Water (ISW) layer below the base of the ice shelf at 150–200 m, with a maximum glacial melt concentration of up to 1.16%. Some glacial melt is found throughout the water column, and much of this is from sources other than Fimbul Ice Shelf. However, at least 0.2% of the water in the ISW layer can-not be accounted for by other processes and must have been contributed by the ice shelf. Just downstream of Fimbul Ice Shelf we observe locally created ISW mixing out across the continental slope. The ISW formed here is much less dense than that formed in the southwest Weddell Sea, and will
ul-timately contribute a freshening (and reduction in δ18O) to
the upper 100–150 m of the water column in the southeast Weddell Sea.
Correspondence to: K. J. Heywood
(k.heywood@uea.ac.uk)
1 Introduction
Floating ice shelves at the periphery of Antarctica play an important role in the water mass transformations that take place there. The source water is Warm Deep Water (WDW), derived from Circumpolar Deep Water, an old, salty and rel-atively warm water mass. Around Antarctica a portion of this is ultimately transformed into Antarctic Bottom Water, a cooler and fresher water mass. The processes that effect this transformation are many, complex and not yet fully under-stood, involving interaction with the atmosphere, formation and melting of sea ice, and interaction with floating glacial ice shelves. Of the ice shelves in the Weddell Sea, most at-tention has been directed at the Filchner-Ronne Ice Shelf in the southwest Weddell Sea (Foldvik et al., 2004). Here the wide continental shelf provides a source of cold and saline High Salinity Shelf Water for the extensive under-ice cavity, where it is transformed into Ice Shelf Water (ISW). The ISW forms an important component of the subsequent water mass mixture that is dense enough to descend the continental slope into the deep layers of the Weddell Sea.
The ice shelves further east, the Brunt, Riiser-Larsen and Fimbul, for example, have much narrower continental shelves, which produce fresher and less dense shelf waters, and are not believed to be locations for formation of Antarc-tic Bottom Water. The meltwater from the ice shelves mixes into the near-surface layers of the southeast Weddell Sea. In-deed, Fahrbach et al. (1994) argued that the input of glacial melt water from these ice shelves plays an important role in suppressing bottom water formation in the southeast Weddell Sea. In a numerical model of the Weddell Sea (Beckmann et al., 1999), the eastern Weddell ice shelves provide a fresh water source that caps deep convection in the open Weddell Sea. Toggweiler and Samuels (1995) argue that global ocean models tend to be fundamentally deficient in the Antarctic because they neglect the contribution of ice shelves to the freshwater budget of the high latitude oceans.
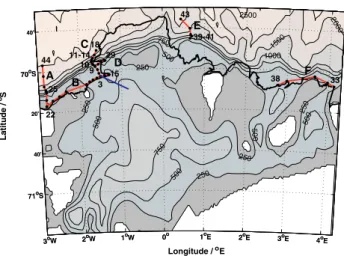
Longitude / oE Latitude / oS 3oW 2oW 1oW 0o 1oE 2o E 3o E 4o E 71oS 40’ 20’ 70oS 40’ 250 250 500 500 250 2000 750 500 500 250 250 1500 1000 750 500 2500 3oW 2oW 1oW 0o 1oE 2o E 3o E 4o E 71oS 40’ 20’ 70oS 40’ A B C D E F 44 25 22 3 15 9 29 10 11-14 18 39-41 43 38 33
Fig. 1. Hydrographic Sections A to F (red, markers indicate
sta-tions) and Autosub Mission 382 (blue). The Fimbul ice edge is shown in black, with bathymetry both inside and out of the ice shelf cavity shown. Grounded ice is shaded white.
Fimbul Ice Shelf (Fig. 1) is fed by Jutulstraumen Ice Stream that flows northward along the Greenwich merid-ian, draining a substantial catchment south of the coastal mountain range Fimbulheimen, Dronning Maud Land. Data from the first and only full seismic survey of the ice shelf and sea bed topography (Nøst, 2004) have been used to pro-duce Fig. 1. The ice shelf thickness is typically 300–400 m downstream of Jutulstraumen (over 550 m near the ground-ing line), and 200–350 m over the remainground-ing shelf area. Offset slightly west of Jutulstraumen is a cavity with up to 900 m water column thickness, intersecting the continental shelf break to form a sill of sea bed depth less than 600 m, and water column thickness less than 400 m. Ice draft at the ice front is typically 150–200 m. East of Jutulstraumen the main cavity is connected to three smaller basins, each with a (shallower) sill out onto the continental shelf. Finally, Ju-tulstraumen feeds Trolltunga, a floating ice tongue that pro-trudes around 40 km north of the rest of the ice shelf, out over the continental slope to a water depth of more than 2000 m.
Smedsrud et al. (2006) applied an isopycnic coordinate model to the cavity beneath Fimbul Ice Shelf, and the conti-nental shelf and slope. They find a flow of relatively warm
water (some warmer than 0◦C, though the average modelled
cavity temperature is −1◦C) across the sill into the main cav-ity, driving a typical sub-ice-shelf thermohaline plume at the base of the ice shelf (Grosfeld et al., 1997). The ingress of such warm water gives a modelled maximum basal melt rate of greater than 10 m per year, with an average of 1.9 m per year. Such high melt rates would provide a freshwater flux comparable to that from the much larger Filchner-Ronne and Ross ice shelves. Other estimates of basal melting of Fim-bul Ice Shelf from numerical models (Beckmann and Goose, 2004) and remote sensing (Rignot and Jacobs, 2002) bracket
this estimate, but there is general agreement that the narrow continental shelf and close proximity of relatively warm wa-ters will produce high basal melt rates and a significant fresh-water flux.
Although waters warmer than 0◦C are found as shallow
as 200 m less than 100 km offshore at the Greenwich merid-ian, isotherms deepen markedly as they approach the coast, reflecting the baroclinic westward flow associated with the Antarctic Slope Front/Coastal Current system (Heywood et al., 1998). By the time it intersects the bathymetry, the 0◦C isotherm in this area is typically found at a depth of around 700 m, below the sill at the entrance to the Fimbul cavity. Consequently, Nøst (2004) argues that water warmer than −1◦C will not have direct access to the cavity.
Here we report on measurements made in February 2005 as part of the UK Autosub Under Ice programme, which in-cluded sending the autonomous submarine Autosub 25 km into the main Fimbul cavity. Nicholls et al. (2006) report on the main results from this mission, including finding that the ISW in the cavity has not been formed from waters found at the main sill or on the adjacent continental slope. Instead, the most likely source water candidate is found at the sill-entrance to one of the smaller cavities east of Jutulstraumen, in waters that have been modified by shelf processes. In this paper our main focus is on oxygen isotope ratio measure-ments made on the continental shelf in front of Fimbul Ice Shelf. The relative abundance of water containing the two common isotopes of oxygen, H162 O and H182 O, is used as a tracer for meteoric water input, and is especially sensitive to the input of glacial melt water. Freezing and melting of sea ice have only a small effect on the ratio, whereas evapora-tion and precipitaevapora-tion have a large effect. The consequence is that high latitude meteoric water, and especially glacial ice,
is strongly depleted in18O, which makes oxygen isotopes an
excellent tracer of water of glacial origin.
2 Data and methods
In February 2005 48 hydrographic stations were occupied from R. R. S. James Clark Ross on and adjacent to the con-tinental shelf in front of Fimbul Ice Shelf as part of the UK Autosub Under Ice programme (Fig. 1). The stations form six sections in total, occupied over 10 days from 12 to 21 February 2005. Sections A runs perpendicular to the ice front out to the 2000 m depth contour at the western end of the ice shelf, section C similarly crosses the shelf just west of Trolltunga, with section E just east of the tongue. Heavy sea ice prevented us from going shoreward of the 470 m contour in section E. Section B runs along the ice front from east to west, from the end of a small creek on the west side of Trolltunga to the ice-front end of section A. Section D runs along a roughly 10-km long creek into the west side of Troll-tunga. Finally, section F runs from the eastern end of the ice shelf west along the ice front down into the deepest of the
M. R. Price et al.: Ice-shelf – ocean interactions at Fimbul Ice Shelf 91 -1.9 -1.5 -1.0 -0.5 0.0 0.2 0.4 0 38 0 64 0 27 0 10 0 22 0 55 0 250 500 750 1000 1250 1500
Distance along track / km
Pressure / db A B C D E F a 33.5 34.0 34.2 34.4 34.60 34.65 34.67 0 38 0 64 0 27 0 10 0 22 0 55 0 250 500 750 1000 1250 1500
Distance along track / km
Pressure / db A B C D E F b 44 46 25 22 18 7 4 1 3 9 18 9 29 39 43 38 33 -0.55 -0.50 -0.45 -0.40 -0.35 -0.30 -0.20 -0.10 0.00 0 38 0 64 0 27 0 10 0 22 0 55 0 250 500 750 1000 1250 1500
Distance along track / km
Pressure / db
A B C D E F
c
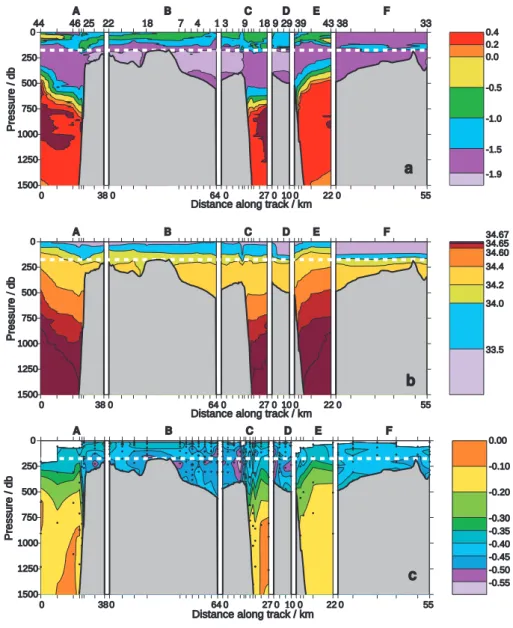
Fig. 2. (a) Potential temperature (b) salinity and (c) oxygen isotope ratio δ18O for the six hydrographic sections A to F (for locations see Fig. 1). Black dots indicate bottle sample locations for the δ18O data. The depth of the base of the ice shelf is indicated by the white dashed line.
smaller eastern sills. Heavy sea ice cover prevented further work east of Trolltunga. The southern-most three stations of section E and the northern-most four stations of section A were deployed from the stern of the ship in heavy sea-ice. The ship’s propellers were used to maintain ice free water at the stern during deployment, and will have vigorously stirred
the near surface water column. Thus no shallow18O samples
were collected at these stations, and the near surface CTD data should be treated with caution. Temperature and salin-ity data from Autosub mission 382 are also used (Fig. 1). The mission ran from the intersection of sections B and C to the southeast, 25 km into the cavity towards the northern end of the deepest part of the cavity. The southeastern end of the
mission reaches a water column thickness of around 650 m at a sea bed depth of 860 m.
Hydrographic sections were occupied using a Seabird 911 plus Conductivity-Temperature-Depth (CTD) system (with two pairs of conductivity and temperature sensors) and a 24-bottle water sampling carousel. Laboratory CTD calibration was performed both before and after the cruise. CTD salinity was calibrated against water samples collected at each sta-tion and analysed using a Guildline 8400b salinometer. An SBE 35 deep ocean standards thermometer was used as a cross-check on the temperature sensors and to identify a sen-sor which became slightly unstable for a handful of stations. We estimate temperature and salinity overall to be accurate to
33 33.2 33.4 33.6 33.8 34 34.2 34.4 34.6 -2 -1.5 -1 -0.5 0 0.5 LSSW AASW WDW MWDW ISW Salinity P otential T emperature / oC 33 33.2 33.4 33.6 33.8 34 34.2 34.4 34.6 -0.5 -0.4 -0.3 -0.2 -0.1 0 Salinity delta 18O -0.5 -0.4 -0.3 -0.2 -0.1 0 -2 -1.5 -1 -0.5 0 0.5 P otential T emperature / oC delta18O a b c
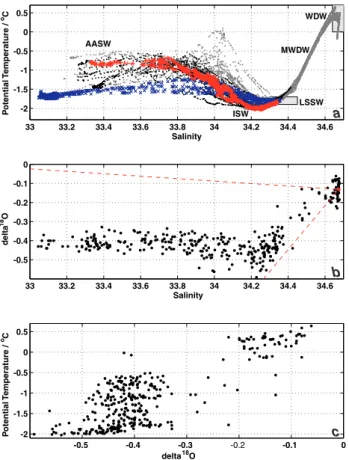
Fig. 3. Property-property diagrams of (a) Potential temperature
(◦C) – salinity, (b) Salinity – δ18O (‰) and (c) Potential temper-ature (◦C) – δ18O (‰). In (a) red plus-signs denote Autosub CTD data; Blue crosses denote the easternmost section F; black denotes other stations on the continental shelf; grey denotes the stations over the slope or deep ocean. In (b) the red marker shows the chosen WDW end member, with red dashed lines connecting to the glacial and sea ice end members.
±1 mK and ±0.001 respectively. The Autosub was equipped with a Seabird 9 plus CTD system, with sensors calibrated before the cruise. Drift rates given by the manufacturer sug-gest uncertainties for the Autosub CTD similar to the ship-borne instrument. However, we were unable to perform an in situ calibration, or a post-cruise calibration since the Au-tosub was lost on a subsequent mission, and must allow that the uncertainties could be a little higher.
Water samples for oxygen isotope ratio analysis were drawn from 10 litre Niskin bottles into 50 ml glass bottles, closed using aluminium caps with rubber insert and further sealed with Parafilm. The water samples were stored in a
4◦C cold room both at sea and on our return until they were
sent for analysis. The samples were analysed at the National Isotope Geosciences Laboratory (UK) by equilibration with
CO2 (Epstein and Mayeda, 1953), using a VG Isoprep 18
and Sira 10 mass spectrometer. H182 O to H162 O ratios are ex-pressed in delta notation (δ18O) relative to Vienna Standard
Mean Ocean Water (VSMOW) where: δ18O= " (18O/16O)sample (18O/16O) VSMOW−1 # × 1000.
Samples were analysed in triplicate, with a mean per sam-ple standard deviation of ±0.025‰. Long term absolute ac-curacy at the laboratory is ±0.04‰. The latter is the best estimate of uncertainty for comparisons with other data sets, while for comparisons within this data set the uncertainty lies somewhere between the two.
Salinity and δ18O are used in a three-end-member mass
balance in which the shelf waters are assumed to be formed from a linear mixture of sea ice melt water, glacial melt wa-ter, and Warm Deep Water (WDW). The technique calcu-lates the fraction of the three source water masses required to produce the properties of each sampled water parcel. The choice of end member properties, and the uncertainties in the resulting fractions will be discussed along with the results in Sect. 4.
3 Hydrographic properties
Temperature and salinity sections (Fig. 2) reveal a three-layer structure over the continental shelf on the west side of Troll-tunga (sections A, B, C and D). A near surface layer, down to around the ice draft at 150–200 m (the depth of the ice near the ice front), is typically rather fresh (salinity 33.05 to 34.2) and somewhat warmer than the surface freezing point (−1.9◦C to −0.5◦C). The range of properties in this layer are clearly seen in Fig. 3, with a large scatter in potential temper-ature below salinity 34.2 reflecting the range of processes at work. In addition to mixing, temperature is altered near the surface by radiative, sensible and latent heat fluxes, includ-ing meltinclud-ing of ice. Note that the warmest near surface wa-ters (warmer than −0.5◦C) are not found over the continental shelf. Salinity is similarly affected by mixing, sea ice melt-ing (in summer) or freezmelt-ing, meltmelt-ing of the ice shelf both at the wall and underside, melting of icebergs, direct local pre-cipitation and melting of winter snow accumulated on top of sea ice. The freshest and coldest water at the surface is found
in section F, with a minimum of −1.75◦C. This section is on
the continental shelf and was surrounded by sea ice. Surface temperature in the other sections lies in the range −1.5◦C to
−0.7◦C. Lower temperatures than these in the upper layer
are due to mixing with the colder layer below, the remnant of the cold winter mixed layer, named Winter Water.
A 200 m thick layer from the ice shelf base down to around
400 m has a temperature below the −1.9◦C surface freezing
point, with a minimum temperature of −2.03◦C near 250 m
depth. Salinity in this layer lies in the range 34.2 to 34.3, with salinity at the temperature minimum in the range 34.22 to 34.25. Since these temperatures are below the surface freez-ing point, these waters are by definition ISW that has been cooled (and freshened) by melting glacial ice at the ice shelf
M. R. Price et al.: Ice-shelf – ocean interactions at Fimbul Ice Shelf 93 base. The ISW formed beneath Filchner-Ronne Ice Shelf,
which contributes to deep water formation, has a salinity typ-ically in the range 34.5 to 34.65 (Gammelsrød et al., 1994), reflecting the high salinity of its source waters. The mini-mum temperature of the Filchner-Ronne ISW outflow is also
much lower, as low as −2.3◦C. By comparison, Fimbul ISW
is only around 0.15◦C colder than the surface freezing point, and has much lower salinities. Away from the coastal region,
water in the density range of the Fimbul ISW (σ0=27.50 to
27.62) would mix into the upper 100–150 m of the water col-umn (Heywood et al., 1998). Aside from the surface waters, Fimbul ISW may be expected to contribute to two Weddell Sea water masses: Winter Water (WW), a cold water mass formed by winter convection and identified in summer by a temperature minimum below the surface layer; and Eastern Shelf Water (ESW), the less saline variety of the Weddell Sea shelf waters found east of Filchner Ice Shelf. Fimbul ISW will be a cooling and freshening influence on both ESW and WW.
Below 400 m on the Fimbul continental shelf water, poten-tial temperature increases again above the surface freezing point. The eastern end of section B runs down the western slope into the sill at the entrance to the main cavity. The east-ern most station (station 15) was in 560 m of water, and there-fore close to the maximum depth of the sill. The warmest
water sampled at the bottom of station 15 was −1.86◦C.
Sec-tion D similarly runs down the western slope of the sill, but closer to the shelf break, and has a maximum bottom
temper-ature of −1.73◦C in 499 m of water. From a dynamical point
of view, in the absence of friction we would expect water to be guided by contours of f/H , where f is the Coriolis pa-rameter, and H the water column thickness. From the map of water column thickness presented by Nøst (2004), water flowing from the east would have to negotiate the deflection in water column thickness contours produced by Trolltunga. The contours suggest that in principle it is possible for water from continental shelf depths east of the tongue then to enter the cavity on the eastern side of the sill. This is not the case for waters from shelf break depths (∼500 m) and deeper.
Turning to the temperature-salinity data from Autosub mission 382 (Fig. 3; see Nicholls et al. (2006) for a detailed description), in the cavity Autosub detected water colder than −1.9◦C at all water depths less than the sill depth, reaching
a maximum temperature of −1.84◦C at 706 m depth. It is
conceivable that warmer water than sampled at any of these locations might lie on the eastern slope of the sill, which was not sampled either from the ship or Autosub. However, the width of the sill is only 10–20 km, and it seems unlikely that much warmer water could enter the cavity so close to the sampled locations without betraying its presence by some warm intrusions or mixing. Given the general westward flow in this location associated with the Antarctic Slope Front and coastal current, section E can be considered to reflect condi-tions upstream of the sill. The deepest water at the shallowest station at the southern end of that section (in 480 m of water)
is −1.46◦C, and at the sill depth 100 m deeper the water will be still warmer. The next deeper station in section E is in
924 m of water, and has water as warm as −0.5◦C at 580 m.
The southward-deepening isotherms mean that the water at the sea bed at this depth will be colder, so this represents an unrealistically high upper limit on the temperature of water that had access to the sill during our field campaign.
Over the continental slope, below the depth of the ice shelf, the water becomes both warmer and saltier down to the temperature maximum core of Warm Deep Water (WDW). Since isotherms and isohalines shoal towards the north, warmer and saltier water is also found at a given depth horizon with increasing distance from the shelf break. Less than 20 km from the shelf break, all on-shelf isolines have shoaled to 250 m or shallower, giving an indication of the depth horizon into which these waters will ultimately mix. Typical temperature maximum properties at the northern end
of sections A, C and E are 0.4–0.5◦C, with maximum
salin-ity 34.67–34.68 (Fig. 3). These are very similar to the near-shelf break temperature maximum observed by Heywood et
al. (1998) at 17◦W (their maximum temperature is perhaps
0.1◦C higher), though their section extends further offshore where warmer and saltier waters are found. The warmest
wa-ter sampled was 0.66◦C near 800 m depth at the northern end
of section C, with a salinity of 34.655, which is likely to be an intrusion from further north (Fig. 3). Below the temper-ature maximum the water becomes both cooler and fresher,
with a minimum temperature of −0.182◦C and a salinity of
34.665.
4 Oxygen isotope ratios
A similar layered water mass structure is seen in δ18O as in temperature and salinity, although with more horizontal vari-ability over the shelf, particularly around the depth of the ice shelf base (Figs. 2c, 3b). The freshest layer above the ice shelf draft has δ18O in the range −0.45 to −0.35‰, typical of near surface southern Weddell Sea waters that have received meteoric water input from the range of processes discussed earlier (Weppernig et al., 1996), in combination with fresh-water exchanges from sea-ice melting and freezing that are close to isotopically neutral. Both salinity and temperature are highly variable, temporally and spatially; while δ18O is the only surface property that is well-constrained, presum-ably because it is set at larger temporal and spatial scales (compare Fig. 3a, b and c). The figures must be interpreted
with care, because the measurement error in δ18O is very
much greater as a proportion of the observed range than in either temperature or salinity, which tends to exaggerate the measured scatter in δ18O.
The highest values of δ18O are just above −0.1‰ in
the WDW. This is typical, with WDW in the central Wed-dell Gyre having δ18O slightly closer to zero (Weiss et al.,
1979). Below the WDW core, δ18O decreases again to below
−0.2‰ in the deep water, reflecting the glacial melt wa-ter input (at other locations) into this wawa-ter type. Some of this isotopically light signature may come from direct pre-cipitation into surface waters in the Antarctic zone during deep water formation. However in areas close to the Antarc-tic continental shelf, the primary source of isotopically light freshwater is expected to be the glacial melt water (Jacobs et al., 1985). The deep water properties are typical of those of Weddell Sea Deep Water (WSDW) found below WDW in the Weddell Sea. Its formation region may be the south-west or south-western Weddell Sea, and it may have circulated to the Fimbul region with circulation of the Weddell Gyre. The water mass properties are also consistent with the bottom-intensified westward flow hugging the bottom of the Antarc-tic continental slope in the Weddell Basin. This deep wa-ter may form near the Amery Ice Shelf or enwa-ter the Wed-dell Basin from the Australian-Antarctic Basin through the Princess Elizabeth Trough (Meredith et al., 1999).
The ISW layer has δ18O below −0.45‰, typically below
−0.5‰ and with a minimum of −0.59‰ sampled at 205 m at the western end of section D. These values show a marked influence of meteoric water, which can only be sub-ice shelf
melt at these depths and temperatures. For comparison, δ18O
as low as −0.8‰ has been reported close to the front of Filchner Ice Shelf (Schlosser et al., 1990), with values below −0.7‰ routinely found in the Filchner Trough. δ18O deple-tion is linearly related to both the fracdeple-tion of glacial melt wa-ter added to the source wawa-ter, and the δ18O of the glacial ice. The latter depends on the latitude, altitude and climate un-der which the water was precipitated. Glaciologically, Fim-bul Ice Shelf consists of a relatively thin ice sheet fed by snow falling seaward of coastal mountain ranges, incised by a much thicker, rapidly moving core of ice that is an exten-sion of the Jutulstraumen ice stream. The catchment of the Jutulstraumen ice stream lies poleward of the coastal moun-tain ranges, and is relatively high and cold with a strongly
negative surface snow δ18O. Stenberg et al. (1998) give the
variation of δ18O in surface snow with elevation for this area, based on shallow ice cores. By combining this with the ac-cumulation rate field (Vaughan et al., 1999) and the surface elevation for the Jutulstraumen catchment we find a mean,
present-day δ18O for Jutulstraumen of −38.7±2‰.
How-ever, the Jutulstraumen ice presently melting from the base of Fimbul Ice Shelf is likely to be rather old, possibly having been precipitated during the last glacial maximum. Based on the results of the Dronning Maud Land ice core, this would reduce the estimate by up to 8‰ (EPICA Community Mem-bers, 2006). An additional problem with the estimate is that it is not clear how much of the melting at the base of Fimbul Ice Shelf is of the thick, Jutulstraumen-sourced ice, and how much is from the rather thinner ice to the east and west. The area of the non-Jutulstraumen-sourced ice shelf is larger, but as that part of the ice shelf is also thinner, it is likely to have lower melt rates. It is clear that the ice in the thinner ice shelf
will have a much higher δ18O, as the snow comprising it is
likely to have been fallen more recently, and at lower (and therefore warmer) elevation. In the face of the uncertainties,
we assume a δ18O for the glacial meltwater of −40±5‰.
In assuming this value, we are of necessity ignoring any contribution to the meteoric freshwater by other meteoric in-puts, such as direct precipitation into the water in the coastal region, or snow blown off the ice shelf. Precipitation into the sea water is likely to be a relatively minor contributor to the freshwater budget. The annual average precipitation in the region of Fimbul ice shelf is approximately 300 mm/year (Bromwich et al. 2004). Compared with the estimates of shelf ice melt of 1m/year or more (Smedsrud et al., 2006; Beckmann and Goose, 2004; Rignot and Jacobs, 2002), the precipitation is likely to contribute less than a third of the freshwater input. More importantly, the precipitation can be distinguished from the shelf ice melt by the depth at which it appears. Precipitation will be confined to the surface tens of metres, typically highly stratified in salinity. Shelf ice melt is clearly observed emanating beneath the base of the ice shelf (Fig. 2). Measurements in snowfall in Dronning Maud Land just west of Fimbul Ice Shelf (Helsen et al., 2005), suggest that coastal precipitation has an oxygen isotopic value of −20 and −30‰, less depleted than the ice shelf meltwater that originated as precipitation further south and at higher alti-tudes.
We use the ice shelf δ18O estimate of −40±5‰ at zero
salinity as one of the source water masses in a three-end-member mass balance. The other source waters are sea ice
and WDW. The δ18O of sea ice is typically +2.1‰ higher
than the waters from which it formed (Melling and Moore,
1994). Measured surface values of δ18O during our field
programme were around −0.4‰, but we expect this to be
a lower limit on the δ18O of waters forming sea ice, so we
choose a value of +1.9‰ for sea ice δ18O, with an
uncer-tainty of ±0.2‰ to allow for sea ice formation from waters
with δ18O in the range −0.4 to 0.0‰. Sea ice bulk
salin-ity depends on a number of factors including the age of the ice, with salinity decreasing as the age of ice increases. In this region of the Antarctic sea ice does not persist over the summer season except in small areas at the coast (Zwally et al., 2002), so while there may have been some multi-year ice we expect that most of the ice around Fimbul Ice Shelf in summer will have formed in the previous winter season. Sea ice salinity is usually a function of depth in the ice as well as the conditions of formation (Eicken, 1992), but we expect the average salinity for the sea-ice end member to be in the range 6.0±1.1 (Eicken, 1998). Finally, the WDW source water mass is chosen by taking the average salinity
and δ18O from the samples taken near the salinity maximum
(defined as salinity 34.67–34.68, potential temperature 0.3–
0.5◦C). The chosen end member has salinity 34.67 and δ18O
−0.131‰. The error in δ18O is assumed to be the standard error of the mean of the five measurements used, which is ±0.018‰.
M. R. Price et al.: Ice-shelf – ocean interactions at Fimbul Ice Shelf 95 0.2 0.4 0.6 0.8 1.0 1.2 0 38 0 64 0 27 0 10 0 22 0 55 0 250 500 750 1000 1250 1500
Distance along track / km
Pressure / db A B C D E F 0.0 0.5 1.0 1.5 2.0 2.5 3.0 3.5 4.0 0 38 0 64 0 27 0 10 0 22 0 55 0 250 500 750 1000 1250 1500
Distance along track / km
Pressure / db
A B C D E F
44 46 25 22 18 7 4 1 3 9 18 9 29 39 43 38 33
a
b
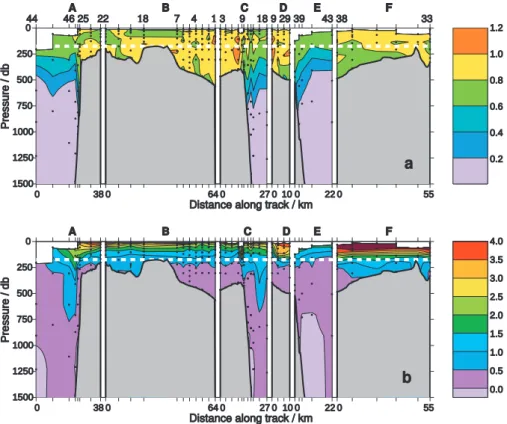
Fig. 4. (a) Meteoric water fraction (%) and (b) sea ice fraction (%) for the six hydrographic sections A to F (for locations see Fig. 1) derived
from the data shown in Fig. 2. Black dots indicate bottle locations, and the depth of the base of the ice shelf is indicated by the white dashed line.
The sensitivity of the calculated fractions to these uncer-tainties has been examined by repeating the 3-end-member calculations with every pair of end members perturbed in every combination. This gives twelve perturbed results, of which four produce the largest errors in sea ice and mete-oric water fractions. In the worst case combination for the meteoric fraction, 95% of the calculated fractions lie within 0.19% of the unperturbed fractions, while in the worst case combination for sea ice 95% of the calculated fractions lie within 0.29% of the unperturbed fractions. Thus the uncer-tainty in a meteoric fraction of 1%, for example, is ±0.19%. Fractions of meteoric water and sea ice are shown in Fig. 4a and b respectively. Again a layered structure is apparent; with the meteoric fraction also showing the strong horizontal variability noted in δ18O.
The near surface layer above the ice shelf draft has a rel-atively high sea ice fraction up to a maximum of 4.5% and typically greater than 1.5%. Meteoric fraction over the conti-nental shelf varies between 0.6% and 1.2%, and is generally less than 1.0% in the upper layer. Consequently the very fresh near-surface layers have been predominantly freshened by sea ice melt. Two sections, section F along the ice front to the east of Trolltunga and section D in the creek, are very fresh and have a high proportion of sea ice melt down to the depth of the ice shelf base. For section D this is probably a consequence of sea ice melting in an enclosed area.
Signif-icant sea ice melt is also indicated around section F where heavy sea ice cover was experienced at the time of the sec-tion occupasec-tion; this may be a region into which sea ice is advected from the east and subsequently melts.
The sea ice melt fraction below the ice shelf draft is usually between −0.5% and +0.5%, mostly within ±0.29% (i.e. not significantly different from zero). The average meteoric frac-tion in the ISW layer is only slightly higher than in the near-surface layer, but there are cores of higher meteoric fraction marked in Fig. 2c by cores of low δ18O. These high fractions of meteoric water are all found west of Trolltunga. Meteoric fractions above 1.0% are not present east of the tongue, be-cause there is no local source of ISW here and the general flow along the shelf is westward. Instead, the high
mete-oric fraction/low δ18O cores mark likely ISW sources west
of Trolltunga. There are several cores along the ice front section B, including one lying at around 250 m against the bathymetry on the slope down into the sill. Dynamically this is the most likely location for an ISW rich current flowing out of the Fimbul cavity, at a realistic depth and hugging the slope on its left. However, the horizontal (and vertical) struc-ture in the high meteoric fraction cores perhaps indicate that episodic eddying processes carry some ISW out of the cavity, and that ISW collects at some locations (e.g. around the shal-low bathymetry in section A and the west end of section B).
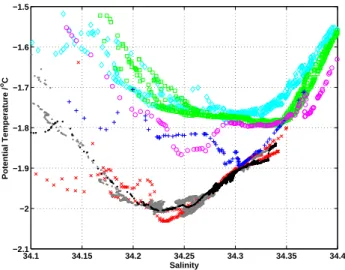
34.1 34.15 34.2 34.25 34.3 34.35 34.4 −2.1 −2 −1.9 −1.8 −1.7 −1.6 −1.5 Salinity Potential Temperature / oC
Fig. 5. Potential temperature – salinity diagram for stations west
of Trolltunga (stations 15 at eastern end of section B, 9 and 29, west and east ends of section D respectively, red crosses), Autosub Mission 382 inbound (black points) and outbound (grey points), sta-tions 39 to 41 from seaward of the shelf break in Section E (cyan diamonds), stations 11 to 14 and 18 (from seaward of the shelf break in Section C, green squares), station 10 (at the section C shelf break, blue plus-signs) and station 25 (at the section A shelf break , ma-genta circles).
Section C shows an ISW tongue extending back to the cav-ity, probably reflecting the source there, but the highest frac-tion core of meteoric water (1.16%) can be seen in stafrac-tion 9 (Fig. 1) at the open end of section D, and just landward of the shelf break section C (the same station is part of both sec-tions). Given that the flow is westward near the shelf break, this points to Trolltunga as a second source of ISW. Two ad-ditional pieces of evidence support this. First, there is a core of ISW with meteoric fraction greater than 1.0% at the closed end of the section D creek, though this could conceivably have a source within the cavity. Secondly, there are two small cores of meteoric fraction greater than 0.8% around 150 m water depth in eddy-like structures seaward of the shelf break in section C. This is evidence of locally sourced glacial melt water being mixed out across the Antarctic Slope Front into the southern Weddell Sea. The slope front will be a strong dynamic barrier to ISW from the cavity; it seems more likely that the source of this glacial melt water is Trolltunga itself.
5 Discussion and conclusions
First, we consider the source of the water beneath the ice shelf, that ultimately becomes ISW through modification un-der the ice shelf. One might expect this to be found at the main sill or upstream of the ice shelf in section E. However Nicholls et al. (2006) showed that water of the appropriate properties was not detected in either of these locations, but rather at the eastern most sill sampled in section F (Fig. 5).
Second, we consider the fate of the water emanating from beneath the ice shelf. These observations show clearly that locally formed ISW mixes out across the continental slope (Fig. 5). Below the surface freezing point the water sampled by Autosub and by the stations west of Trolltunga lie along the same trajectory in θ -S space. The figure shows the tem-perature minimum with which the ISW will mix as it leaves the Fimbul ice shelf. Stations 10 at the section C shelf break and station 25 at the section A shelf break show clear evi-dence of interleaving and mixing between the ISW and the water over the continental slope downstream of the Fimbul cavity and ice tongue.
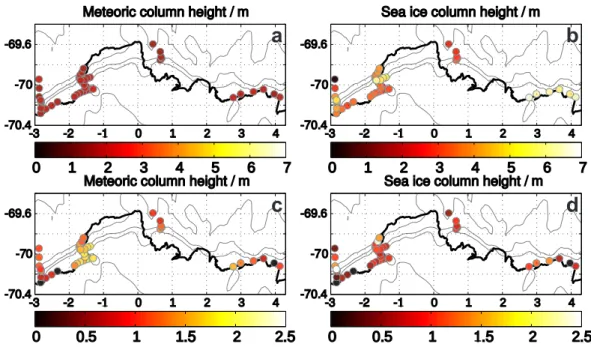
Figure 6 provides a summary of the distribution of the two sources of fresh water in the region of Fimbul Ice Shelf. In the upper water column, there is little meteoric input (Fig. 6a) compared with the significant addition of fresh sea ice melt water (Fig. 6b). Two regions show particularly high addi-tions of sea ice melt water, namely upstream of Trolltunga, and in the creek in the lee of the tongue. In both depth ranges, great sea ice melt water contributions are seen in the region of the Antarctic Slope Front, tied to the steep topography of the continental slope (Fig. 6b and d). The deeper depth range illustrates clearly the outflow of freshwater influenced primarily by the ice shelf (Fig. 6c) where a greater meteoric column height is seen just to the west of the ice shelf. At this depth, the contribution of local precipitation is likely to be negligible. In the upper water column, particularly near the sea surface, there is likely to be a small contribution to the freshwater from local precipitation, less depleted in the heavy isotope than glacial ice meltwater. Therefore in the near surface water, the meteoric contribution is likely to be a slight underestimate while the sea ice contribution is likely to be a slight overestimate. Given the other uncertainties in the calculations, and the unknown recent meteorological condi-tions over the water that we observed during the survey, we consider this to be an unimportant source of uncertainty.
The ISW found at station 9 is most likely to be from interaction with Trolltunga itself, with little if any compo-nent from the ice shelf east of the main core of ice flowing from Jutulstraumen. Although we would expect the rela-tively buoyant ISW from the eastern ice base to be guided by the ice shelf basal topography, the capacity of the basal ridge beneath the main core of the ice shelf to direct ISW northwards such that it could influence station 9 is limited: from Darelius and W˚ahlin (2007), who analysed the capacity of ridges to support downslope flows, it can be shown that the flow along the basal ridge would amount to only a few hundred m3s−1. It therefore seems most likely that there are two distinct sources of ISW at Fimbul Ice Shelf: the main cavity and the ice tongue itself.
In their model runs Smedsrud et al. (2006) find an inflow of relatively warm water into Fimbul Ice Shelf system, which adds weight to the argument that the proximity of the east-ern Weddell ice shelves to relatively warm deep water makes particularly vulnerable to the effects of any ocean warming.
M. R. Price et al.: Ice-shelf – ocean interactions at Fimbul Ice Shelf 97
Meteoric column height / m
-3 -2 -1 0 1 2 3 4 -70.4
-70 -69.6
0 1 2 3 4 5 6 7
Sea ice column height / m
-3 -2 -1 0 1 2 3 4 -70.4
-70 -69.6
0 1 2 3 4 5 6 7
Meteoric column height / m
-3 -2 -1 0 1 2 3 4 -70.4
-70 -69.6
0 0.5 1 1.5 2 2.5
Sea ice column height / m
-3 -2 -1 0 1 2 3 4 -70.4 -70 -69.6 0 0.5 1 1.5 2 2.5 a b d c
Fig. 6. Integrated column heights (m) of freshwater content. The upper two panels show the depth range from 0–200 m while the lower two
panels show 200–400 m. Left hand panels show meteoric input (primarily glacial ice melt in this location) and right hand panels show sea ice melt water. Note the change of colour scale between the upper and lower panels.
Nicholls et al. (2006) find support for the suggestion of Nost (2004) that such warm waters will not have direct access to the ice shelf cavity, but instead the source water for the cav-ity is modified by shelf processes. Our examination of the ship-based hydrographic sections supports this conclusion; we find water warmer than the surface freezing point below the ISW layer but no evidence that WDW enters the cavity directly. However this does not exclude the possibility that warmer water may episodically enter the shelf and ice-cavity system as the Antarctic Slope Front varies internally and re-sponds to variable wind forcing.
There are few previous hydrographic measurements on the continental shelf region around Fimbul ice shelf. A com-parison with historical observations is not the focus of this study, but we comment briefly because temporal variabil-ity in the water properties offshore may influence the ease with which warm deep water has access to the base of the ice shelf. The mean of 5 repeat sections during the 1990s at the Greenwich meridian including some stations on the con-tinental slope (Klatt et al., 2005) shows clearly the steep de-scent of the isotherms and isohalines towards the continental slope. In salinity, their 34.67 isohaline meets the continental slope at a depth of about 900 m, and the 34.4 isohaline meets the slope at 400 m. Our analogous values are slightly deeper
by ∼100 m. In temperature, their 0◦C isotherm meets the
slope below 1500 m, whereas ours meets the slope at about 800 m. This implies that the relatively warm deep water may have had easier access to the continental shelf during 2005, and may be increasingly able to melt the ice shelf.
Acknowledgements. We thank the NERC Autosub Under Ice
programme for funding of the UEA and BAS groups. The research would not have been possible without the hard work and enthusiasm of those involved in the programme and in particular all onboard RRS James Clark Ross cruise 97. We thank P. Abrahamsen for a useful suggestion, and two anonymous reviewers who helped improve the manuscript.
Edited by: E. J. M. Delhez
References
Beckmann A., Hellmer, H. H., and Timmermann, R.: A numeri-cal model of the Weddell Sea: Large-snumeri-cale circulation and water mass distribution, J. Geophys. Res., 104(C10), 23 375–23 391, 1999.
Beckmann, A. and Goose, H.: A parameterization of ice shelf-ocean interaction for climate models, Ocean Mod., 5, 157–170, 2004. Bromwich, D. H., Guo, Z., Bai, L., and Chen, W.: Modeled
Antarc-tic precipitation. Part 1: Spatial and temporal variability, J. Cli-mate, 17, 427–447, 2004.
Darelius, E. and W˚ahlin, A. K.: Downward flow of dense water leaning on a submarine ridge, Deep Sea Res., 54, 1173–1188, 2007.
Eicken, H.: Salinity Profiles of Antarctic Sea Ice: Field Data and Model Results, J. Geophys. Res., 97(C10), 15 545–15 557, 1992. Eicken, H.: Deriving Modes and Rates of Ice Growth in the Weddell Sea From Microstructural, Salinity and Stable-Isotope Data, in: Antarctic Sea Ice: Physical Processes, Interactions and Variabil-ity, edited by: Jeffries, M. O., AGU, Antarctic Research Series, 89–122, 1998.
EPICA Community Members: One-to-one coupling of glacial cli-mate variability in Greenland and Antarctica, Nature, 444, 195– 198, 2006.
Epstein, S. and Mayeda, T.: Variations of O18 content of waters from natural sources, Geochim. Cosmochim. Acta, 4, 213–224, 1953.
Fahrbach, E., Peterson, R. G., Rohardt, G., Schlosser, P., and Bayer, R.: Suppression of bottom water formation in the southeastern Weddell Sea, Deep-Sea Res. I, 41(2), 389–411, 1994.
Foldvik, A., Gammelsrod, T., Osterhus, S., Fahrbach, E., Rohardt, G., Schroder, M., Nicholls, K. W., Padman, L., and Woodgate, R. A.: Ice shelf water overflow and bottom water formation in the southern Weddell Sea, J. Geophys. Res., 109, C02015, doi:10.1029/2003JC002008, 2004.
Gammelsrod T., Foldvik, A., Nost, O. A., Skagseth, O., Anderson, L. G., Fogelqvist, E., Olsson, K., Tanhua, T., Jones, E. P., and Osterhus, S.: Distribution of Water Masses on the Continental Shelf in the Southern Weddell Sea, in: The Polar Oceans and Their Role in Shaping the Global Environment, edited by: Jo-hannessen, O. M., Monogr. Ser., 85, 159–176, 1994.
Grosfeld, K., Gerdes, R., and Determann, J.: Thermohaline circu-lation and interaction between ice shelf cavities and the adjacent open ocean, J. Geophys. Res., 102(C7), 15 595–15 610, 1997. Helsen, M. M., Van De Wal, R. S. W., Van Den Broeke, M. R., Van
As, D., Meijer, H. A. J., and Reijmer, C. H.: Oxygen isotope variability in snow from western Dronning Maud Land, Antarc-tica and its relation to temperature, Tellus, 57B, 423–435, 2005. Heywood, K. J., Locarnini, R. A., Frew, R. D., Dennis, P. F., and
King, B. A.: Transport and Water Masses of the Antarctic Slope Front System in the Eastern Weddell Sea, Ocean, Ice and Atmo-sphere: Interactions at the Antarctic Continental Margin, Antarc-tic Research Series, 75, 203–214, 1998.
Jacobs, S. S., Fairbanks, R. G., and Horibe, Y.: Origin and evolu-tion of water masses near the Antarctic continental margin: Ev-idence from H218O/H216O ratios in seawater, in: Oceanology of the Antarctic continental shelf, edited by: Jacobs, S. S., AGU, Washington D.C., Antarctic Research Series, 43, 59–85, 1985. Klatt, O., Fahrbach, E., Hoppema, M., and Rohardt, G.: The
trans-port of the Weddell Gyre across the Prime Meridian, Deep-Sea Res. II, 52, 513–528, 2005.
Melling, H. and Moore, R. M.: Modification of halocline source waters during freezing on the Beaufort Sea shelf: evidence from oxygen isotopes and dissolved nutrients, Cont. Shelf Res., 15, 89–113, 1995.
Meredith, M. P., Heywood, K. J., Frew, R. D., and Dennis, P. F.: Formation and circulation of the water masses between the south-ern Indian Ocean and Antarctica: Results from δ18O, J. Mar. Res., 57, 449–470, 1999.
Nicholls, K. W., Abrahamsen, E. P., Buck, J. J. H., Dodd, P. A., Goldblatt, C. , Griffiths, G., Heywood, K. J., Hughes, N. E., Kaletzky, A., Lane-Serff, G. F., McPhail, S. D. Millard, N. W., Oliver, K. I. C., Perrett, J., Price, M. R., Pudsey, C. J., Saw, K., Stansfield, K., Stott, M. J., Wadhams, P., Webb, A. T., and Wilkinson, J. P.: Measurements beneath an Antarctic ice shelf using an autonomous underwater vehicle, Geophys. Res. Lett., 33, L08612, doi:10.1029/2006GL025998, 2006.
Nost, O. A.: Measurements of ice thickness and seabed topography under the Fimbul Ice Shelf, Dronning Maud Land, Antarctica, J. Geophys. Res., 109, C10010, doi:10.1029/2004JC002277, 2004. Rignot, E. and Jacobs, S. S.: Rapid Bottom Melting Widespread near Antarctic Ice Sheet Grounding Lines, Science, 296, 2020– 2022, 2002.
Schlosser, P., Bayer, R., Foldvik, A., Gammelsrod, T., Rohardt, G., and Munnich, K. O.: Oxygen 18 and Helium as Tracers of Ice Shelf Water and Water/Ice Interactions in the Weddell Sea, J. Geophys. Res., 95(C3), 3253–3263, 1990.
Smedsrud, L. H., Jenkins, A., Holland, D. M., and Nost, O. A.: Modeling Ocean Processes Beneath Fimbulisen, Antarctica, J. Geophys. Res., 111, C01007, doi:10.1029/2005JC002915, 2006. Stenberg, M., Isaksson, E., Hansson, M., Karlen, W., Mayewski, P. A., Twickler, M. S., Whitlow, S. I., and Gundestrup, N.: Spatial variability of snow chemistry in western Dronning Maud Land, Antarctica, Ann. Glaciol., 27, 378–384, 1998.
Toggweiler, J. R. and Samuels, B.: Effect of Sea Ice on the Salinity of Antarctic Bottom Waters, J. Phys. Oceanogr., 25, 1980–1997, 1995.
Vaughan, D. G., Bamber, J. L., Giovinetto, M., Russell, J., and Cooper, A. P. R.: Reassessment of net surface mass balance in Antarctica, J. Climate, 12, 933–946, 1999
Weiss, R. F., Ostlund, H. G., and Craig, H.: Geochemical studies of the Weddell Sea, Deep-Sea Res., 26A, 1093–1120, 1979. Weppernig, R., Schlosser, P., Khatiwala, S., and Fairbanks, R. G.:
Isotope data from Ice Station Weddell: Implications for deep wa-ter formation in the Weddell Sea, J. Geophys. Res., 101(C10), 25 723–25 739, 1996.
Zwally, H. J., Comiso, J. C., Parkinson, C. L., Cavalieri, D. J., and Gloersen, P.: Variability of Antarctic sea ice 1979–1998, J Geo-phys. Res., 107(C5), doi:10.1029/2000JC000733, 2002.