HAL Id: hal-00304893
https://hal.archives-ouvertes.fr/hal-00304893
Submitted on 1 Jan 2003HAL is a multi-disciplinary open access archive for the deposit and dissemination of sci-entific research documents, whether they are pub-lished or not. The documents may come from teaching and research institutions in France or abroad, or from public or private research centers.
L’archive ouverte pluridisciplinaire HAL, est destinée au dépôt et à la diffusion de documents scientifiques de niveau recherche, publiés ou non, émanant des établissements d’enseignement et de recherche français ou étrangers, des laboratoires publics ou privés.
lakes from acidification: Part I - the Bohemian forest
V. Majer, B. J. Cosby, J. Kopácek, J. Veselý
To cite this version:
V. Majer, B. J. Cosby, J. Kopácek, J. Veselý. Modelling reversibility of Central European moun-tain lakes from acidification: Part I - the Bohemian forest. Hydrology and Earth System Sciences Discussions, European Geosciences Union, 2003, 7 (4), pp.494-509. �hal-00304893�
Modelling reversibility of Central European mountain lakes from
acidification: Part I - the Bohemian forest
Vladimír Majer
1, Bernard J. Cosby
2, Jirí Kopácek
3and Josef Veselý
1 1Czech Geological Survey, Geologická 6, 152 00 Praha 5, Czech Republic2Department of Environmental Sciences, University of Virginia, Charlottesville, VA 22903 USA
3Hydrobiological Institute, AS CR, and Faculty of Biological Sciences, USB, Na Sádkách 7, 370 05 Ceské Budjovice, Czech Republic
Email for corresponding author: [email protected]
Abstract
A dynamic, process-based acidification model, MAGIC7, has been applied to three small, strongly acidified lakes in the Bohemian Forest, the Czech Republic. The model was calibrated for a set of experimental records on lake water composition over the 19842000 period, and produced hindcast concentrations that compared well, even with older (40-year) irregular determinations of nitrate, chloride and pH. Water and soil chemistry forecasts up to 2050 were based on reductions in S and N emissions presupposed by the Gothenburg Protocol. Modelled sulphate and chloride concentrations were predicted to decrease to the levels at the beginning of the 20th century by 2050. The lake water carbonate buffering system is predicted to be re-established in only two lakes (Cerné and Plené), with current soil base saturations of 12-15%. Concentrations of ionic aluminium species decreased sharply, from 110 µeq l-1 in the mid-1980s to the current ~40 µeq l1, and were predicted to decrease below 10 µeq l1 in the 2020s. Diatom-inferred pH in pre-industrial times was substantially lower than modelled pH. It is suggested that the diatom pH, based almost entirely on non-planktonic species, is biased by inwash of diatoms from more acidic tributaries into the sediment of these small lakes. Generally significant results can be summarised as follows: (1) Simulated sulphate levels agree well with observations during acidification progress and retreat only for values of soil SO42-adsorption capacity three to six times (20 to 40 meq kg1) higher than those found experimentally. This implies a further mechanism of S retention and release in addition to physical sulphate adsorption to Fe and Al oxides of soils. (2) The catchments ability to retain deposited N appeared to decline after ~1950 but this was not connected with a sufficient change in the C : N ratio of the soils. Agreement between modelled and observed concentrations of nitrate was therefore achieved by empirical restriction of N retention in the soils. Based on their current ability to retain N, the catchments will remain N-saturated and could, temporarily, produce more inorganic N than they receive due to additional nitrate production from soil N-organic pools. This situation has occurred already in the Cerné Lake catchment. (3) Differences in responses of individual lakes can be attributed to different land usages over the past several centuries as well as to differences in geology and primary production.
Keywords: MAGIC, atmospheric deposition, N retention, diatom-inferred pH, sulphate, nitrate, base cations, aluminium, Czech Republic
Introduction
Extremely high emissions of sulphur (S) and nitrogen (N) compounds (~280 mmol m2 yr1 each) declined by >70%
and ~35%, respectively, in the central European region of Germany, Poland, Czech Republic and Slovakia between the second half of the 1980s and the late 1990s (Barrett et
al., 2000). The reduction in atmospheric inputs of S and N
to mountain ecosystems has resulted in a pronounced reversal of the acidification of fresh waters in this region (Veselý et al., 2002), including the Tatra Mountains and Bohemian Forest lakes (Kopácek et al., 1998; Veselý et al., 1998a,b). These mountain lakes responded most quickly to a decrease in S input and were the only European lakes
exhibiting significantly decreasing trends in NO3 over the
1990s (Evans et al., 2001; Prechtel et al., 2001). Despite this rapid decline in lake water concentrations of strong acid anions, their concentrations were substantially higher than expectations based on observed concentrations at comparable emission rates during the development of acidification (Kopácek et al., 2002a). This hysteresis in chemical reversal from acidification was predominantly associated with a washout of S accumulated in soils and N-saturation of their catchments (Kopácek et al., 2001a). Consequently, mineralisation and desorption of S accumulated in soils and a decreasing ability of N-saturated terrestrial ecosystems to retain N have become the most
important processes affecting soil and water quality in these mountain regions, as has been observed elsewhere (e.g. Stoddard, 1994; Alewell et al., 2000).
The leaching of S to surface waters and the resulting changes in acid-base chemistry can be simulated with the original model of MAGIC (Modelling the Acidification of Groundwater in Catchments, Cosby et al., 1985). On the other hand, the N dynamics oriented model MERLIN (Model of Ecosystem Retention and Loss of Inorganic Nitrogen, Cosby et al., 1997) provides a rigorous treatment of N cycling. The later model, however, requires a large amount of information on N and C pools and cycles, which is usually lacking (Wright et al., 1998). The new MAGIC7 (Cosby et al., 2001) offers a satisfactory compromise between the original MAGIC and MERLIN, allowing the simulation of changes in acid-base water chemistry associated with changing S and N deposition trends (Wright
et al., 1998).
The Bohemian Forest and Tatra Mountains represent unique mountain-forest and alpine ecosystems, respectively, with a high potential of lake water reversal from acidification due to the pronounced reductions in S and N deposition since the late 1980s (Kopácek et al., 2001a). In this Part I, MAGIC 7 (Cosby et al., 2001) is applied to modelling historical changes in lake water and forest soil chemistry in three catchments of the Bohemian Forest lakes and to simulating future (until 2050) responses to different scenarios of acid deposition. In Part II (Kopácek et al., 2003), a similar simulation is presented for four representative alpine catchments in the Tatra Mountains.
Methods
SITE DESCRIPTION
In the Bohemian Forest at the Czech-German-Austrian border, there are eight small glacial lakes situated between 48o47´ and 49o11´ N, and 13o07´and 13o52´ E, at elevations
of 9181096 m a.s.l. The following three lakes were included in this study: (1) Cerné Lake (CN), the largest; (2) Certovo Lake (CT), the most acid; and (3) Plené Lake (PL), with the highest trophic status due to a higher loading of phosphorus (P) and dissolved organic carbon from natural terrestrial sources than in other lakes. The selected lakes are dimictic, drainage, oligotrophic (CN and CT) or mesotrophic (PL) water bodies, with theoretical water residence times between 0.7 and 1.6 years and with three to nine surface tributaries (Kopácek et al., 2001b,c,d).
CT and CN Lakes are situated on opposite sides of the same mountain and their catchments are steep with maximum local reliefs of 313 m and 335 m, respectively.
The bedrock is formed primarily of mica-schist (muscovitic gneiss) in the CN catchment, and mica-schist with quartzite intrusions in the CT catchment (Veselý, 1994). The PL catchment has a maximum local relief of 288 m and its bedrock is formed of granite. All three catchments were covered with local glaciers during the last glacial period (Veselý, 1994). More than 90% of the catchments have 90160 years old forest cover, dominated by Norway spruce, with a minor contribution of mountain-ash and beech. For more morphological details on the lakes and their catchments see Table 1 and Veselý (1994).
SOIL CHEMISTRY
Soil samples were taken from all major organic and mineral horizons at sites representative for particular parts of the CT, CN, and PL catchments (11, 8, and 12 soil profiles, respectively) between September 1997 and May 2001. More details on heterogeneity in the soil distribution were obtained by grid samplings in regular 50 × 50 m (PL) and 75 × 75 m (CT) grids. The vertical and spatial heterogeneity of soil properties within a soil profile and across the whole catchment, respectively, was homogenised numerically to provide a catchment weighted mean (CWM) composition. This catchment weighting generates a single value for each parameter, representing a hypothetical situation in which all soils are uniformly distributed over the whole catchment. The physical and chemical characteristics of soils in the lake catchments were determined as described in detail by Kopácek et al. (2002b,c).
The CT catchment was found to be covered predominantly with ~0.5 m deep spodo-dystric cambisol (58% of area) and podzol (21% of area), and shallow (~0.2 m) undeveloped organic rich soil (17% of area). Wetland covered <3% of the CT catchment area. The dominant contribution of spodo-dystric cambisol and podzol, and negligible wetland areas were also evident in the CN catchment. The PL catchment area was covered with an undeveloped ~0.2 m deep organic rich soil (38% of area), and ~0.45 m deep podzol (29% of area) or spodo-dystric cambisol (27% of area). Wetland and bare rocks covered 1% and 5% of the catchment area, respectively.
Fine soil was sandy, with a low (14%) content of clay, and CWM soil pools were 225, 143, and 92 kg m2 in the
CT, CN, PL catchments, respectively. Soil pH was generally low, with the lowest pHCaCl2 values (2.53.3) in the humus
horizon. The CWM cation exchange capacity of the CT and CN soils was 104 and 123 meq kg1, respectively, and was
dominated by exchangeable Al3+ (62% and 55%). The CWM
base saturation of the CT and CN soils was 9% and 15%, respectively. It was primarily based on exchangeable Ca2+
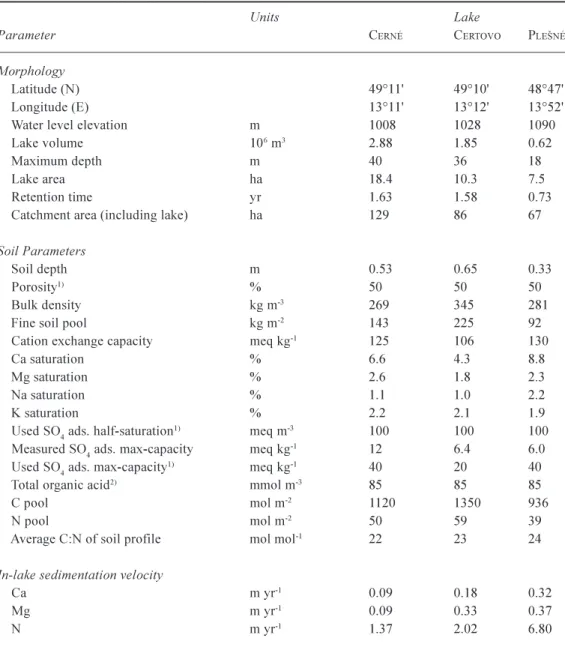
Table 1. Major morphological characteristics and measured or estimated soil parameters for the Bohemian
Forest lakes (Kopácek et al., 2001b,c,d) and their catchments (Kopácek et al., 2002b,c; Kana, personal communication).
Units Lake
Parameter CERNÉ CERTOVO PLENÉ
Morphology
Latitude (N) 49°11' 49°10' 48°47' Longitude (E) 13°11' 13°12' 13°52' Water level elevation m 1008 1028 1090 Lake volume 106 m3 2.88 1.85 0.62
Maximum depth m 40 36 18 Lake area ha 18.4 10.3 7.5 Retention time yr 1.63 1.58 0.73 Catchment area (including lake) ha 129 86 67
Soil Parameters
Soil depth m 0.53 0.65 0.33
Porosity1) % 50 50 50
Bulk density kg m-3 269 345 281
Fine soil pool kg m-2 143 225 92
Cation exchange capacity meq kg-1 125 106 130
Ca saturation % 6.6 4.3 8.8 Mg saturation % 2.6 1.8 2.3 Na saturation % 1.1 1.0 2.2 K saturation % 2.2 2.1 1.9 Used SO4 ads. half-saturation1) meq m-3 100 100 100
Measured SO4 ads. max-capacity meq kg-1 12 6.4 6.0
Used SO4 ads. max-capacity1) meq kg-1 40 20 40
Total organic acid2) mmol m-3 85 85 85
C pool mol m-2 1120 1350 936
N pool mol m-2 50 59 39
Average C:N of soil profile mol mol-1 22 23 24
In-lake sedimentation velocity
Ca m yr-1 0.09 0.18 0.32
Mg m yr-1 0.09 0.33 0.37
N m yr-1 1.37 2.02 6.80 1)Fitted in the model calibration procedure or set (porosity).
2)Estimated according to Hruka et al. (2002) for the measured soil organic content.
(~50%), and the contribution of Mg2+ and K+ was roughly
equal (~20%). The CWM cation exchange capacity of the PL soils was 129 meq kg1, 15% of which was base saturated,
and was dominated by exchangeable Al3+ (57%) and protons
(28%). The CWM carbon to nitrogen (C:N) ratio was 23, 22, and 24 for the whole CT, CN, and PL soil profiles, respectively, and varied between 23 and 33 in the forest floor. The CWM pools of C and N are given in Table 1.
The SO42 sorption characteristics of catchment soils were
determined in batch experiments according to Alewell
(1998). Sorption experiments were conducted with fresh samples at the original soil pH in the sulphate concentration range of 0-100 µmol ll.
LAKE WATER CHEMISTRY
The historical data (before 1984) on lake water concentrations come from Jírovec and Jírovcová (1937), Veselý (1994), and Procházková and Blaka (1999) and have been found to be reasonably reliable (Veselý and Majer,
1992; Procházková and Blaka, 1999). Lake water concentrations in the 19842001 period are from a regular monitoring programme (Veselý et al., 1998a,b; unpublished data). Data on terrestrial and in-lake sources and sinks of elements were based on their mass budgets in the 2000 hydrological year (Kopácek et al., 2001b,c,d). The concentration of organic acid anions (A´) in lake water was
assumed to be proportional to DOC (42 meq per mol of DOC; Kopácek, unpublished data). Since 1984, concentrations of total aluminium (AlT) were determined
by inductively coupled plasma atomic emission spectrometry. In parallel, Al fractionation according to Driscoll (1984) has been analysed in a filtrate (<0.4 µm pore size) regularly since 1993 to determine the proportion of dissolved inorganic Al (Ali), organically bound Al (Alo),
and particulate (>0.4 µm) Al (Alpart) in the total Al pool.
Equivalent concentrations of Ali (Alin+) were obtained from
their molar concentrations and the average charge of Al hydroxocomplexes (n) at the sample pH (Stumm and Morgan, 1981). In-lake concentrations of Ali before 1993
were estimated from the measured AlT concentrations,
assuming a similar AlT: Ali ratio as observed after 1993.
These AlT: Ali ratios were 1.04, 1.14, and 1.28 for CT, CN,
and PL Lake, respectively. The Alin+ concentrations before
1993 come from: 1984, Veselý et al. (1998b); and 1988 1989, Fott et al. (1994).
ATMOSPHERIC DEPOSITION
The 18602000 trends in bulk and throughfall deposition of SO42, NH4+, and NO3 come from Kopácek et al. (2001a).
The respective trends in the Cl deposition were assumed to
be proportional to the deposition of S, with the S : Cl ratios obtained for the bulk and throughfall deposition in the catchments studied. The trend in the bulk deposition of BC was based on (1) relationships between BC concentrations in precipitation in the Bohemian Forest (Hruka et al., 2000; Kopácek, unpublished data) and at long-term monitored sites in the Czech Republic, and (2) the emission rate of particulates from Czech industrial sources, taken from Yearbooks of the Czech Statistical Office (data after 1980) and was assumed to be proportional to the S emission before 1980. Then, the deposition trend of BC was calculated as the sum of background BC deposition (originating from agricultural sources) plus industrial BC deposition. The background bulk deposition of BC (~25 meq m2 yr1) was
estimated by extrapolating the relationship between bulk BC and S depositions (for the 19852000 period) to the S deposition equalling zero.
Throughfall deposition of Ca2+, Mg2+
, K+, and NH4+ is
usually affected strongly by canopy processes (e.g. Lovett, 1992; Dise et al., 1998). In the Bohemian Forest, the average ratio between concentrations of conservative ions (SO42,
Cl, and Na+) in throughfall and bulk deposition was ~1.7
in the 19972000 period (Kopácek et al., 2001b). This ratio was used to estimate the proportion of dry deposition of Ca2+, Mg2+ and K+ ions, concentrations of which were
increased in throughfall by canopy leaching. The same approach was used to estimate dry deposition of NH4+, which
was negatively affected by canopy interactions (its concentration was only 20% higher in throughfall than in bulk samples). Consequently, atmospheric inputs of BC and
0 50 100 150 200 250 300 1850 1900 1950 2000 2050 Year D epos iti on ( m eq m -2 yr -1 ) S S-bulk Cl BC 0 20 40 60 80 100 1850 1900 1950 2000 2050 Year
NO3 NO3-bulk NH4 NH4-bulk
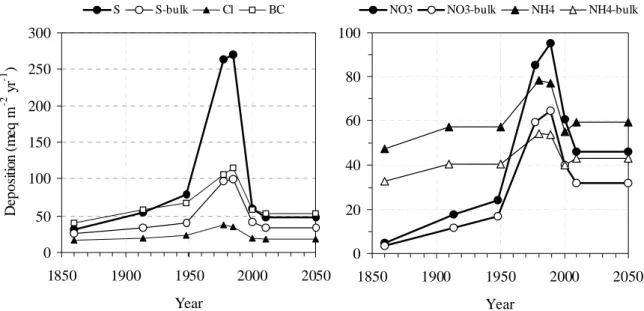
Fig. 1. Long-term trend in total (and bulk SO4-S and NO3-N) atmospheric deposition of major ions in the catchments of the
NH4+ into the forested parts of catchments were assumed to
be 1.7-fold higher than bulk deposition and this constant was used for the whole 18602000 period.
Two scenarios of element deposition were used for future (2000-2050) predictions: (1) Constant trends at 2000 deposition levels and (2) decreasing deposition until 2010 and then constant until 2050. The decrease in deposition of S and N compounds from 2000 to 2010 was assumed to be proportional to the decrease in their respective emission levels in the central European region (Germany, Poland, Czech Republic, and Slovakia) as required by the Gothenburg Protocol (UN-ECE, 1999). This simplified approach was used because atmospheric deposition of S and N compounds in central Europe originates predominantly (65% to 85%) from emissions within the region (Berge, 1997). The future changes in the Cl and BC deposition were
assumed to be proportional to changes in S deposition. Total chemical input into the catchment-lake ecosystem of the Bohemian Forest lakes from atmospheric sources was calculated from the estimated trends in throughfall and bulk deposition onto the respective areas of forest and bare surface (including the lake). This input was assumed to be roughly equal for all three lakes studied, because the morphological parameters of their catchments (Table 1), as well as precipitation chemistry at CT and PL Lakes (Kopácek
et al., 2001b,d), were similar. The resulting trends in total
atmospheric input of SO42, NO3, NH4+, Cl, and BC,
including their decrease according to the Gothenburg Protocol, are given in Fig. 1.
The average annual precipitation height and runoff was assumed to be 1.50 and 1.35 m, respectively, constant over the 18602050 period. These values were based on (1) the average throughfall deposition in the CT catchment in the 19922001 period, (2) long-term (19612001) precipitation in the central part of the Bohemian Forest (Churánov station, 49°04' N; 13°37' E; 1122 m a.s.l.), and (3) water balance (evaporation) calculated for the catchment-lake ecosystems studied (Kopácek et al., 2000, 2001b,c,d).
Results and discussion
MODEL CALIBRATION
The MAGIC (version 7) model by Cosby et al. (2001) was calibrated using measured deposition, long-term data on lake water chemistry from 1984 to 2000, and soil composition for the year 2000 (Table 1). The fixed parameters (Table 2) were selected or set empirically and calibrations at each site proceeded by the following sequential steps:
(1) Trends in the total deposition of SO42-, Cl-, NO3-, NH4+,
and BC into the catchments were applied as shown in Fig. 1. At the beginning of the Industrial Revolution, reduced nitrogen compounds dominated the sum of emitted and deposited S and N compounds in central Europe. Atmospheric inputs of SO42 and NO3 increased
steadily until the late 1950s and then, very sharply (3 to 4-fold) between the 1950s and 1980s to ~270 and ~95 meq m2 yr1, respectively. The increase in NH
4+
deposition was less than that of NO3, which led to a
change in deposition quality of dissolved inorganic nitrogen (DIN = NO3-N + NH4-N) from that dominated
by NH4-N to NO3-N domination since the 1960s (Fig.
1). Hence, the total DIN deposition and its NO3-N:NH4-N ratio increased 2 and 3-fold, respectively,
between the 1950s and 1980s.
In the 1990s, atmospheric inputs of S and DIN decreased by 80% and ~30% to 60 and ~110 meq m2 yr1, respectively, in the Bohemian Forest. Due to
this rapid decline, the 2010 target emissions of S and N compounds (Gothenburg Protocol; UN-ECE, 1999) were nearly reached in central Europe by the late 1990s, and only small additional decreases can be expected for SO42 and NO3 deposition (Fig. 1). In contrast, the
current emission rate of NH3 in central Europe is lower
than the 2010 target and the future scenario of NH4+
deposition is a slight increase. Around 2010, the SO42, NH4+, and NO3 deposition in the Bohemian
Forest will reach levels comparable to those in the
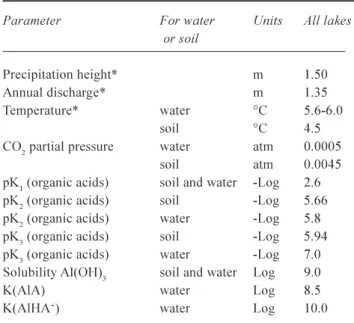
Table 2. Fixed parameters (measured* or estimated) for the
Bohemian Forest lakes and catchment soils used in calibration of MAGIC 7.
Parameter For water Units All lakes
or soil
Precipitation height* m 1.50 Annual discharge* m 1.35 Temperature* water °C 5.6-6.0
soil °C 4.5 CO2 partial pressure water atm 0.0005
soil atm 0.0045 pK1 (organic acids) soil and water -Log 2.6
pK2 (organic acids) soil -Log 5.66
pK2 (organic acids) water -Log 5.8
pK3 (organic acids) soil -Log 5.94
pK3 (organic acids) water -Log 7.0
Solubility Al(OH)3 soil and water Log 9.0
K(AlA) water Log 8.5 K(AlHA+) water Log 10.0
1890s, the first half of the 20th century, and the 1950s,
respectively (Fig. 1).
(2) Net annual retention of Ca, Mg, and N in the lakes (Table 1) was estimated from their concentrations in surface sediments and sedimentation rates (Kopácek et al., 2001b,c,d), and were held constant for the whole period. (3) The measured SO42 adsorption half saturation and
maximum adsorption capacity varied from 2000 to 2200 meq m3 and from 6 to 12 meq kg1, respectively (Kana,
personal communication). These adsorption maxima were too low for the model to predict properly the observed delay between SO42 deposition and in-lake
concentrations during both the acidification advance and retreat. Consequently, in the calibration procedure, soil sulphate chemistry (as well as other ions) was fitted such that modelled concentration equalled the measured concentration in lake water during the 19842000 period. The fitted values of SO42 maximum adsorption
capacity, which simulated, reasonably, the observed trends in lake water chemistry, were 3 to 6-fold higher than the measured adsorption data (20-40 meq kg1).
This pattern suggests other effective mechanisms immobilising S in the forest floor organic matter (Novák
et al., 1996; Torssander and Mörth, 1998) or in basic
aluminium sulphates(Nordstrom, 1982), which paralleled the physical adsorption of SO42 on Fe and
Al oxides.
The measured in-lake reduction of SO42 varied
between 143 and 214 meq m2 yr1 (on a lake surface
area basis), representing 13% of the total (terrestrial and atmospheric) SO42- input in CT and PL Lakes and
22% in CN Lake in 2000 (Kopácek et al., 2001b,c,d). These values were too high to model the SO42
concentration maxima in the 1980s satisfactorily. Alternatively, a ~5% in-lake reduction of SO42 was
estimated from SO42 loading and mass transfer
coefficient of 0.54 m yr1 according to Kelly et al.
(1987). The best agreement between the measured and simulated concentrations was obtained with a 5% in-lake reduction of SO42 in PL and CT Lakes and a 20%
reduction in CN Lake. The lower in-lake reduction of SO42 (both measured and simulated) in PL and CT
Lakes was due to anoxic conditions in their hypolimnion. Sulphate reduction in the sediment is the most effective in-lake sink of SO42 when water above
the sediment is under oxic conditions (Kelly and Rudd, 1984). Under anoxia, sulphate concentrations decreased above the bottom of CT and PL Lakes (Kopácek et al., 2001b,d), which limited the SO42- diffusion into
sediments and, consequently, its more effective reduction.
(4) Nitrogen leaching to surface water depends on the difference between N-input via deposition and its uptake by plants, denitrification loss, and net immobilisation in the soil (Cosby et al., 2001). Net immobilisation of N in the soil is assumed to be governed in the model by the C : N ratio. The estimated relatively small change in the soil C:N ratios from ~25 to 2224 in the 1930-2000 period (Kopácek et al., 2001a), however, did not allow the model to simulate the observed dramatic changes in lake water NO3 concentrations. There are
no data available to evaluate historical changes in the ability of terrestrial parts of the Bohemian Forest catchment-lake ecosystems to immobilise or lose N (e.g. changes in plant uptake of N or mineralisation rate of soil organic N pools). Hence, net retention of DIN in the catchment was set empirically such that modelled NO3 concentrations equalled the measured
concentrations throughout the study period (Fig. 2). For the 20002050 period, the net N retention in the catchment was assumed to be the same as in 2000. (5) Weathering rates, cation-exchange selectivity
coefficients for base cations, and the original base saturation of soils were determined by a trial-and-error procedure such that the modelled pools and
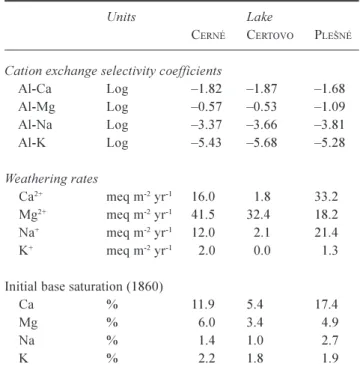
Table 3. Calibrated parameters for the Bohemian Forest lakes
obtained from MAGIC 7.
Units Lake
CERNÉ CERTOVO PLENÉ
Cation exchange selectivity coefficients
Al-Ca Log 1.82 1.87 1.68 Al-Mg Log 0.57 0.53 1.09 Al-Na Log 3.37 3.66 3.81 Al-K Log 5.43 5.68 5.28 Weathering rates Ca2+ meq m-2 yr-1 16.0 1.8 33.2 Mg2+ meq m-2 yr-1 41.5 32.4 18.2 Na+ meq m-2 yr-1 12.0 2.1 21.4 K+ meq m-2 yr-1 2.0 0.0 1.3
Initial base saturation (1860)
Ca % 11.9 5.4 17.4 Mg % 6.0 3.4 4.9 Na % 1.4 1.0 2.7 K % 2.2 1.8 1.9
concentrations equalled the measured soil exchange pools and lake chemistry concentrations of each base cation for the year 2000. This step was performed using an automated optimisation routine and the results are given in Table 3. Because the vegetation uptake of BC was set equal to zero in the optimisation, the resulting weathering rates represented a net difference between the BC supply by the real weathering processes and the BC sink by vegetation uptake.
(6) Fixed parameters (Table 2): Dissociation constants of tri-protic organic acids and Al(OH)3 solubility were
selected within widely used ranges (e.g. Sullivan et al., 1996; Wright et al., 1998) and further fitted in the MAGIC calibration procedure. Stability constants of organic-Al complexes (K(AlA) and K(AlHA+)) were
set empirically within the set of published data (e.g. Browne and Driscoll, 1993; Nordstrom and Howard, 1996), such that the modelled concentrations equalled the measured concentrations of Alin+ and Alo in lake
water. Concentrations of A were adjusted by optimising
the pK values of the tri-protic organic acid such that modelled concentrations equalled the measured concentrations.
MODELLING OF NITROGEN DYNAMICS
The observed lake water concentrations of NO3 in 1936
were below the detection limit of the analytical method used at the time (< 2 µeq l1) (Jírovec and Jírovcová, 1937; Veselý
and Majer, 1992). The elevated NO3 concentrations in the
beginning of 1960s (Procházková and Blaka, 1999) were determined by a more reliable method, based on the colorimetric determination of NO2 after NO3 reduction with
alkaline hydrazine (Procházková, 1959). The changes in these values suggest that catchments of the Bohemian Forest lakes started to leach NO3 between the 1930s and the late
1950s, in the period of sharp increase in NO3 deposition
(Fig. 1). Consequently, the net retention of DIN was set equal to its deposition in the 18601900 period and slightly lower than its deposition (to fit the observations from the 1930s) in the 19001950 period (Figs. 2 and 3). For these two periods, it was assumed that the terrestrial ecosystem was adapted to a relatively high and stable NH4+ deposition,
for more than a hundred years before the 1950s (Fig. 1). The hypothesis is that the terrestrial ecosystems were N-limited or in steady state conditions in respect of DIN deposition, which was dominated by NH4+ and around the
empirical threshold of 10 kg ha1 yr1,below which NO 3
leaching from European forest soils is usually low (e.g. Dise
et al., 1998).
The catchments studied were unable to retain and assimilate the rapidly increasing NO3 input already present
in 1960s, which resulted in the elevated terrestrial export of NO3 (Fig. 3). This change was probably not associated with
any significant change in the soil C:N ratios (Kopácek et
al., 2001a) and more likely reflected a simple dose-response
function. Nitrate is a more mobile ion than NH4+ and its
relatively short residence time in the catchments studied (shallow soils and steep terrain) probably disables its assimilation. However, the decreasing ability of the catchments to assimilate N (Kopácek et al., 2002a) suggests that this simple dose-response function changed with time. While the ecosystems assimilated ~70 meq m2 yr1 of DIN
at the beginning of 20th century, the DIN assimilation was substantially lower (<20 meq m2 yr1) in the late 1990s.
The PL catchment still assimilated ~16% of the deposited DIN but the CT catchment exported nearly all deposited DIN, and the CN catchment produced ~28% more DIN than it received by atmospheric input (Kopácek et al., 2001b,c,d). This suggests that the net terrestrial production of NO3 was
higher than the retention of atmospheric NH4+ in the CN
catchment, probably due to additional NO3- production from
the pool of soil organic N.
In the model, it is assumed that the elevated deposition of NO3 after the 1950s (Fig. 1) led to a gradual transition of
0 50 100 150 200 1850 1900 1950 2000 2050 Year D IN d epos it io n a nd n et r et en ti o n ( m eq m -2 yr -1 ) DIN-dep. CN-ret. CT-ret. PL-ret.
Fig. 2. Trends in atmospheric deposition of dissolved inorganic
nitrogen (NO3-N + NH4-N; DIN-dep.) and the assumed DIN
retention in the catchments of Cerné, Certovo, and Plené Lakes (CN-ret., CT-ret., and PL-ret., respectively).
-60 -30 0 30 60 AN C -Gr an (µ eq l -1 ) CN 0 50 100 150 200 SO 4 2- (µ eq l -1 ) CN 0 10 20 30 Cl - (µ eq l -1 ) CN CT PL CT PL CT PL 0 20 40 60 80 100 1850 1900 1950 2000 2050 Year NO 3 - (µ eq l -1 ) CN 1850 1900 1950 2000 2050 Year CT 1850 1900 1950 2000 2050 Year PL
Fig. 3. Measured (open circles) and modelled (lines) trends in major anions in the Bohemian Forest Lakes. Forecasts are based on the 2000
deposition level (thin line) and the decreased S and N deposition proportionally to their emission rate in central Europe according to Gothenburg Protocol (UN-ECE, 1999) (heavy line). ANC-Gran represents measured and/or modelled Gran alkalinity. Lake abbreviations refer to: CN, Cerné; CT, Certovo; and PL, Plené.
the forest ecosystems from N-limitation to N-saturation and to a decreasing ability to retain N (Fig. 2). The elevated terrestrial NO3 export may be associated with a decreased
ability of the catchments to assimilate N, e.g. due to
unfavourable soil conditions for forest growth (extremely low Ca : Al ratios in soil solutions; see later), or with changes in the mineralisation rate of soil organic N due to elevated DIN deposition, as has been observed elsewhere (e.g.
Gundersen et al., 1998a). Thus, the empirical DIN retention within the Bohemian Forest soils (Fig. 2) represents a net difference between the potentially reduced sinks and the elevated internal sources of nitrogen.
The NO3 concentrations in the Bohemian Forest lakes
decreased more than the DIN deposition during the 1990s. A similar response of ecosystem export of NO3 to declining
DIN deposition was observed in other mountain areas of the Czech Republic (Veselý et al., 2002). To simulate the current lake water concentrations of NO3, a slight recovery
in the ecosystems ability to retain N was expected in response to the decline in DIN deposition (Fig. 2).
The prediction of lake water NO3 concentrations was set
to the current N cycling situation within the ecosystems and was based on the assumption that the ecosystem N retention characteristic would not change (Fig. 2). However, any future changes in the ecosystem ability to immobilise N (e.g. in the vigour of forest microbial activity) can bias the forecasts given in Fig. 3 (see also Norton and Veselý, 2003). The current characteristics of NO3 leaching from the
Bohemian Forest soils fit well the empirical relationships (e.g. Dise and Wright, 1995; Gundersen et al., 1998a,b) which link the N leaching from European sites to N deposition, soil C : N ratios, and pH (Kopácek et al., 2001a). Nevertheless, none of these factors can explain fully the observed differences between the catchments and historical changes in N export from the Bohemian Forest soils during the periods of increasing or decreasing DIN deposition. Modelling of these trends is based here on empirical experience and not on causalities and processes. Although this approach enables a detailed reconstruction of lake water chemistry, it can predict the future changes with only limited significance until the processes involved in N cycling are better understood.
MODELLED V. OBSERVED LAKE WATER COMPOSITION
Observed and modelled lake water concentrations of major anions are shown in Fig. 3. Concentrations of SO42 and Cl
paralleled deposition trends, increasing from their respective background concentrations of 1823 and 12 µeq l1 to
maxima in the 1980s, and then decreasing to the current concentrations of 8498 and 1318 µeq l1. The modelled
trends predicted an additional sharp decrease in SO42
concentrations by the late 2010s (Fig. 3). With no additional reduction in S and Cl emission in central Europe after 2010, concentrations of Cl ions will stabilise at ~13 µeq l1, and
SO42 concentrations will decrease slowly to 3237 µeq l1
over the next 40 years, approaching new steady state conditions in the soil S pool. Simulated trends in SO42 and
Cl concentrations agree reasonably well with observations
both during the acidification advance and retreat.
Simulated trends in ANC (Gran alkalinity) fit the observations reasonably and follow inverse pattern to the trends in strong acid anions (Fig. 3). The modelled lake water ANC values vary between 17 and 49 µeq ll in 1860.
Compared to the current situation, the model predicts a relatively rapid additional increase in ANC by the late 2010s, after which ANC concentrations level off at substantially lower than pre-acidification levels. According to these predictions, positive ANC can be expected only in the PL and CN lakes (Fig. 3).
The changes in concentration of strong acid anions and ANC are partly compensated for by changes in BC, H+, and
Alin+ concentrations (Fig. 4). All the modelled cation
concentrations fit the observations during the acidification retreat. The only reliable historical results on cation analyses are those with colorimetric pH determinations (Procházková and Blaka, 1999). With the exception of slightly higher measured pH in CN Lake in 1936 and 1947, MAGIC also simulates, reasonably, the in-lake pH decline during the acidification progress. The simulated pre-acidification pH values vary between 6.0 and 6.7 in 1860. These values are surprisingly more than one pH unit higher than diatom-inferred pH, which indicates a pre-industrial pH of around 4.7 in CT Lake (Veselý et al., 1993) and 5.05.3 in CN lake (Schmidt et al., 1993). Such a difference is atypically high compared to other sites where the MAGIC and diatom-inferred pH trends exhibited comparable values (Cumming
et al., 1992; Sullivan et al., 1996).
This discrepancy indicates that the processes controlling acidity in small lakes may be more complex than previously thought. The diatom-inferred pH of the lakes is based almost entirely on non-planktonic (benthic, epilithic, periphytic and metaphytic) species. The actual lake water pH may be underestimated because: (1) Benthic or epilithic diatoms could grow in tributaries (or at their mouths), which are generally more acidic and have higher P concentrations than lake water (e.g. Kopácek et al., 2001b,c,d). (2) Periphytic or metaphytic diatoms could grow on macrophytes in littoral zones, also affected by more acidified tributaries. (3) In small lakes, with a high shoreline to area ratio, these diatom sources are relatively more important for the total in-lake diatom production than in larger lakes. Moreover, these diatoms can be more easily transported secondarily to the sediments in the deepest parts of small lakes. Such processes could contribute significantly to the observed prevalence of acidobiontic or acidophilous diatoms in the sediment cores and, therefore, to the underestimation of inferred pH of the lakes studied.
60 90 120 150 180 BC ( µ eq l -1 ) CN CT PL 4.0 5.0 6.0 7.0 pH CN CT PL 0 40 80 120 Al i n+ (µ eq l -1 ) CN CT PL 0 10 20 30 40 1850 1900 1950 2000 2050 Year Di ss o lv ed Al ( µ m o l l -1 ) CN 1850 1900 1950 2000 2050 Year CT 1850 1900 1950 2000 2050 Year PL
Fig. 4. Measured (open circles) and modelled (lines) trends in major cations in the Bohemian Forest Lakes. Forecasts are based on the 2000
deposition level (thin line) and the decreased S and N deposition proportionally to their emission rate in central Europe according to Gothenburg Protocol (UN-ECE, 1999) (heavy line). Lake abbreviations refer to: CN, Cerné; CT, Certovo; and PL, Plené.
and Alo) and Alin+ were <1 µmol l1 and <2 µeq l1,
respectively, before 1950 and reached their maxima of 27 40 µmol l1 and 75111 µeq l1 in the mid-1980s (Fig. 4).
The current Al concentrations have declined ~5070% compared to these maxima. The model predicts a further
sharp decline in Al concentrations by 2010, after which the Alin+ concentrations will be comparable to those in the late
1950s (<10 µeq l1). Such a decline in concentrations of the
most important toxicant in lake water is promising for the biological recovery of the lakes studied. Biological recovery
of the lakes, however, is delayed substantially compared to the chemical reversal. Up to the present, increasing numbers of only Ceriodaphnia quadrangula in CN Lake and planktonic rotifers in PL Lake have been observed (Vrba et
al., 2003).
Despite the relatively advanced chemical reversal from
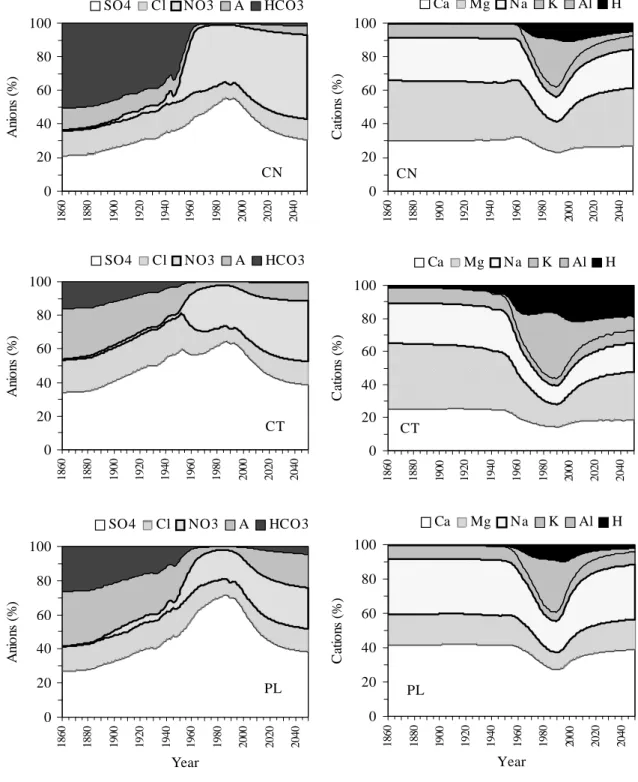
acidification, all the lakes are still acidic. The changes in relative ionic composition of the lakes (Fig. 5) suggest that bicarbonate was depleted in CN and PL Lakes before the 1960s and in CT Lake even a decade earlier. During the acidification peak, SO42 dominated (5570%) the anionic
pool and Alin+ was the major cation (3040% of the sum of
0 20 40 60 80 100 1860 1880 1900 1920 1940 1960 1980 2000 2020 2040 Ca tio ns ( % ) Ca Mg Na K Al H CN 0 20 40 60 80 100 1 860 1880 1900 1920 1940 1960 1980 2000 2020 2040 Ca tio ns ( % ) Ca Mg Na K Al H CT 0 20 40 60 80 100 1860 1880 1900 1920 1940 1960 1980 2000 2020 2040 Year Ca tio ns ( % ) Ca Mg Na K Al H PL 0 20 40 60 80 100 1860 1880 1900 1920 1940 1960 1980 2000 2020 2040 An io ns ( % )
SO4 Cl NO3 A HCO3
CN 0 20 40 60 80 100 1 860 1880 1900 1920 1940 1960 1980 2000 2020 2040 An io ns ( % )
SO4 Cl NO3 A HCO3
CT 0 20 40 60 80 100 1860 1880 1900 1920 1940 1960 1980 2000 2020 2040 Year An io ns ( % )
SO4 Cl NO3 A HCO3
PL
Fig. 5. Relative composition of water in the Bohemian Forest Lakes as simulated by MAGIC model. The 20002050 forecasts is based on S and
N deposition level proportional to central Europe emission rate according to Gothenburg Protocol (UN-ECE, 1999). Lake abbreviations refer to: CN, Cerné; CT, Certovo; and PL, Plené.
cations). The modelled changes predict the increasing importance of NO3 to become the dominant anion in CN
and CT Lakes around 2050, and a partial recovery of the bicarbonate buffering system in CN and PL Lakes. These changes will be accompanied by a rapidly decreasing importance in the Alin+ contribution and an increasing
contribution of BC to the cationic pool. A pronounced increase in pH will probably occur in PL Lake only (Figs. 3 and 4).
TRENDS IN SOIL CHEMISTRY
Among the lakes studied, the chemical composition of soil and soil solutions differ significantly (Fig. 6). The modelled pre-acidification soil base saturation is highest (27%) in PL Lake and lowest (11%) in CT Lake. Similarly, loss of BC from the soil cation-exchange sites is most pronounced in PL Lake while relatively flat in CT Lake. Both the current and Gothenburg scenarios of the future emission rates of S and N compounds in central Europe result in similar trends in base saturation of the Bohemian Forest soils (Fig. 6). These predictions suggest a gradual accumulation of BC in
the CN and PL soils, resulting in a slow increase in their base saturation. Even in 2050, however, base saturation of the CN and PL soils will be ~40% lower than levels in 1860. No increase in base saturation is predicted for the CT soils (Fig. 6), suggesting that the decreases in emissions expected by the Gothenburg protocol will only stop the depletion of the exchangeable BC pool, but will be insufficient for its recovery. Similar results are also evident from other very strongly acidified forest sites (e.g., Hruka et al., 2002).
A low molar Ca to Al ratio in soil solutions (Ca : Al <1) is another ecologically important parameter, indicating possible adverse impacts of soil chemistry on tree growth and tissue nutrient concentrations (e.g. Puhe and Ulrich, 2001). The modelled Ca : Al values are >1 only in the CN and PL soils and only until the 1950s and 1970s, respectively, while lower values obtain for CT soils throughout the whole 18602050 period (Fig. 6). Similarly to base saturation of soils, the trend in soil solution Ca : Al ratio, most pronounced in the PL catchment and flattest in the CT catchment, exhibits signs of a future increase only in the PL and CN soils. 5 10 15 20 25 30 B ase sa tu ra ti o n ( % ) CN CT PL 1850 1900 1950 2000 2050 Year CT 1850 1900 1950 2000 2050 Year PL 0.0 0.5 1.0 1.5 2.0 1850 1900 1950 2000 2050 Year C a:A l m o la r r at io CN
Fig. 6. Measured (open circles) and modelled (lines) trends in soil chemistry in the Bohemian Forest Lakes. Forecasts are based on the 2000
deposition level (thin line) and the decreased S and N deposition proportionally to their emission rate in central Europe according to Gothenburg Protocol (UN-ECE, 1999) (heavy line). Black circles in lower panel represent the Ca:Al ratios in lake tributaries (annual discharge weighted means). Lake abbreviations refer to: CN, Cerné; CT, Certovo; and PL, Plené.
Soil solutions were not analysed in this study. Instead, the modelled data have been compared with annual discharge weighted mean values of Ca : Al ratios in the lake tributaries (Kopácek et al., 2001b,c,d). These values (black points in Fig. 6), are higher than the Ca:Al ratios in soil solutions due to a partial contribution of overflow to the runoff without percolating through the mineral soil horizons. Even the Ca:Al ratios in lake tributaries, however, show a pattern similar to the modelled data, being higher in the CN and PL than in CT tributaries.
According to the MAGIC simulation for the next five decades, the desirable reversal of Ca : Al ratios in soil solutions toward ~1 can be expected only in the PL catchment (situated on granite) but will remain < 0.5 in the CT and CN catchments, underlain with mica schist. This difference is due to (i) the lower depletion of the soil exchangeable Ca pools in the PL than CN and CT catchments (Table 1), (ii) the two-fold higher content of Ca in granite than in mica schist (0.11 vs. ~0.06 mol kg-1; Kopácek et al.,
2002b,c) and (iii) significantly higher repletion of the soil pools of Ca by weathering in the PL catchment (Table 3).
LAKE TO LAKE VARIATIONS IN THE REGION
Atmospheric deposition of S and oxidised N compounds (Fig. 1) is the major driving force governing the in-lake concentrations of major ions, which exhibit similar trends in all lakes (Figs. 3 and 4). Despite the same deposition history and comparable morphological characteristics of the ecosystems studied (Table 1), the chemical composition of lake waters differs significantly. These differences are associated predominantly with bedrock composition, land use history (affecting both soil and water composition), and in-lake processes (associated with nutrient loading) as follows: (1) Soils, weathering, and land-use history Concentrations of SO42 and NO3 differ among the lakes studied, but lakes
with lower NO3- concentrations have higher SO42, which
results in comparable concentrations of strong acid anions (e.g. 255275 µeq l1 during the acidification peak, Fig. 3).
The ecosystems differ in the way this acidity is compensated for with cations. While the responses of the CN and PL catchment-lake ecosystems are comparable despite the different bedrock, CT Lake (with bedrock similar to CN Lake) is most acidified, has lowest concentrations of BC, and highest Alin+ concentrations (Fig. 4). Moreover, the
modelled pH exhibits a continuously decreasing trend in CT Lake from the late 19th century to the 1980s (Fig. 4). The different response of the CT ecosystem to neutralise acid loads resulted from a substantially lower base saturation of soils (Fig. 6).
The difference in soil composition between the geographically adjacent CT and CN Lakes may well result from lower weathering rates and different land-use history. The CT catchment was deforested more than the CN catchment in the first half of the 18th century and was used as pasture for about 100 years. Pasturing and burning of bushes probably contributed to a continual decrease in the base saturation of the catchment soils. Another depletion of the CT soil pools of BC was probably associated with the subsequent draining and re-afforestation of the CT catchment with spruce in the middle 19th century. This process led to the accumulation of BC from the soil exchangeable pools in the rapidly growing forest. Moreover, repletion of the soil BC pool from weathering was less effective in the CT than the CN catchment, because part of the CT bedrock is quartzite.
The less rapid acidification-derived changes in CN than in CT Lake could also be attributed partly to return-water pumping by a power station into CN Lake during the 1930 1975 period (water from the lake was partly mixed with less acidified river water). However, the similar patterns of the modelled and measured pH trends in CN and unaffected PL Lake (Fig. 4) suggest that this land-use aspect had probably only a limited effect on the acid-base chemistry of CN Lake.
(2) In-lake processes The most pronounced difference in the chemistry of the lakes studied was associated with NO3
concentration, which was lowest in PL Lake (Fig. 3). Part of this difference was due to the higher ability of the PL catchment to assimilate N. Consequently, PL Lake had a lower input of DIN compared to the other two lakes. In the 2000 hydrological year, the total DIN input (via tributaries and direct atmospheric deposition) was 780 and 1030 meq m2 yr1 (given on a lake surface area basis) in PL and CN
Lakes, respectively (Kopácek et al., 2001c,d). In-lake removal of NO3, calculated according to Kelly et al. (1987)
with a mass transfer coefficient for colder lakes (5 m yr1;
Curtis et al., 1998), suggests a 2935% internal reduction of these DIN loads. The primary mechanism of this DIN reduction is NO3 diffusion into the sediments followed by
denitrification under anoxic conditions. The measured internal reduction of DIN was 28%, 33%, and 50% in CN, CT, and PL Lakes, respectively, in the 2000 hydrological year (Kopácek et al., 2001b,c,d). While the empirical and estimated values are well comparable in CN and CT Lakes, a substantially higher in-lake reduction in the DIN loads was observed in PL Lake. The latter lake received ~five-fold higher loads of phosphorus (predominantly in the form of soluble reactive P), leading to higher primary production. The resulting assimilation of N by algae and their
sedimentation represents another significant sink for DIN in PL Lake, which is also evident from the higher N sedimentation rate in this lake (Table 1).
Conclusions
The chemistry of Bohemian Forest lakes has exhibited significant changes toward chemical reversal from atmospheric acidification since the late 1980s. The MAGIC model forecasts further advancement in this process for about the next two decades. Sulphate leaching and BC export from soils should decline to their levels at the beginning of the 20th century, and Alin+ concentrations in lake water to
their levels in the 1950s. Only in two of the three lakes studied will these changes be sufficient for the re-establishment of the bicarbonate buffering system and pH increase over the unit of 5. These lakes (CN and PL) have less depleted soil BC pools, which can partly recover in the 20002050 period. In contrast, the more acidified CT catchment-lake ecosystem will recover more slowly. Until 2050 (and probably even several decades longer), soil base saturation will not increase in the CT catchment and the lake water bicarbonate buffering system will not be re-established.
While the measured trends in pH and ANC, SO42, Cl,
Alin+, and BC concentrations are simulated reasonably by
MAGIC 7, historical simulations of NO3 are speculative
due to the changing ability of the terrestrial parts of ecosystems studied to assimilate nitrogen, which is not associated with significant changes in the soil C : N ratios. Without more detailed knowledge of current N-cycling within the forest soils and potential mechanisms that can affect the terrestrial immobilisation of N, future predictions of NO3 leaching are hypothetical. Undoubtedly, NO3 will
become the dominant strong acid anion in the Bohemian Forest lakes over the next five decades and the major carrier of BC from soils. Climatic, chemical or physiological (e.g. forest die-off) changes, however, can affect the future terrestrial NO3 export significantly and invalidate the
prognoses based on the current situation.
Acknowledgement
The primary data on soil, water, and deposition chemistry were collected within projects supported by the Grant Agency of the Czech Republic (project No 206/00/0063), Institutional Research Plan ASCR No. Z 6017912, and MSM 123100004, and were evaluated within and in co-operation with the Environment Projects of European Commission: RECOVER:2010 (Project No. EVK1-CT-1999-00018) and EMERGE (EVK1-CT-1999-00032), respectively.
References
Alewell, C., 1998. Investigating sulphate sorption and desorption of acid forest soils with special consideration of soil structure.
Z. Pflanzenernähr. Bodenk., 161, 7380.
Alewell, C., Manderscheid, B., Meesenburg, H. and Bittersohl, J., 2000. Is acidification still an ecological threat? Nature, 407, 856857.
Berge, E., 1997. Transboundary air pollution in Europe, Part 1, EMEP MSC-W Report 1/97, Norwegian Meteorological Institute, Oslo, Norway. 108pp .
Barrett, K., Schaug, J., Bartonova, A., Semb, A., Hjellbrekke, A.G. and Hanssen, J.E., 2000. A contribution from CCC to the
re-evaluation of the observed trends in sulphur and nitrogen in Europe 1978-1998: CCC Report 7/2000, Norwegian Institute
for Air Research, Kjeller, Norway. 205pp .
Browne, B.A. and Driscoll, C.T., 1993. pH-dependent binding of aluminum by a fulvic acid. Environ. Sci. Technol., 27, 915 922.
Cosby, B.J., Wright, R.F., Hornberger, G.M. and Galloway, J.N., 1985. Modelling the effects of acid deposition: estimation of long term water quality responses in a small forested catchment.
Water Resour. Res., 21, 15911601.
Cosby, B.J., Ferrier, R.C., Jenkins, A., Emmett, B.A., Wright, R.F. and Tietema, A., 1997. Modelling the ecosystem effects of nitrogen deposition at the catchment scale: model of ecosystem retention and loss of inorganic nitrogen (MERLIN). Hydrol.
Earth Syst. Sci., 1, 137158.
Cosby, B.J., Ferrier, R.C., Jenkins, A. and Wright, R.F., 2001. Modelling the effects of acid deposition: refinements, adjustments and inclusion of nitrogen dynamics in the MAGIC model. Hydrol. Earth Syst. Sci., 5, 499517.
Cumming, B.F., Smol, J.P., Kingston, J.C., Charles, D.F., Birks, H.J.B., Camburn, K.E., Dixit, S.S., Uutala, A.J. and Selle, A.R., 1992. How much acidification has occurred in Adirondack region lakes (New York, USA) since preindustrial times. Can.
J. Fisheries Aquat. Sci. 49, 128141.
Curtis, C.J., Allott, T.E.H., Reynolds, B. and Harriman, R., 1998. The prediction of nitrate leaching with the first-order acidity balance (FAB) model for upland catchment in Great Britain.
Water Air Soil Pollut., 105, 205215.
Dise, N.B. and Wright, R.F., 1995. Nitrogen leaching from European forests in relation to nitrogen deposition. Forest Ecol.
Manage., 71, 153161.
Dise, N.B., Matzer, E. and Gundersen, P., 1998. Synthesis of nitrogen pools and fluxes from European forest ecosystems.
Water Air Soil Pollut., 105, 143154.
Driscoll, C. T., 1984. A procedure for the fractionation of aqueous aluminum in dilute acidic waters. Int. J. Environ. Anal. Chem.,
16, 267284.
Evans, C.D., Cullen, J.M., Alewell, C., Kopácek, J., Marchetto, A., Moldan, F., Prechtel, A., Rogora, M., Veselý, J. and Wright, R., 2001. Recovery from acidification in European surface waters. Hydrol. Earth Syst. Sci., 5, 283297.
Fott, J., Praáková, M., Stuchlík, E. and Stuchlíková, Z., 1994. Acidification of lakes in Sumava (Bohemia) and in the Tatra Mountains (Slovakia). Hydrobiologia, 274, 3747.
Gundersen, P., Emmett, B.A., Kjonaas, O.J., Koopmans, C.J. and Tietema, A., 1998a. Impact of nitrogen deposition on nitrogen cycling in forests: a synthesis of NITREX data. Forest Ecol.
Manage., 71, 143151.
Gundersen, P., Callesen, I. and de Vries, W., 1998b. Nitrate leaching in forest ecosystems is related to forest floor C/N ratios.
Hruka, J., Kopácek, J., Hlavatý, T. and Hoek, J., 2000. Trend of atmospheric deposition of acidifying compounds at Certovo Lake, south-western Czech Republic (1992-1999). Silva
Gabreta, 4, 7186.
Hruka, J., Moldan, F. and Krám, P., 2002. Recovery from acidification in central Europe observed and predicted changes of soil and streamwater chemistry in the Lysina catchment, Czech Republic. Environ. Pollut., 120, 261274.
Jírovec, O. and Jírovcová, M., 1937. Chemistry of the Bohemian Forest lakes. Vestník k. c. spol. nauk, Tr. II (13), 121 (in Czech). Kelly, C.A. and Rudd, J.W.M., 1984. Epilimnetic sulfate reduction and its relationship to lake acidification. Biogeochemistry, 1, 6377.
Kelly, C.A., Rudd, J.W.M., Hesslein, R.H., Schindler, D.W., Dillon, P.J., Driscoll, C.T., Gherini, S.A. and Hecky, R.E., 1987. Prediction of biological acid neutralisation in acid-sensitive lakes. Biogeochemistry, 3, 129140.
Kopácek, J., Hejzlar, J., Stuchlík, E., Fott, J. and Veselý, J., 1998. Reversibility of acidification of mountain lakes after reduction in nitrogen and sulphur emissions in Central Europe. Limnol.
Oceanogr., 43, 357361.
Kopácek, J., Veselý, J. and Stuchlík, E., 2001a. Sulphur and nitrogen fluxes and budgets in the Bohemian Forest and Tatra Mountains during the Industrial Revolution (18502000).
Hydrol. Earth Syst. Sci., 5, 391405.
Kopácek, J., Hejzlar, J., Kana, J. and Porcal, P., 2001b. Element budgets in three Bohemian Forest lakes and their watersheds in the 2000 hydrological year: I. Certovo Lake. Silva Gabreta, 6, 3552.
Kopácek, J., Hejzlar, J., Kana, J., Porcal, P., Penáková, P. and Vrba, J., 2001c. Element budgets in three Bohemian Forest lakes and their watersheds in the 2000 hydrological year: II. Cerné Lake. Silva Gabreta, 6, 5372.
Kopácek, J., Hejzlar, J. Kana, J. and Porcal, P., 2001d. Element budgets in three Bohemian Forest lakes and their watersheds in the 2000 hydrological year: III. Plené Lake. Silva Gabreta, 6, 7386.
Kopácek, J., Stuchlík, E., Veselý, J., Schaumburg, J., Anderson, I.C., Fott, J., Hejzlar, J. and Vrba, J., 2002a. Hysteresis in reversal of Central European mountain lakes from atmospheric acidification. Water Air Soil Pollut: Focus 2, 91114. Kopácek, J., Kana, J., Santrucková, H., Porcal, P., Hejzlar, J., Picek,
T. and Veselý, J., 2002b.Physical, chemical, and biochemical characteristics of soils in watersheds of the Bohemian Forest lakes: I. Plené Lake. Silva Gabreta, 8, 4362.
Kopácek, J., Kana, J., Santrucková, H., Porcal, P., Hejzlar, J., Picek,
T., Simek, M. and Veselý, J., 2002c.Physical, chemical, and biochemical characteristics of soils in watersheds of the Bohemian Forest lakes: II. Certovo and Cerné Lakes. Silva
Gabreta, 8, 6393.
Kopácek, J., Cosby, B.J., Majer, V., Stuchlík, E. and Veselý, J., 2003. Modelling reversibility of Central European mountain lakes from acidification: Part II The Tatra Mountains. Hydrol.
Earth Syst. Sci., 7, 510524.
Lovett, G.M., 1992. Atmospheric deposition and canopy interactions of nitrogen. In: Atmospheric Deposition and Forest
Nutrient Cycling, D.W. Johnson and S.E. Lindberg (Eds.),
Ecological Studies 91, Springer, New York, USA. 152166. Nordstrom, D.K., 1982. The effect of sulphate on aluminium
concentrations in natural waters: some stability relations in the system Al2O3-SO3-H2O at 298 K. Geochim. Cosmochim. Acta, 46, 681692.
Nordstrom, D.K. and Howard, M.M., 1996. Aqueous equilibrium data for mononuclear aluminum species. In: The environmental
chemistry of aluminum, G. Sposito (Ed.), Lewis Publishers,
Chelsea, UK. 3980.
Norton, S.A. and Veselý, J., 2003. Acidification and Acid Rain. In: Environmental Geochemistry B. Sherwood Lollar (Ed.), Vol.9, Treatise on Geochemistry, Elsevier, New York, USA. (in press).
Novák, M., Bottrell, S.H., Fottová, D., Buzek, F., Groscheová, H. and ák, K., 1996. Sulphur isotope signals in forest soils of Central Europe along an air pollution gradient. Environ. Sci.
Technol., 30, 34733476.
Prechtel, A., Alewell, C., Armbruster, M., Bittersohl, J., Cullen, J., Evans, C., Helliwell, R., Kopácek, J., Marchetto, A., Matzner, E., Meesenburg,H., Moldan, F., Moritz, K., Veselý, J. and Wright, R.F., 2001. Response of sulphur dynamics in European catchments to decreasing sulphate deposition. Hydrol. Earth
Syst. Sci., 5, 311324.
Procházková, L., 1959. Bestimmung der Nitrate im Wasser. Z.
anal. Chem., 167, 254260 (in German).
Procházková, L. and Blaka, P., 1999. Chemistry and biology of the Bohemian Forest lakes in the early 1960s. Silva Gabreta, 3, 6572 (in Czech).
Puhe, J. and Ulrich, B., 2001. Global Climate Change and Human
Impacts on Forest Ecosystems. Ecological Studies 143, Springer,
Berlin, Germany. 592pp.
Schmidt, R., Arzet, K., Facher, E., Fott, J., Irlweck, K., Reháková, Z., Rose, N., Strakrabová, V. and Veselý, J., 1993. Acidification
of Bohemian lakes. Recent trends and historical development.
Ost-West Program Report GZ 45.168/1-276(b), Mondsee, Austria. 86pp.
Stoddard, J.L., 1994. Long-term changes in watershed retention of nitrogen. In: Environmental Chemistry of Lakes and
Reservoirs, L.A. Baker (Ed.), American Chemical Society,
Advances in Chemistry No 237, Washington D.C., USA. 223 284.
Stumm, W. and Morgan, J.J., 1981. Aquatic Chemistry. Wiley, New York, USA.
Sullivan, T.J., Cosby, B.J., Driscoll, C.T., Charles, D.F. and Hemond, H.F., 1996. Influence of organic acids on model projections of lake acidification. Water Air Soil Pollut., 91, 271 282.
Torssander, P. and Mörth, C.-M., 1998. Sulphur dynamics in the Roof experiment at Lake Gardsjön deduced from sulphur and oxygen isotope ratios in sulphate. In: Experimental Reversal of
Acid Rain Effects. The Gardsjön Roof Project, H. Hultberg and
R. Skeffington (Eds.), Wiley, Chichester, UK. 185206. UN-ECE, 1999. Strategies and Policies for Air Pollution
Abatement. Economic Commission for Europe (ECE.EB.AIR/
65), Convention on Long-Range Transboundary Air Pollution, United Nations, New York and Geneva.
Veselý, J., 1994. Investigation of the nature of the Sumava lakes: a review. Casopis Národního Muzea, Praha, Rada
prírodovedná, 163, 103120.
Veselý, J. and Majer, V., 1992. The major importance of nitrate increase for the acidification of two lakes in Bohemia. Doc. Ist.
Ital. Idrobiol., 32, 8392.
Veselý, J., Almquist-Jacobson, H., Miller, L.M., Norton, S.A., Appleby, P., Dixit, A.S. and Smol, J.P., 1993. The history and impact of air pollution at Certovo Lake, southwestern Czech Republic. J. Paleolimnol., 8, 211231.
Veselý, J., 1998. Changes in vegetation of the Cerné Lake area inferred from pollen analysis of lake sediment: period between 3400 BC and 1600 AD. Silva Gabreta, 2, 141153.
Veselý, J., Hruka, J., Norton, S.A. and Johnson, C.E., 1998a. Trends in water chemistry of acidified Bohemian lakes from 1984 to 1995: I. Major solutes. Water Air Soil Pollut., 108, 107 127.
Veselý, J., Hruka, J. and Norton, S.A., 1998b. Trends in the chemistry of acidified Bohemian lakes from 1984 to 1995: II. Trace elements and aluminum. Water Air Soil Pollut., 108, 425 443.
Veselý, J., Majer, V. and Norton, S.A., 2002. Heterogeneous response of central European streams to decreased acidic atmospheric deposition. Environ. Pollut. 120, 275281.
Vrba, J., Kopácek, J., Fott, J., Kohout, L., Nedbalová, L., Praáková, M., Soldán, T. and Schaumburg, J., 2003. Long-term studies (18712000) on acidification and recovery of lakes in the Bohemian Forest (central Europe). Sci. Total Environ.,
310, 7385.
Wright, R.F., Emmett, B.A. and Jenkins, A., 1998. Acid deposition, land-use change and global change: MAGIC 7 model applied to Aber, UK (NITREX project) and Risdalsheia, Norway (RAIN and CLIMEX projects). Hydrol. Earth Syst. Sci., 2, 385397.