HAL Id: hal-00303141
https://hal.archives-ouvertes.fr/hal-00303141
Submitted on 16 Oct 2007HAL is a multi-disciplinary open access
archive for the deposit and dissemination of sci-entific research documents, whether they are pub-lished or not. The documents may come from teaching and research institutions in France or abroad, or from public or private research centers.
L’archive ouverte pluridisciplinaire HAL, est destinée au dépôt et à la diffusion de documents scientifiques de niveau recherche, publiés ou non, émanant des établissements d’enseignement et de recherche français ou étrangers, des laboratoires publics ou privés.
The wintertime two-day wave in the Polar Stratosphere,
Mesosphere and lower Thermosphere
D. J. Sandford, M. J. Schwartz, N. J. Mitchell
To cite this version:
D. J. Sandford, M. J. Schwartz, N. J. Mitchell. The wintertime two-day wave in the Polar Stratosphere, Mesosphere and lower Thermosphere. Atmospheric Chemistry and Physics Discussions, European Geosciences Union, 2007, 7 (5), pp.14747-14765. �hal-00303141�
ACPD
7, 14747–14765, 2007 The wintertime two-day wave D. Sandford et al. Title Page Abstract Introduction Conclusions References Tables Figures ◭ ◮ ◭ ◮ Back Close Full Screen / EscPrinter-friendly Version Interactive Discussion
EGU
Atmos. Chem. Phys. Discuss., 7, 14747–14765, 2007 www.atmos-chem-phys-discuss.net/7/14747/2007/ © Author(s) 2007. This work is licensed
under a Creative Commons License.
Atmospheric Chemistry and Physics Discussions
The wintertime two-day wave in the Polar
Stratosphere, Mesosphere and lower
Thermosphere
D. J. Sandford1, M. J. Schwartz2, and N. J. Mitchell1
1
Centre for Space, Atmospheric & Oceanic Science, Department of Electronic and Electrical Engineering, University of Bath, Bath, BA2 7AY, UK
2
Microwave Atmospheric Science Group, Jet Propulsion Laboratory, 4800 Oak Grove Dr, Pasadena, CA 91109-8099, USA
Received: 6 September 2007 – Accepted: 11 October 2007 – Published: 16 October 2007 Correspondence to: D. J. Sandford ([email protected] )
ACPD
7, 14747–14765, 2007 The wintertime two-day wave D. Sandford et al. Title Page Abstract Introduction Conclusions References Tables Figures ◭ ◮ ◭ ◮ Back Close Full Screen / EscPrinter-friendly Version Interactive Discussion
EGU
Abstract
Recent observations of the polar mesosphere have revealed that waves with periods near two days reach significant amplitudes in both summer and winter. This is in striking contrast to mid-latitude observations where two-day waves maximise in sum-mer only. Here, we use data from a meteor radar at Esrange (68◦N, 21◦E) in the
5
Arctic and data from the MLS instrument aboard the EOS Aura satellite to investi-gate the wintertime polar two-day wave in the stratosphere, mesosphere and lower thermosphere. The radar data reveal that mesospheric two-day wave activity mea-sured by horizontal-wind variance has a semi-annual cycle with maxima in winter and summer and equinoctial minima. The MLS data reveal that the summertime wave in
10
the mesosphere is dominated by a westward-travelling zonal wavenumber three wave with significant westward wavenumber four present. It reaches largest amplitudes at mid-latitudes in the southern hemisphere. In the winter polar mesosphere, however, the wave appears to be an eastward-travelling zonal wavenumber two, which is not seen during the summer. At the latitude of Esrange, the eastward-two wave reaches
15
maximum amplitudes near the stratopause and appears related to similar waves pre-viously observed in the polar stratosphere. We conclude that the wintertime polar two-day wave is the mesospheric manifestation of an eastward-propagating, zonal-wavenumber-two wave originating in the stratosphere, maximising at the stratopause and likely to be generated by instabilities in the polar night jet.
20
1 Introduction
The quasi-two-day wave (Q2DW) is one of the most conspicuous features of the meso-sphere and lower thermomeso-sphere (MLT) region. At middle and low latitudes the Q2DW reaches maximum amplitudes of several tens of ms−1 in late summer, where it can be the largest-amplitude feature present, but it is largely absent at other times (e.g., Muller
25
propagat-ACPD
7, 14747–14765, 2007 The wintertime two-day wave D. Sandford et al. Title Page Abstract Introduction Conclusions References Tables Figures ◭ ◮ ◭ ◮ Back Close Full Screen / EscPrinter-friendly Version Interactive Discussion
EGU
ing, zonal wavenumber 3 (hereafter W3 etc.) wave. This has been identified with the (3, 0) Rossby normal mode (Salby, 1981) and baroclinic instabilities, if there is sufficient eastward shear above the summertime westward jets (Plumb 1983). Significant W4 components and somewhat smaller W2 components have also been reported in both observations and in modelling studies (e.g., Meek et al., 1996; Norton and Thuburn,
5
1996; Pancheva et al., 2004).
In contrast to these mid-latitude observations, recent studies have revealed signifi-cant wave activity with a period near two days in the winter Arctic MLT region (Nozawa et al., 2003a, b; Manson et al., 2004). These studies used ground-based meteor and MF radars to reveal significant wave amplitudes in winter, but were unable to determine
10
the zonal wavenumber and direction of propagation of the wintertime polar two-day wave because they had insufficient longitudinal coverage in the radars used.
In the polar winter stratosphere, a two-day wave has been observed and identified as an eastward propagating, zonal wavenumber 2 (E2) planetary wave. This wave is believed to be one of a series of waves generated by barotropic instabilities in the
15
polar night jet (e.g., Venne and Stanford, 1982; Hartmann, 1983; Prata, 1984; Lait and Stanford, 1988 and Manney et al., 1988). Nozawa et al. (2003b) suggested that the polar MLT-region wintertime two-day wave may be an E2 wave connected to these stratospheric oscillations – but this could not confirmed in the absence of longitudinal measurements.
20
Palo et al. (2007) reported an E2 wave in the mid-latitude, summer, southern-hemisphere MLT region occurring simultaneously with a W3 wave. They attributed the E2 wave to a non-linear coupling between the W3 Q2DW and the migrating diurnal tide.
Here, we investigate the nature of the wintertime polar two-day wave observed in
25
the MLT region by an Arctic meteor radar and in data from the MLS (Microwave Limb Sounding) instrument aboard the NASA Aura satellite. In particular, the longitudinal coverage provided by the satellite observations allows us to determine zonal wavenum-bers and the height coverage allows us to reveal the relation of this MLT-region wave to
ACPD
7, 14747–14765, 2007 The wintertime two-day wave D. Sandford et al. Title Page Abstract Introduction Conclusions References Tables Figures ◭ ◮ ◭ ◮ Back Close Full Screen / EscPrinter-friendly Version Interactive Discussion
EGU
two-day waves in the stratosphere. Finally, we address the mechanisms whereby this wave might be excited (e.g., non-linear coupling or excitation by barotropic instability).
2 Data analysis
Data from two independent sources are used in this study. The first source is mea-surements of horizontal winds at mesopause heights recorded by a meteor radar at
5
Esrange (68◦N 21◦E). This radar measures the winds with typical height and time res-olutions of about 3 km and 1 hour, respectively (See Mitchell et al., 2002 for details). The Esrange radar has operated continually from October 1999. Here, data from the interval October 1999 to April 2007 are considered and were analysed to yield hourly estimates of zonal and meridional winds in six height gates between 80 and 100 km.
10
The second source of data is the MLS instrument aboard the NASA Aura satellite -part of the A-train constellation of satellites (Waters et al 2006). Data from Aura over the interval August 2004 to February 2007 are considered here. MLS yields geopotential height as one of its level-2 data products covering the height range of ∼ 10 – 97 km. The Aura satellite is in a Sun-synchronous orbit and so passes through only two local
15
times at any given latitude. At the 68◦N latitude of Esrange these local times are about 3.1 and 12.3 hours. The highest latitude accessible to the satellite is just over 80◦.
Here, we have applied the data analysis method of Wu et al. (1995a), to the geopo-tential height data. In this method, the geopogeopo-tential height data is divided into latitude bands of 10 degrees width (e.g. 60◦–70◦N). A data set is then assembled consisting
20
of geopotential height values for successive passes of the satellite through each band. Because of the path of the satellite, the universal times and longitudes of the crossings through any given latitude band are not independent and, in fact, form a regular matrix. Sinusoidal functions of zonal wavenumber 4 to -4 and periods of 42 to 56 hours were then least-squares fitted to this matrix. This yields geopotential amplitudes and phases
25
for waves with any combination of these wavenumbers and periods within a particular latitude band. Note that positive wavenumbers correspond to westward propagating
ACPD
7, 14747–14765, 2007 The wintertime two-day wave D. Sandford et al. Title Page Abstract Introduction Conclusions References Tables Figures ◭ ◮ ◭ ◮ Back Close Full Screen / EscPrinter-friendly Version Interactive Discussion
EGU
waves and negative to eastward propagating waves. Note that because there are only two local times within any latitude band, this analysis is unable to resolve tides without complications caused by aliasing.
3 Results
The radar data were analysed to produce a climatology of waves with period near two
5
days. For a particular height gate, the horizontal winds were band-pass filtered to reveal oscillations with periods between 1.5 and 3.4 days. We assume that all of the variance in this band is associated with the Q2DW. For each month of data a variance value was calculated for each height gate. These variance values then provide a simple proxy of wave activity within this period band.
10
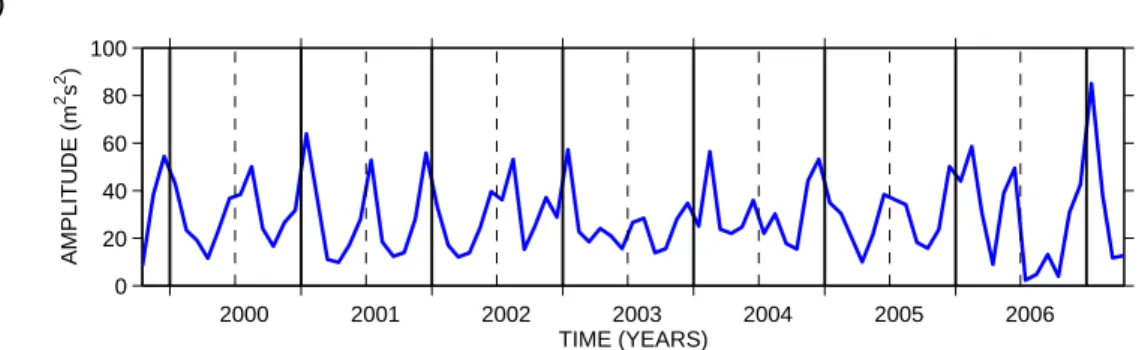
Figure 1a, b presents monthly variance values for zonal and meridional winds, re-spectively, measured over Esrange from a height gate spanning 89 to 92 km from October 1999 to April 2007. The Figure clearly shows that variance tends to max-imises in winter and summer and has equinoctial minima, i.e. there is a semi-annual cycle. There is also considerable inter-annual variability. For instance, the summertime
15
maximum varies from values as small as about 20 m2s2in 2001 and 2004 to values as large as about 75 m2s2in 2002.
This semi-annual behaviour is in marked contrast to that observed at middle and low latitudes where wave activity with a period near two days maximises in the summer and is significantly weaker in the winter.
20
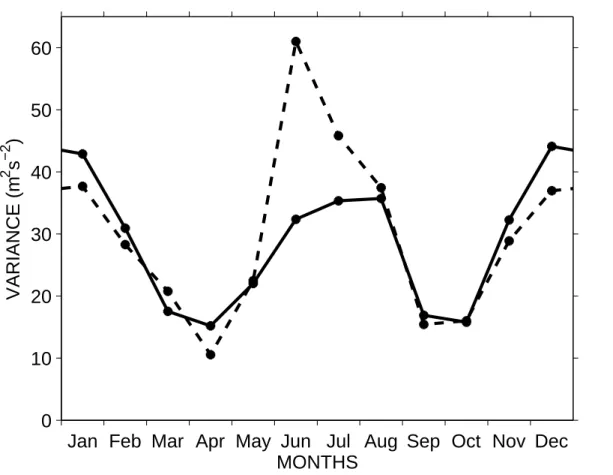
To reveal a representative seasonal cycle, a composite-year analysis was carried out using the data of Figure 1. Figure 2 presents this composite year analysis for the zonal and meridional components. The semi-annual cycle of variance is very apparent. In the case of the winter maximum, the zonal and meridional variances are about the same size and are ∼40 m2s2. However, in the case of the summer maximum the
25
meridional variance is significantly larger than the zonal, some ∼60 m2s2 c.f. some ∼35 m2s2. In both zonal and meridional cases the equinoctial minimum have values of
ACPD
7, 14747–14765, 2007 The wintertime two-day wave D. Sandford et al. Title Page Abstract Introduction Conclusions References Tables Figures ◭ ◮ ◭ ◮ Back Close Full Screen / EscPrinter-friendly Version Interactive Discussion
EGU
about ∼15 m2s2.
These results suggest that there is considerable wave activity with a period near two days present in the Arctic winter and summer. This reinforces the conclusions of Nozawa et al. (2003a, 2003b) and Manson et al. (2004).
The MLS data provide an opportunity to investigate the zonal wavenumber(s) and
5
global context of these wave features evident in the summer and winter Arctic meso-sphere. For each 10 degree latitude band from 80◦N to 80◦S, the average geopotential height amplitude was calculated over the period range 42–56 h. These averages were calculated using a time window of 15 days incremented through the data set in steps of 5 days. The calculation was performed for zonal wavenumbers W4 to E4.
10
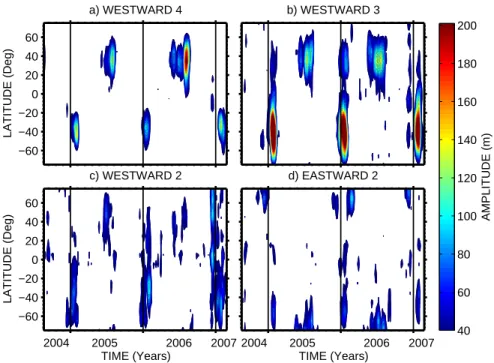
The result of this analysis is an estimate of wave amplitude against latitude and time for each of the wavenumbers W4 to E4 over the interval August 2004 to February 2007. Figure 3a–d presents these results for zonal wavenumbers W4, W3, W2 and E2 at a height of about 90 km (selected to match the radar observations). Results for wavenumbers W1, 0, E1, E3 and E4 are not shown because these yielded negligible
15
amplitudes (generally less than 40 m). In each Figure, the contours are plotted only for amplitudes larger than 40 m.
We will now consider each Figure in turn. The W4 results of Fig. 3a reveal ampli-tudes that maximise in each hemisphere at mid-latiampli-tudes during the summer. Wave amplitudes are strongest during the months of June to August in the northern
hemi-20
sphere and December to February in the southern hemisphere. Amplitudes reached values of ∼140 m in each summer, except in summer 2006 in the northern hemisphere which reached >200 m. Note that there are no significant amplitudes (>40 m) in winter in either hemisphere. Further, note that the amplitudes are small at latitudes poleward of ±60◦ in each hemisphere.
25
The W3 results of Figure 3b reveal amplitudes which also maximise in each hemi-sphere at mid-latitudes during the summer. In this case, however, the summertime southern-hemisphere amplitudes are significantly larger than in the northern hemi-sphere. Wave amplitudes are strongest during the months of June to August in the
ACPD
7, 14747–14765, 2007 The wintertime two-day wave D. Sandford et al. Title Page Abstract Introduction Conclusions References Tables Figures ◭ ◮ ◭ ◮ Back Close Full Screen / EscPrinter-friendly Version Interactive Discussion
EGU
northern hemisphere and January and February in the southern hemisphere. In the northern hemisphere, amplitudes reach values of ∼140 m. However, in the southern hemisphere, peak amplitudes exceed 250 m in each of the three summers observed. Note again that there are no amplitudes >40 m in winter in the southern hemisphere. There are, however, bursts of activity in the northern hemisphere at mid-latitudes
dur-5
ing each winter. These bursts reach amplitudes as large as 90 m, but are in all cases smaller than the summertime amplitudes. Again, note that the amplitudes are small at latitudes northwards of 60◦. However, in the southern hemisphere, significant ampli-tudes are present to latiampli-tudes as far south as −75◦.
The W2 results of Fig. 3c reveal a rather similar picture to that of the W3. Again,
10
although there are amplitude maxima in each hemisphere during the summer, there is also activity of equivalent amplitude in the northern hemisphere winter. In the south-ern hemisphere, wave amplitudes are strongest during the months of December to February. The amplitudes reach values of ∼100 m in both the northern and southern hemisphere. The oscillations extend as far polewards as ±70◦.
15
The E2 results of Fig. 3d reveal a rather different picture. In contract to the other wavenumbers, the amplitude of E2 maximises in both hemispheres during the winter. There is also significant activity in the southern hemisphere summer, which may be an effect of aliasing from the W3 since these maxima occur at the same time as those of the W3 (see Sect. 4). The E2 activity generally occurs poleward of ±50◦. Wave
20
amplitudes are strongest during the months of November to February for the northern hemisphere and June to August plus January for the southern hemisphere. Amplitudes reach values of ∼100 m in both hemispheres.
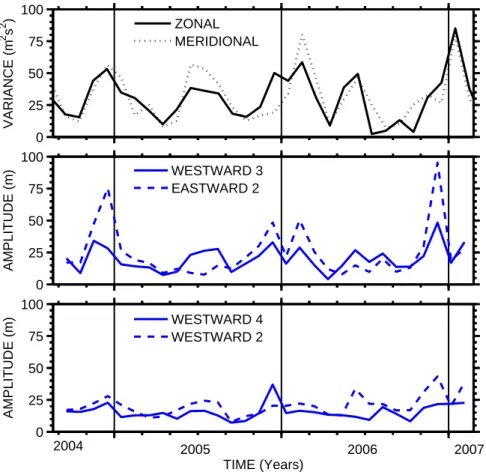
To see if these observations can explain the behaviour observed over Esrange (Fig. 1), the data were reanalysed to examine the latitudes from 63◦ to 73◦N at a
25
height of ∼ 91 km. The monthly variances of two-day wave activity as observed by the radar are shown in Fig. 4a for the August 2004 to February 2007 interval for which Aura MLS data are considered. Figure 4b, c presents the corresponding time series of geopotential heights over this latitude range. The W3 and E2 results are shown in
ACPD
7, 14747–14765, 2007 The wintertime two-day wave D. Sandford et al. Title Page Abstract Introduction Conclusions References Tables Figures ◭ ◮ ◭ ◮ Back Close Full Screen / EscPrinter-friendly Version Interactive Discussion
EGU
Fig. 4b and the W4 and W2 results in Fig. 4c.
During winter, the greatest activity (geopotential amplitude) is present in the E2 com-ponent and there is some activity in the W3. However, because of the effect of aliasing we do not believe this wintertime W3 activity is significant (see Sect. 4). The summer-time activity seems to be a combination of the W3 and W2, with only small contributions
5
from the W4 and E2. These results show that the summer time and winter time polar two-day wave have very different wavenumbers, i.e., largely W3 and E2, respectively.
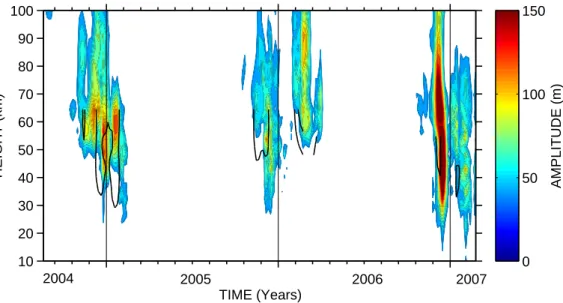
Prata (1983) showed that there is a wintertime, E2 polar two-day wave in the strato-sphere. To determine if this wave is connected to that observed here in the meso-sphere, we examined the MLS results from 10 to 100 km and 63◦ to 73◦N. Figure 5
10
presents time-height contours of the geopotential amplitude of the E2 two-day wave calculated as 15-day means. The Figure clearly shows that the wave observed in the mesosphere is also present to heights below 30 km and reaches maximum amplitudes at heights of about 60 km, i.e., near the stratopause. This means that the MLT-region and stratospheric observations are almost certainly observations of a single E2
plane-15
tary wave that is present at heights from below 30 km to above 100 km.
The wintertime occurrence of this E2 wave can be explained in terms of the Charney and Drazin theorem (1961). The zonal phase speed, cx, of the E2 two-day wave at the
68◦N latitude of Esrange is ∼52 ms−1. Charney-Drazin theorem states that a planetary wave can only propagate for cx values such that 0 < ¯u − cx < Uc, where ¯u is the
20
zonal mean wind and Uc is the critical speed, which is 28.6 ms−1 (for this latitude and
assuming an E2 wave of meridional wavenumber 2) e.g., Forbes (1995). This means that the E2 two-day wave should only be able to propagate in regions where the zonal wind speed lies between ∼ 52 and 80.6 ms−1. To see if this is actually the case in our observations, we calculated the zonal mean zonal winds from the UKMO assimilated
25
stratospheric data for the October 2004 to February 2007 interval corresponding to the Aura MLS data. To match these to the MLS observations they were calculated as 15-day means within the 63◦–73◦N latitude range. The results of this analysis are not shown, but the boundaries of these regions are indicated on Figure 5 by dashed lines.
ACPD
7, 14747–14765, 2007 The wintertime two-day wave D. Sandford et al. Title Page Abstract Introduction Conclusions References Tables Figures ◭ ◮ ◭ ◮ Back Close Full Screen / EscPrinter-friendly Version Interactive Discussion
EGU
It is immediately clear from the Figure that most of the E2 two-day wave activity occurs only within these regions. This relation to the mean wind provides compelling support for the interpretation of the E2 two-day wave as a planetary wave. Note that the dashed lines do not extend above ∼65 km because this is the upper limit of the UKMO analyses (∼55 km after March 2006).
5
Finally, the vertical gradients of phase in the MLS observations were used to calcu-late the vertical wavelength of the polar wintertime E2 two-day wave. Typical vertical wavelengths were found to be 123±9 km.
From the above analyses, we conclude that the polar wintertime mesospheric two-day wave is dominated by an E2 two-two-day wave planetary wave, which extends through
10
the stratosphere and mesosphere.
4 Discussion
Satellite studies of planetary waves can be complicated by aliasing because the lon-gitude and time of observation are not independent (e.g., Wu et al., 1995a). The data can therefore have the same pattern present for multiple wavenumber-period
combi-15
nations. In particular, a W3 two-day wave, could alias to an E2 two-day wave. The magnitude of the signal produced by aliasing depends on the difference in longitude between the ascending and descending nodes of the satellite’s orbit. It can be shown using the method described by Wu et al. (1995a) that in our observations up to about 36 % of the amplitude of the E2 two-day wave would be aliased into the W3 two-day
20
wave at 68◦N, and visa-versa. This means that during the winter, when the E2 am-plitude is actually more than 200% that of the W3 (Fig. 4b), it is not likely that the E2 signal contains a significant aliased component of the W3. Further, the observation that the E2 obeys Charney-Drazin theorem is also indicative that it is a real wave and not a result of aliasing. We therefore conclude for these two reasons that the observed
25
E2 two-day wave does not contain a significant aliased component – at least in winter. However, we note that in winter 2004/05 and 2006/07 the W3 amplitudes are about
ACPD
7, 14747–14765, 2007 The wintertime two-day wave D. Sandford et al. Title Page Abstract Introduction Conclusions References Tables Figures ◭ ◮ ◭ ◮ Back Close Full Screen / EscPrinter-friendly Version Interactive Discussion
EGU
one-third those of the E2 and so we cannot be confident that the W3 signal is not entirely caused by aliasing from the E2.
Prata (1984) reported observations of an E2 two-day wave in the polar winter strato-sphere. Prata’s observations were only made at a height of ∼ 45 km. Our radar and satellite observations reveal that this wave extends to at least 100 km and that
maxi-5
mum amplitude occur at ∼60 km.
Two mechanisms have been proposed for the excitation of the E2 two-day wave in the stratosphere and/or mesosphere. Firstly, Hartmann (1983), Prata (1984), Lait and Stanford (1988) and Manney et al. (1988) suggest that the stratospheric E2 two-day wave is one of a series of waves generated by instabilities in the zonal winds of the polar
10
night jet. Secondly, Palo et al. (2007) reported observations of an E2 two-day wave in the summer mesosphere, which they attributed to a nonlinear coupling between the W3 two-day wave and a migrating diurnal tide.
Our observations suggest that the wintertime polar two-day wave is an E2 wave which has propagated upwards from the stratosphere. However, it is unlikely to have
15
been generated by the non-linear mixing of a W3 and a diurnal tide because the W3 amplitudes observed can be explained entirely as a result of aliasing.
5 Conclusions
Observations of mesospheric winds over Esrange (68◦N) reveal planetary waves with a period near 2 days in summer and in winter. The wintertime two-day wave is much
20
stronger than that observed at mid-latitudes in winter and we have investigated its structure and origin. Observations made with the Aura MLS instrument reveal the winter two-day wave to be an eastward-propagating zonal wavenumber two planetary wave. Although there is a W3 wave present in the winter, aliasing considerations sug-gest this is likely to be a product of aliasing from the E2 wave rather than a genuine
25
oscillation. The E2 appears to be small in the summertime, which instead is dominated by the classical W3 structure.
ACPD
7, 14747–14765, 2007 The wintertime two-day wave D. Sandford et al. Title Page Abstract Introduction Conclusions References Tables Figures ◭ ◮ ◭ ◮ Back Close Full Screen / EscPrinter-friendly Version Interactive Discussion
EGU
Because the wintertime W3 wave has negligible amplitude, this suggests that the wintertime E2 wave is not generated by non-linear interaction between the W3 and the migrating diurnal tide at mesospheric heights, but rather has been generated in the stratosphere and has ascended to the mesosphere. This interpretation is reinforced by the observation of large E2 amplitudes around the polar winter stratopause. This
5
E2 wave appears to be the mesospheric manifestation of the E2 wave observed in the stratosphere by Venne and Stanford (1982), Hartmann (1983), Prata (1984), Lait and Stanford (1988) and Manney et al. (1988), the generation of which is attributed to instabilities in the polar night jet.
We therefore suggest that although “two–day” wave activity is observed at polar
lat-10
itudes in both summer and winter, the explanation for the summer and winter waves is different. The summer two-day wave appears to have the expected W2, W3 and W4 wave structure, whereas the winter two-day wave is largely or entirely an E2 wave originating in the stratosphere.
Acknowledgements. Work at the Jet Propulsion Laboratory, California Institute of Technology,
15
was done under contract with the National Aeronautics and Space Administration.
References
Charney, J. G. and Drazin, P. G.: Propagation of Planetary-Scale Disturbances from the Lower into the Upper Atmosphere, J. Geophys. Res., 66, 83–109, 1961.
Forbes, J. M.: Tidal and Planetary Waves, in The Upper Mesosphere aand Lower
Thermo-20
sphere: A Review of Experiment and Theory, Geophys. Monogr., vol. 87, edited by Johnson R.M. and Killeen T. L., pp. 67–87, AGU, Washington, D.C., 1995.
Hartmann, D. L.: Barotropic Instabilities of the Polar Night Jet-Stream, J. Atmos. Sci., vol. 40(4), pp. 817–835, 1983.
Lait, L. R. and Stanford, J. L.: Fast, Long-Lived Features in the Polar Stratosphere, J. Atmos.
25
Sci., vol. 45, no. 24, pp. 3800–3809, 1988.
Manney G. L., Nathan, T. R., and Stanford, J. L.: Barotropic Stability of Realistic Stratospheric Jets, J. Atmos. Sci., vol. 45(18), pp. 2545–2555, 1988.
ACPD
7, 14747–14765, 2007 The wintertime two-day wave D. Sandford et al. Title Page Abstract Introduction Conclusions References Tables Figures ◭ ◮ ◭ ◮ Back Close Full Screen / EscPrinter-friendly Version Interactive Discussion
EGU
Manson, A. H., Meek, C. E., Hall, C. M., Nozawa, S., Mitchell, N. J., Pancheva, D., Singer, W. and Hoffmann, P.: Mesopause dynamics from the Scandinavian triangle of radars within the PSMOS-DATAR Project, Ann. Geophys., 22, 367–386, 2004.
Meek, C. E., Manson, A. H., Franke, S. J., Singer, W., Hoffmann, P., Clark, R. R., Tsuda, T., Nakamura, T., Tsutsumi, M., Hahan, M., Fritts, D. C., Isler, I., and Portnyagin, Yu, I.: Global
5
study of northern hemisphere quasi-2-day wave events in recient summers near 90 km alti-tude, J. Atmos. Sol. Terr. Phys., 58, 1401–1411, 1996.
Mitchell, N. J., Pancheva, D., Middleton, H. R. and Hagan, M. E.: Mean winds and tides in the Arctic mesosphere and lower thermosphere, J. Geophys. Res., 107, doi: 10.1029/2001JA900127, 2002.
10
Muller, H. G. and Nelson, L.: A travelling quasi 2-day wavbe in the meteor region, J. Atmos. Terr. Phys., 40, 761–766, 1978.
Norton, W. A. and Thuburn, J.: The two-day wave in a middle atmosphere GCM, Geophys. Res. Lett., vol. 23, No. 16, 2113–2116, 1996.
Nozawa, S., Imaida, S., Brekke, A., Hall, C. M., Manson, A., Meek, C., Oyama, S., Dobashi, K.,
15
and Fujii, R.: The quasi 2-day wave observed in the polar mesosphere, J. Geophys. Res., vol. 108, no. D2, 4039, doi: 10.1029/2002JD002440, 2003a.
Nozawa, S., Iwahashi, H., Brekke, A., Hall, C. M., Meek, C., Manson, A., Oyama, S., Murayama, Y., and Fujii, R.: The quasi 2-day wave observed in the polar mesosphere: Comparison of the characteristics observed at Tromsø and Poker Flat, J. Geophys. Res., vol. 108, no. D24,
20
4748, doi: 10.1029/2002JD003221, 2003b.
Palo, S. E., Forbes, J. M., Zhang, X., Russell III, J. M. and Mlynczak, M. G.: An east-ward propagating two-day wave: Evidence for nonlinear planetary wave and tidal coupling in the mesosphere and lower thermosphere, Geophys. Res. Lett., vol. 34, L07807, doi: 10.1029/2006GL027728, 2007.
25
Pancheva, D., Mitchell, N. J., Manson, A. H., Meek, C. E., Jacobi, Ch., Protinyargin, Yu., Mer-zlyakov, E., Hocking, W. K., MacDougall, J., Singer, W., Igarashi, K., Clark, R. R., Riggin, D. M., Franke, S. J., Kurschner, D., Fahrutdinova, A. N, Kashcheyev, B. L., Oleynikov, A. N., and Muller, H. G.: Variability of the quasi-2-day wave observed in the MLT region during the PSMOS campaign of June–August 1999, J. Atmos. Sol. Terr. Phys., 66, 539–565, 2004.
30
Plumb, R. A.: Baroclinic Instability of the Summer Mesosphere: A Mechanism for the Quasi-Two-Day Wave? , J. Atmos. Sci., vol. 40, pp. 262–270, 1983.
ACPD
7, 14747–14765, 2007 The wintertime two-day wave D. Sandford et al. Title Page Abstract Introduction Conclusions References Tables Figures ◭ ◮ ◭ ◮ Back Close Full Screen / EscPrinter-friendly Version Interactive Discussion
EGU
Salby, M. L.: The 2-Day Wave in the Middle Atmosphere: Observations and Theory, J. Geo-phys. Res., vol. 86, no. C10, pp. 9654–9660, 1981.
Venne, D. E. and Stanford, J. L.: An Observational Study of High-Latitude Stratospheric Planetary-waves in Winter, J. Atmos. Sci., vol. 39(5), pp. 1026–1034, 1982.
Waters, J. W., Froidevaux, L., Harwood, R. S., et al.: The Earth Observing System Microwave
5
Limb Sounder (EOS MLS) on the Aura Satellite, IEEE Trans. Geosci. Remote Sens., vol. 44, no. 5, pp. 1075–1092, 2006.
Wu, D. L., Hays, P. B. and Skinner, W. R.: A Least Squares Method for Spectral Analysis of Space-Time Series, J. Atmos. Sci., vol. 52, no. 20, pp. 3501–3511, 1995a.
Wu, D. L., Fishbein, W. G. and Waters, J. W.: Excitation and Evolution of the Quasi-2-Day
10
Wave Observed in UARS/MLS Temperature Measurements, J. Atmos. Sci., vol. 53, no. 5, pp. 728–738, 1995b.
ACPD
7, 14747–14765, 2007 The wintertime two-day wave D. Sandford et al. Title Page Abstract Introduction Conclusions References Tables Figures ◭ ◮ ◭ ◮ Back Close Full Screen / EscPrinter-friendly Version Interactive Discussion EGU 2000 2001 2002 2003 2004 2005 2006 0 20 40 60 80 100 TIME (YEARS) AMPLITUDE (m 2s 2)
Fig. 1a. Monthly variances of band-passed horizontal winds from the Esrange meteor radar.
The data are from heights of 89 to 92 km and have been band passed between periods of 1.5 and 3.4 days. a) zonal winds and b)meridional winds. The solid vertical lines indicate the boundary between each year. The dashed lines indicate 1 July .
ACPD
7, 14747–14765, 2007 The wintertime two-day wave D. Sandford et al. Title Page Abstract Introduction Conclusions References Tables Figures ◭ ◮ ◭ ◮ Back Close Full Screen / EscPrinter-friendly Version Interactive Discussion EGU 2000 2001 2002 2003 2004 2005 2006 0 20 40 60 80 100 TIME (YEARS) AMPLITUDE (m 2s 2) Fig. 1b. Continued.
ACPD
7, 14747–14765, 2007 The wintertime two-day wave D. Sandford et al. Title Page Abstract Introduction Conclusions References Tables Figures ◭ ◮ ◭ ◮ Back Close Full Screen / EscPrinter-friendly Version Interactive Discussion
EGU
Jan
Feb
Mar
Apr
May
Jun
Jul
Aug
Sep
Oct
Nov
Dec
0
10
20
30
40
50
60
MONTHS
VARIANCE (m
2s
− 2)
Fig. 2. A composite-year analysis of the data of Fig. 1. The solid line indicates results for the
ACPD
7, 14747–14765, 2007 The wintertime two-day wave D. Sandford et al. Title Page Abstract Introduction Conclusions References Tables Figures ◭ ◮ ◭ ◮ Back Close Full Screen / EscPrinter-friendly Version Interactive Discussion EGU TIME (Years) d) EASTWARD 2 2005 2006 2007 AMPLITUDE (m) 40 60 80 100 120 140 160 180 200 TIME (Years) LATITUDE (Deg) c) WESTWARD 2 2005 2006 2007 −60 −40 −20 0 20 40 60 b) WESTWARD 3 LATITUDE (Deg) a) WESTWARD 4 −60 −40 −20 0 20 40 60 2004 2004
Fig. 3. Geopotential height amplitudes as a function of time and latitude for Aura MLS data
at a height of ∼90 km, for oscillations with periods between 42 and 56 h and different zonal wavenumbers. (a) westward 4, (b) westward 3, (c) westward 2 and (d) eastward 2. Amplitudes below 40 m are not plotted. The solid vertical black lines indicate the boundary between years.
ACPD
7, 14747–14765, 2007 The wintertime two-day wave D. Sandford et al. Title Page Abstract Introduction Conclusions References Tables Figures ◭ ◮ ◭ ◮ Back Close Full Screen / EscPrinter-friendly Version Interactive Discussion EGU 0 25 50 75 100 AMPLITUDE (m) WESTWARD 3 EASTWARD 2 2005 2006 2007 0 25 50 75 100 AMPLITUDE (m) TIME (Years) WESTWARD 4 WESTWARD 2 0 25 50 75 100 VARIANCE (m 2 s 2 ) ZONAL MERIDIONAL 2004
Fig. 4. (a) Horizontal wind variances from the Esrange meteor radar for a height of 89–92 km
as per Fig. 1. (b) Geopotential height amplitudes at a height of ∼91 km, between 63◦ and 73◦N,
ACPD
7, 14747–14765, 2007 The wintertime two-day wave D. Sandford et al. Title Page Abstract Introduction Conclusions References Tables Figures ◭ ◮ ◭ ◮ Back Close Full Screen / EscPrinter-friendly Version Interactive Discussion EGU TIME (Years) HEIGHT (km) 2005 2006 2007 10 20 30 40 50 60 70 80 90 100 AMPLITUDE (m) 0 50 100 150 2004
Fig. 5. Time-height contours of geopotential-height amplitudes for an E2 wave of period 42–
56 h. The latitude range is 63◦ and 73◦N. The dashed lines indicate the 52 ms−1 zonal wind
line derived from UKMO stratospheric assimilated data, above which Charney-Drazin theorem predicts the wave will propagate.