Collaborative Accessibility-based Public Engagement for Bus Rapid
Transit in Pretoria, South Africa
By Xinhui Li
M.L.Arch., Harvard University (2016)
B.Eng. in Urban Planning, Sun Yat-sen University, China (2013) Submitted to the Department of Urban Studies and Planning
in partial fulfillment of the requirements for the degree of Master in City Planning
at the
MASSACHUSETTS INSTITUTE OF TECHNOLOGY February 2019
C 2019 Xinhui Li. All Rights Reserved
The author here by grants to MIT the permission to reproduce and to distribute publicly paper and electronic copies of the thesis document in whole or in part in any medium now known or hereafter created.
________Signature redacted
Author_________________Department of Urban Studies and Planning September 7, 2018
Signature redacted
Certified by
late Profe4Wor P. Christopher Zegras Department of Urban Studies and Planning
Thesis Supervisor MASSACHUSETTS INSTITUTE OF TECHNOLOGY
hEB 152019
LIBRARIES
Signature redacted
As ociate Protessor P. Christopher Zegras Chair, MCP Committee Department of Urban Studies and Planning Accepted by
Collaborative Accessibility-based Public Engagement for Bus Rapid
Transit in Pretoria, South Africa
By Xinhui Li
Submitted to the Department of Urban Studies and Planning on September 7th, 2018 in Partial Fulfilment of the Requirements for the Degree of Master in City Planning
Abstract
Tools that make use of new technologies and new media to facilitate conversations for dispute-resolution have been studied and tested in various formats in recent years. As a field constantly involved with resolving conflicting interests and seeking collaborative problem-solving, urban planning could benefit greatly from the development and deployment of such tools. CoAXs (Collaborative Accessibility-based Stakeholder Engagement) is an interactive planning tool intended to enhance public participation in planning public transport systems. It has been implemented in different contexts in the United States and in Chile. This thesis presents
adaptation and deployment of the tool in a context with distinct political, cultural, and economic
characteristics - Pretoria, South Africa. With an ambitious plan to expand its Bus Rapid Transit
(BRT) network, but facing constrained road space, Pretoria is two years behind its BRT development plan because of unresolved conflicts between private vehicle users and public transport riders. Using an adapted version of CoAXs that allows users to create scenarios by selecting BRT route options, four public engagement workshops were conducted in July 2018 in Pretoria. The workshops were designed to help learn about the suitability of the tool in a new context, as well as its effectiveness in changing participants' perceptions and attitudes, fostering empathy between interest groups, and supporting meaningful conversations among stakeholders. Using a survey of participants and observations during the workshops, this study finds that CoAXs moderately broadened users' scope of expected impacts and prompted different user groups, especially private vehicle users, to empathize with users of other transport modes. CoAXs was effective in facilitating and supporting public engagement conversations, although more understanding and consideration of the specific cultural context will be helpful in the
future.
Thesis Supervisor: Associate Professor, P. Christopher Zegras Thesis Reader: Professor of the Practice, Ceasar McDowell
Acknowledgements
This work was completed through a lot of uncertainties and difficulties. It is a very valuable experience that would not have been possible without contributions, guidance, and support from many people.
I would like to first thank my advisor, Professor Chris Zegras, for his guidance, understanding, and support. Before getting involved in this project, I have been gaining knowledge and deepening my interests in different aspects of the planning field through Chris's lectures. Through my work on CoAXs and this thesis, Chris has constantly been guiding my thinking, giving me inspirations, and supporting me through difficulties. It has been a great pleasure to learn from him through this project, in the classroom, and beyond the academic work.
I would also like to thank my thesis reader, Professor Ceasar McDowell, for his very helpful feedback and support. Many thanks to the whole MIT CoAXs team: Jonathan Leape, Ricardo Sanchez, Anson Stewart, Xin Zheng, Thiago Sobral, Kelly Blynn, Peter Damrosch, and Cristian Navas. Thanks a lot to Jonathan for helping with the workshops in Pretoria and giving me very helpful suggestions through the project. And special thanks to Anson and Xin, for being so patient with my questions and requests, and helping me learn a lot through the development. Many thanks are owed to our partners at University of Pretoria: Professor Christo Venter, Nahungu Lionjanga, and all staff at the workshops. It would not have been possible for me to complete this work without the knowledge and guidance from Prof. Venter and Nahungu. Thanks a lot to Nahungu for her commitment to the project, her Sunday night Skype calls, and for taking me on the unforgettable Pretoria Metrorail and minibus taxi tour.
Thanks a lot to the participants in the workshops. Their enthusiastic participation and thoughtful comments helped me to develop a deeper understanding of the context, the complexity of the problem, and the experiment itself.
Thanks to the MIT Department of Urban Studies and Planning and BRT+ Center of Excellence for the funding support to my study and this project. And thanks a lot to all the DUSP staff for the help to accommodate my special thesis timeline.
Finally, I would like to give a very special thanks to my parents, for understanding and supporting my adventures, and for their love and encouragement. Last but not least, thanks in heart to all my friends for their enormous emotional support through my time at MIT.
Table of Contents
A bstract ... 3
A cknow ledgem ents...4
Table of Contents...5
List of Figures ... 7
List of Tables...8
Chapter 1: O verview ... 9
1.1 Background...10
1.1.1 Public Transport in Pretoria...10
1.1.2 Pretoria's BRT Extension and Contentions ... 13
1.2 Research Questions ... 14
1.3 Thesis Organization...16
Chapter 2: Literature R eview ... 18
2.1 Public Transport in South Africa...18
2.2 Public Participation in South Africa... 21
C hapter 3: Tool D evelopm ent... 25
3.1 Previous CoAXs Instances...25
3.2 Capabilities Definition for the Pretoria Instance ... 28
3.3 Development and Adaptation for the Pretoria Instance ... 30
3.3.1 Scenarios Definition...30
3.3.2 Route Specifications and Assumptions ... 34
3.3.3 Data Requirements and Preparation...36
3.3.4 Back-end Configuration ... 38
3.3.5 Front-end M odification ... 39
Chapter 4: Experim ent D esign... 41
4.1 W orkshops Overview ... 41
4.1.1 Common Arrangements: Scheduling, Staff, and Setup ... 41
4.1.2 Arrangements Specific to User Groups: Venues and Participant Recruitment ... 43
4.2 W orkshop Process...45
4.3 Data Collection ... 46
C hapter 5: Experim ent R esults ... 48
5.1 Participant General Information...48
5.2 Tool Interaction and Discussion...51
5.2.1 Tool Interaction Observation...51
5.2.2 Discussion Summary and Observation... 53
5.3 Survey Results Analysis ... 56
5.3.1 Project Understanding ... 57
5.3.2 Expected Project Impacts ... 58
5.3.3 Attitudes and Enthusiasm ... 67
5.3.4 Tool Usability and Usefulness...71
5.4 Comparison with the 2016 Boston Experiment... 74
C hapter ... 77
6.1 Conclusions...77
6.2 Limitations and Future Research...78
R eferences ... 80
A ppendices ... 83
Appendix A: Information Sheet for W orkshop Participants... 83
Appendix B: Pre-workshop Survey ... 86
Appendix C: Post-workshop Survey ... 92
List of Figures
Figure 1: A Re Yeng 5-Year Operational Plan...11
Figure 2: Map of baseline scenario and Line 2B trunk route... 31
Figure 3: Schem atics of trunk route scenarios... 32
Figure 4: Map of hypothetical feeder routes and places of interest in context...33
Figure 5: Choropleth map of total number of jobs in Tshwane by TAZ ... 38
Figure 6: Screenshot of CoAXs Pretoria... 40
Figure 7: W orkshop setup ... 43
Figure 8: Map of workshop venues and Ward 82... 44
Figure 9: Education levels of car users and non-car users ... 49
Figure 10: Reported monthly transport spending by car users and non-car users...50
Figure 11: Number of public planning meetings attended in the past year by user groups...51
Figure 12: Shifts in project understanding ... 57
Figure 13: Overall shifts of expected impacts (dedicated lane scenario)...60
Figure 14: Overall shifts of expected impacts (mixed traffic scenario)...61
Figure 15: 30-minute isochrones from different origin points with only dedicated lane trunk selected ... 6 7 Figure 16: Overall shifts of attitudes and enthusiasm...69
Figure 17: Reponses to post-workshop CoAXs usability questions...72
List of Tables
Table 1: Sum m ary of scenarios ... 34
Table 2: Specifications of baseline routes... 35
Table 3: Specifications of proposed routes ... 36
Table 4: Workshop agenda and staff arrangement ... 42
Table 5: Summary of workshop participants and user groups ... 48
Table 6: Summarized participant feedback on the discussed projects... 54
Table 7: Summarized participant feedback on CoAXs and workshop ... 55
Table 8: Summary of Average score for impacts of two trunk line scenarios ... 59
Table 9: Wilcoxon signed-rank test results (p-values) for shifts in expected impacts from each u ser gro up ... 64
Table 10: Pre- and post-workshop comparison of expected impacts between user groups (dedicated lane scenario) ... 65 Table 11: Pre- and post-workshop comparison of attitude and enthusiasm between user groups 70
Chapter 1: Overview
Public transport development often involves multiple stakeholders with conflicting interests, which makes effective public engagement a critical part of the planning processes. Pretoria, South Africa is one city undergoing such a planning process to expand its Bus Rapid Transit (BRT) network. The conflict between commuters' urgent need for affordable and reliable public transport services and private vehicle users' concern about worsening traffic congestion has been unresolved for over two years through the current public participation schemes. This conflict, combined with constrained road spaces, has interrupted the implementation of the city's BRT plan.
CoAXs (Collaborative Accessibility-based Stakeholder Engagement) is an interactive planning tool intended to enhance public participation in planning public transport systems. It features an accessibility-based visualization of project impacts under hypothetical scenarios that are
modifiable by its users. CoAXs has been successfully tested in the United States and Chile, showing potential for broadening project understanding and fostering empathy among different stakeholders. This thesis presents an experiment with an adapted version of CoAXs for the Pretoria context, to explore suitability of the tool in a new context, as well as its effectiveness in changing participants' perceptions and attitudes, fostering empathy between interest groups, and supporting meaningful conversations among stakeholders. The Pretoria project was a
collaboration with the University of Pretoria, undertaken as part of the BRT+ Centre of Excellence.
1.1 Background
Pretoria is the administrative capital of South Africa (along with Cape Town as the legislative capital and Bloemfontein as the judicial capital). The metropolitan area has a population of 2.9 million and is located approximately 55 kilometers north-northeast of Johannesburg in the northeast of South Africa. Pretoria is the central part of the Tshwane Metropolitan Municipality in Gauteng Province, and Pretoria itself is sometimes referred to as Tshwane as well.
1.1.1 Public Transport in Pretoria
In July 2012, the City of Tshwane started construction of its bus rapid transit (BRT) system, A Re Yeng, and the first phase of the system became fully operational in December 2014. A Re
Yeng is planned with a trunk-feeder structure. Figure 1 illustrates the completed and planned trunk routes for A Re Yeng by the Gauteng Department of Roads and Transport. Currently, the Pretoria BRT consists of 2 trunk routes and 7 feeder routes. The completed and operational trunk routes are Line 1 A and Line 2A in Figure 1. They have a total length of 16 kilometers and 12 stations, and run through the Pretoria CBD on dedicated lanes, with stations located on the central median of the road. The feeder routes run across the city to bring passengers to the trunk route, mostly in mixed traffic lanes. The complete system is planned with 16 trunk lines with 80 kilometers total length and 62 stations, among which 5 trunk lines (53 kilometers total) are planned to be implemented within five years. The City of Tshwane is responsible for planning, design, and construction of the BRT, with investment from the Development Bank of Southern Africa (DBSA). The BRT system is operated by Tshwane Rapid Transit (TRT) Pty Ltd, which is a corporate entity monitored by the City. The fare structure of A Re Yeng is distance-based, with a tap-in - tap-out payment system via pre-loaded cards.
- * -- -TSoshangtg69k 41 1C 13km n IACnk -- 1k 10 Mn 2Ab Vale Currently,
7.)
Figure 1 A Re Yeng 5-Year Operational Plan
(Source Ismail Vadi, 2017)
CurentyPretoria has five separate formal public transport systems. Aside from the BRT, there are Tshwane Municipal Bus, Metrorail, Gautrain, and Gautrain bus. The Tshwane Municipal Bus is a bus service with fixed routes and timetables. As of July 2017, it requires the same card as A Re Yeng as the only payment method, and it has the same distance-based fare structure as A Re
Yeng. However, there is no fare discount when transferring between Tshwane Municipal Bus and A Re Yeng. The Metrorail is a cheap mass transit railway service operating from Pretoria west to Atteridgeville, north to Soshaguve and Ga-Rankuwa, east to Mamelodi, and south to
townships to commute to the Pretoria CBD on a daily basis. However, because of poor
conditions of trains and unreliable schedules, the Metrorail is not considered safe or preferable for commuters who could afford other options.' The Gautrain is an 80-kilometer mass rapid transit railway system in the Gauteng province, primarily connecting Johannesburg and Pretoria as an alternative to driving for commuters. It became operational in June 2012, and currently has nine stations, two of which are located in Pretoria. The Gautrain is reliable, fast, safe, but much more expensive, and only connects well developed city centers instead of townships where large numbers of workers live. The Gautrain bus is a feeder bus service that brings people to and from the Gautrain stations. It also operates on pre-defined routes and timetables, and has been used on
its own as a commuting option. Except for a fare discount when transferring between the Gautrain and Gautrain bus, there is no fare integration across the five formal public transport systems in Pretoria.
Similar to other South African cities like Johannesburg and Cape Town, there are robust informal minibus taxi services running in Pretoria. The minibus taxis are usually 16-seat vans, operated by one driver only, and known for reckless driving. They run on certain routes but often change routes according to traffic and demand. The fare of minibus taxis is relatively cheap, but more expensive than the Metrorail. Although the safety and reliability of minibus taxis are not
desirable, they are more favorable than the Metrorail to passengers, including workers from the surrounding townships if they can afford it ("The minibus taxi industry in South Africa," 2013).
' The Metrorail has experienced multiple incidents of fatal accidents, severe delays, and violent protests. The
following news articles reported a few of these incidents: "Metrorail trains torched in Pretoria" (2016), "Metrorail trains are running at least an hour late this morning" (2017), and "Metrorail trains suspended between two Pretoria stations after violence" (2018).
1.1.2 Pretoria's BRT Extension and Contentions
In 2012, the city conducted a feasibility study of the impacts of converting one of the two general traffic lanes to a dedicated bus lane in each direction of Lynnwood Road and Atterbury Road, two of the city's busiest streets. Based on 2012 traffic data, the study concluded that, aside from the Lynnwood and University Road intersection, the reconfiguration of the two roads would not result in congestion at other spots. The city then released the feasibility study report to support the plan to convert one of the lanes to dedicated bus lane for BRT, leaving only one general traffic lane per direction along the two streets (Moatshe, 2017). However, four independent transport engineers did their own analysis and found that most of the intersections on Lynnwood Road are already experiencing significant congestion in the morning peak period, and they concluded that the results of the feasibility study were implausible ("Tshwane A Re Yeng bus plan 'faulty'," 2015). The local residents, who experience the congestion, quickly started to oppose the city's plan (Bothma, 2015).
In April 2015, it was announced that the Line 2B trunk route, which will run between Hatfield and Menlyn (Figure 1), would be completed by June 2017. Four days after the announcement, residents and opposition parties started protesting against the construction of Line 2B, due to the planned reduction in general traffic lanes on Lynnwood Road to one lane per direction. This
conflict remained unresolved for over two years, and in January 2018, six months after the date that Line 2B was originally planned to be operational, the city announced its decision to maintain two general traffic lanes per direction on Lynnwood and Atterbury roads, so that the introduction of BRT will not compromise existing road capacity.
With the new decision to maintain existing road capacity, the options for the Line 2B route became:
1) Operate the BRT in mixed traffic, with no major infrastructure construction and the buses being affected by peak-hour congestion with all other vehicles;
2) Construct a new lane in each direction, for exclusive BRT use, taking over spaces currently used as street parking.
Presumably, these two options will have very different impacts on different user groups. Option 1 would minimally impact private vehicle users, but the benefits of BRT for bus riders would be compromised; Option 2 would benefit the BRT users with more travel time savings and
reliability by isolating services from congestion, but would reduce parking capacity for private vehicle users. Faced with the possibility of losing parking spaces, in addition to the opposition against BRT accumulated over the past years, the car drivers have maintained resistance to the Line 2B addition even though the previous plan to reduce number of general traffic lanes is no longer under consideration.
1.2 Research Questions
In this context, this thesis attempts to answer three basic questions, using an interactive digital visualization tool, CoAXs (Collaborative Accessibility-based Stakeholder Engagement), deployed in public workshops.
1. Does visualization of accessibility changes influence the public's perception of and attitudes towards the addition of BRT routes?
Here, accessibility is measured by number of job opportunities reachable via public transport in different scenarios. Currently the public's negative perception of BRT results from concerns about it taking limited street space and producing potential densification in their neighborhoods. However, their perceived impacts of the additional BRT routes and attitudes towards them may change from seeing the improved accessibility.
Hypotheses:
1) Workshop participants will generally develop a broader perception and understanding of the impacts of additional BRT routes;
2) Participants' attitudes towards and enthusiasm for additional BRT routes will become more positive;
3) Participants who are private vehicle users are less likely to improve their attitudes towards additional BRT routes than other participants.
2. Could the visualization help develop empathy among transport user groups with conflicting interests, i.e., public transit users and private vehicle drivers?
If the option of constructing an additional lane for BRT is adopted, conflicts in the interests of public transport users and private vehicle users will be more evident, since public transport users will benefit from increased travel speeds for BRT and therefore increased accessibility given time constraints, but private vehicle drivers will lose parking spaces. We expect the two groups will develop more empathy towards each other when visualization of the other group's gains and losses are presented.
Hypothesis: Empathy between the two user groups will improve, people will think more about users of other transport modes.
3. Does the option of interacting with the tool on a laptop in addition to interacting with it on a large touch screen increase or decrease the impacts of the visualization on users?
In previous CoAXs workshops in other contexts, people only used a large touch screen to analyze transport scenarios together with a group of participants. We were curious whether this is the most effective way for people to best understand the scenarios, since some participants have to wait while others are using the touch screen, and some participants may not be
comfortable exploring their scenarios of interest in front of a crowd. As such, in the workshops we provided the option of interacting with CoAXs on laptops, so that participants could explore scenarios on their own or in smaller groups if they want to.
Hypothesis: Participants with less public meeting experiences will prefer to use laptops, but the impacts of the visualization will decrease because the users will not see scenarios that are interesting to other participants.
1.3 Thesis Organization
This thesis is organized in the following structure:
Chapter 2 provides the literature review for this thesis, focusing on issues related to public transportation and public participation processes for planning in South Africa.
Chapter 3 summarizes the previous uses of CoAXs, and describes the development and adaptation of the tool specific to the South African context.
Chapter 4 elaborates the experiment design of the CoAXs workshops in Pretoria.
Chapter 5 presents the results of the CoAXs workshops.
Chapter 6 develops conclusions based on the experiment results, and discusses limitations and recommendations for future research.
Chapter 2: Literature Review
2.1 Public Transport in South Africa
The public transport system in Pretoria faces a number of issues, which are not unique among other metropolitan areas in South Africa. This section summarizes the major issues related to the CoAXs experiment in Pretoria, drawing from the literature on public transport in South Africa.
First, the inequitable transport provision and its social consequences on low income populations in the South African context have been studied through the past decades. Most studies focus on low income groups in rural areas in multiple African contexts. For example, some have criticized that road development in rural areas is not a sufficient condition for providing economic
opportunities for the poor, given their lack of access to motor vehicles and ability to afford public transport (Bryceson, Bradbury, & Bradbury, 2008). With a more recent shift towards
focus on public transport in urban contexts, Venter (2011) used the 2003 National Household Travel Survey (NHTS) data to find that commuters living in displaced urban settlements or in isolated deep rural locations are most burdened by public transport expenditures, because of long commute distances, poor road conditions, and few travel alternatives. Another study focusing specifically on low income groups in Tshwane argues that lack of transport, high travel costs, and resulting limited access to basic activities (e.g. employment, education, health care) have contributed to them being unable to fully participate in the society and becoming socially excluded. The study specifically identified that formal public transport is often not an option for many urban low income residents of the Tshwane region, because the services were not provided at their residential locations or at the time they need to travel (Lucas, 2011).
Second, gender inequality in accessibility has also been an extensively studied issue in the South African, or more broadly, African contexts. In an early study focusing on rural women's
transport demand in multiple African countries, Bryceson & Howe (1993) contend that, given the sexual division of labor and women's child-caring responsibilities, women's mobility is often limited to shorter distance range, higher frequency, and slower adoption of improved means of transport. Through a case study of a road development project in Tshitwe, South Africa, Mahapa & Mashiri (2001) argue that, since women had limited access to the means of production but more responsibilities of household sustaining activities, their transport needs are often neglected by policy-makers, which in turn worsens their social exclusion. Focusing on the metropolitan area of Durban, South Africa, a study finds that gender differences in travel behavior are most evident among low-income groups, with the differences also increasing in communities more distant from the city center - women in rural localities have restricted access to car use, long travel distances to work, and higher travel times and costs, while women in the urban core have
very similar mobility patterns to men (Venter, Vokolkova, & Michalek, 2007).
Third, although there have been major public transport infrastructure developments in Gauteng Province, their effectiveness in improving accessibility and attractiveness for people to switch from driving have been criticized. For example, based on a trip rate model to predict
performance of the BRT system of Johannesburg and Gautrain in scenarios of planned network expansions, one study predicted that, although passenger volume will increase significantly, the modal share of the BRT and the Gautrain in total passenger-kilometers travelled will remain below 4% until 2040 (Bubeck, Tomaschek, & Fahl, 2014). Also looking at the BRT in
Johannesburg, using "access envelopes," an accessibility measurement developed specific for the South African context and focused on measuring affordable access to job opportunities, a study
predicted that introducing a BRT trunk route would hardly improve the current accessibility provided by the informal minibus-taxi network, and even under the best case scenario with fully integrated feeder routes, affordable job accessibility would only be modestly improved by 6% (Venter, 2016). Another study identified the effects of different factors on customer satisfaction and modal share of the Tshwane Bus Express in Pretoria, finding that reliability, security, and fare are important factors to both users and non-users of the service; users are more sensitive to climate control, payment method, and newspapers provision, while non-users are more sensitive to frequency and information provision (Mokonyama & Venter, 2013).
Fourth, since informal public transport is an important component of public transport in many cities of South Africa, the issue of regulating and formalizing services has also been discussed in multiple literatures. For example, both studies mentioned earlier on the Johannesburg BRT conclude with necessity to integrate the minibus-taxi network. From the perspective of
improving service attractiveness, Bubeck et al., (2014) argued that integration with the informal system will help increase modal share of the BRT and the Gautrain, whereas Venter (2016)
suggested from the perspective of affordability, fare integration with the minibus taxis is critical to maintaining affordable access for poor passengers, because in a scenario where the taxis are allowed to provide feeder services to the BRT without any fare integration, affordable access to jobs is likely to decrease. Reviewing previously failed state interventions in the minibus-taxi industry in South Africa, Venter (2013) argued that BRT provides opportunities for the minibus-taxi industry to go beyond its current state of stasis, by overcoming the constraints of informality and by opening up new markets. Venter (2013) also identified that success of this formalization process depends on some critical factors: 1) ensuring the financial attractiveness of the BRT participation for taxi operators to capture new scale economies in order to cut down operating
costs, 2) expanding taxi operators' markets beyond their traditional enclaves of captive users, and 3) securing an ongoing commitment from former taxi operators, especially those on the margins of the public transport market.
2.2 Public Participation in South Africa
Public participation is a relatively new concept in South African history. Before 1994, African, Colored, and Indian communities were excluded from meaningfully participating in decision making within state and government institutions or structures. Specifically, it was defined illegal for these communities to engage with decision-makers openly and gainfully by statutory
mechanisms such as the Group Areas Act and the Population Registration Act under the
apartheid government (Mbuyisa, 2013). Efforts to address these injustices and exclusion did not start until the transition to democracy reached the point of the 1994 elections, when the
Government of National Unity (GNU) was established. Since 1996, the Constitution guaranteed local government its own sphere of governance, and explicitly defined one of local government's objectives to be "to encourage the involvement of communities and community organizations in matters of local government".2 This section summarizes the current schemes of public
participation at the local level in South Africa from literature, and introduces the key issues related to public participation most discussed by scholars.
Aside from the constitutional assignment of the task of encouraging public participation to the local government, the legal framework of how this task turns into action at the local government level was further formulated by the Municipal Structures Act (1998) and the Municipal Systems
Act (2000). To facilitate the forms of participative democracy outlined in these Acts, the ward committee system was introduced, which has become the main form of public participation in local government. Wards are subdivisions of municipalities geographically defined for electoral purposes. Each municipality3 is divided into half the number of seats on the municipal council (rounding up if there is an odd number of seats). Each ward elects one ward councilor as the chairperson of the ward committee (Municipal Demarcation Board, 2016). Under this structure, half of the municipality council are elected directly from wards, while the other half of the municipality council are Proportional Representative (PR) councilors, who are elected through their party lists. All councilors are expected to make important decisions by voting in their municipality council on issues such as council resolutions, policy changes, the Integrated Development Plans (IDP) and annual budget.
Ward councilors serve a key role as the interface between the citizens they represent and the municipal officials who design and implement development policies. A ward councilor is responsible for raising concerns to the municipality council on behalf of her ward members, as well as ensuring the municipality implements policies to address the needs of citizens in her ward (Mbuyisa, 2013). The specific responsibilities of ward councilors include:
* giving ward residents progress reports explaining council decisions in committing resources to development projects and programs affecting them,
* assessing intended impact of municipality programs and plans,
3 There are 284 municipalities in total in South Africa, including 6 metropolitan municipalities, 47 district
municipalities, and 231 municipalities, after a rationalization process carried out by the Municipal Demarcation Board from 1999 to 2000.
* assessing whether services are being delivered fairly, effectively and in a sustainable way,
* determining whether capital projects are being rolled out in accordance with IDP,
* keeping in close contact with their constituencies to ensure that the council is informed of all issues on the ground, and
" conveying important information to residents from the council.
Since planning decisions regarding the BRT in Pretoria take place at the local government level (i.e., the City of Tshwane), the ward committee scheme is the main format of public participation specific to the BRT planning (Madumo, 2011). In addition, a public consultation meeting was also required held for each trunk or feeder route proposal by the City ("Stakeholder
Engagement," 2015).
Although the ward committee scheme for ensuring public participation around local issues at the municipality level is well defined, scholars have identified a number of issues with this scheme in practice. First, some have argued that marginalized communities are often neglected or unable to participate meaningfully in this scheme. For example, in rural communities, the ward
committees were not able to attract diverse, strong and effective participants, which resulted in a failure to achieve equity in representing all social segments and interests (Masango, 2008). As a result, in poorer communities, ward committees often have lower levels of education, which makes it difficult to have meaningful participation with knowledgeable municipal officials within the context of power imbalances (Mbuyisa, 2013). A case study in Johannesburg found that ward meetings in poorer areas are often dominated by questions about unrealized promises, and lists of demands that the municipality is expected to address, instead of raising needs and
concerns or reviewing proposed plans (Friedman, Hlela, & Thulare, 2005). Second, the planning process (specifically IDP) has been criticized for remaining highly top-down. For instance, the same Johannesburg case study points out that communities are merely allowed to comment on proposals developed by municipal officials rather than being invited to contribute to proposal content before its drafting (Friedman, Hlela, & Thulare, 2005). Third, logistical constraints also affect the effectiveness of public participation. For example, there is often a lack of technical skills to provide legal interpretation of documents and policy, and a lack of language skills to compile written submissions in ward committees, which result in compromised accuracy in the communication between municipality and ward members (Friedman, Hlela, & Thulare, 2005).
To sum up the literature reviewed in this chapter, inequitable public transport provision in South Africa has imposed financial burdens on, and barriers to economic opportunities for, low-income populations. Recently developed public transport systems have had limited effectiveness in improving accessibility and encouraging people to switch from driving. The planned BRT system in Pretoria could help provide an affordable commute option for marginalized low-income populations, but only with careful planning and design that accommodate the needs of different user groups. However, current public participation processes face barriers to equitable and effective participation and communication across social segments. This context provides an opportunity for testing CoAXs' usefulness in encouraging public engagement across different user groups and bridging the communication gap between the city and the public. The next chapter summarizes the previous uses of CoAXs and describes the development of a new version specific to the Pretoria context.
Chapter 3: Tool Development
3.1 Previous CoAXs Instances
CoAXs is a collaborative planning tool with a user interface and interactive visualizations. It was developed by a team at MIT to provide an opportunity for stakeholders to examine possible changes to current public transit networks and explore impacts of these changes in a
collaborative way. Through several years of evolution, CoAXs is now essentially a front-end
interface that receives users' modifications to transit scenarios, requests accessibility calculations
from the Conveyal Analysis/R5 back-end, and represents the results in the format of isochrones4 and related statistics of selected opportunities in catchment areas. Each new CoAXs instance can be built with input of three types of data specific to the context: Open Street Map (OSM)
network of the region, General Transit Feed Specification (GTFS) of the transit routes, and georeferenced data of opportunities (e.g., jobs). This section provides a summarized timeline of the evolvement of the tool.
The first version of CoAXs was developed by Anson Stewart in 2014, with the name "IBRT Accessibility", which was defined as a toolkit to foster deliberative participatory inquiry for incremental BRT projects and urban transportation planning (Stewart, 2014). Based on the Open Trip Planner (OTP) platform, which is an open source multimodal trip planning software5, the tool was developed with two modules - trip planning and analyst. The trip planning module generates suggested routings for a selected origin and destination pair, while the analyst module
' An isochrone is a line on a diagram or map connecting points relating to the same time or equal times. In the case
of CoAXs, an isochrone represents the area reachable from a given place within a given time constraint on a map.
depicts travel time isochrones from a given origin. The tool was tested in a focus group format in the contexts of Boston and Santiago de Chile. The study found that the tool helped make
accessibility metrics easily understandable, provided a platform for transportation and land use officials and community advocates to engage in constructive dialogue, and was effective in highlighting the equity implications of accessibility measures (Stewart, 2014).
In 2015, to allow for co-creative transit planning that engages stakeholders to assess different hypothetical transport scenarios, a corridor editor module was developed and added to the tool. It allow users to (de)activate routes and modify frequencies, dwell times, and other service
parameters (Stewart & Zegras, 2016). This version of CoAXs was tested in six workshops6 in Boston s Roxbury neighborhood to examine the potential of CoAXs for encouraging mutual learning about BRT impacts (Stewart, Zegras, Tinn, & Rosenblum, 2018). Using pre- and post-workshop surveys and video recordings, Stewart (2017) found that social learning was enabled by the ability to test and compare accessibility impacts from different locations relevant to different users.
To explicitly test the difference, to CoAXs users, of representing transit scenario benefits in terms of accessibility (isochrones) versus more traditional travel time savings, subsequent development of CoAXs added a point-to-point version showing travel time savings for specific origin-destination pairs. The two versions were tested to examine their differences in fostering shifts from initial expectations of impacts and increasing enthusiasm among users. In October 2016, four workshops were held in Boston in partnership with the LivableStreets Alliance7
6 In these workshops, CoAXs was tested in parallel with another tool called CityScope, which displayed localized impacts of BRT corridors using 3D models (Cheng, 2016).
exploring impacts of bus priority corridors identified by the Massachusetts Department of Transportation (MassDOT). This study found that users of the accessibility version had greater shifts away from their initial expectations of some impacts, and the accessibility version also helped foster greater focus on others' trips, although the point-to-point version was rated higher in terms of usability (Stewart, 2017).
In 2017, to explore potentials of expanding usage of CoAXs beyond focus group or workshop settings, the team developed a new version that could be used by individuals on their own. This "remote" version (with both accessibility and point-to-point capabilities) had a simplified
workflow and self-guided learning modules built in, and was tested in the contexts of Atlanta and New Orleans. Logs of user interactions with tool and survey results suggest that the self-learning process was effective but that the remote version's user-perceived usability and possibility for inspiring imagination were worse than those of the workshop approach (Zheng, 2018).
In June 2017, CoAXs was brought back to the international context of Santiago de Chile, with the addition of accessibility statistics for multiple opportunity types, including jobs, education
and health care. Although deployed in workshops, the Santiago instance was developed based on the remote version for its simplicity, using only the accessibility version. The two workshops held in Santiago de Chile revealed that CoAXs was able to improve the engagement process and
encourage metropolitan-level discussions among decision makers and stakeholders (Navas Duk, 2017).
3.2 Capabilities Definition for the Pretoria Instance
Based on findings from the preceding studies and the specific context of Pretoria, we selected tool capabilities for the Pretoria instance as described below.
First, the accessibility version was selected over the point-to-point version. In previous experiments, the point-to-point version was rated better in terms of usability, an unsurprising result due of its strong similarities with widely used online trip-planning tools that the users are more familiar with (Stewart, 2017). Nonetheless, the accessibility version had greater impacts on the users in terms of shifting away from their initial expectations and thinking more about others' trips. These impacts are more relevant to our study in Pretoria of changes in user perception and empathy building between different user groups. Moreover, the demonstrated effectiveness of the accessibility version in encouraging higher-level scale discussions (Navas Duk, 2017) also justifies this selection, since helping people have a metropolitan level understanding of the impacts is also an important objective of the Pretoria experiment.
Second, the scenario modification capability for the Pretoria instance primarily focuses on selection of proposed routes. Given the fact that controversies around the proposed routes are mostly about street configuration along the trunk routes and the geographic layout of the feeder routes, we decided it was necessary to allow users to modify scenarios by selecting any
combinations of proposed trunk and feeder routes, instead of selecting from a set of pre-defined scenarios. Furthermore, since discussions around the BRT extension have not reached the operational parameters, e.g., headways and dwell times, we opted to not provide the options for modifying these parameters in the Pretoria instance.
Third, for the accessibility representation, we chose to use jobs as the only type of opportunities presented in the Pretoria instance. Since the primary purpose of introducing BRT into the city's public transport system was to provide an affordable alternative for commuting, we considered accessibility to jobs as the most relevant parameter to be represented.
We also explored possibilities of adding other capabilities to the Pretoria instance, but eventually did not include them due to technical and data constraints. First, considering public transport affordability is a serious issue in South Africa, we hoped to add the capability to show cost-constrained isochrones in addition to the time-cost-constrained isochrones from a given origin point. Development of this feature requires: 1) travel cost information accurately built in the input GTFS files, and 2) backend calculation for trips from the given origin point generating a travel cost surface' that can be used to generate cost-constrained isochrones. It is easy to build the distance-based fare structure into the GTFS files, however, the backend capability to calculate travel cost surfaces was not developed as of April 2018. Also, since the surroundings of the proposed Line 2B trunk route are more affluent areas, travel cost is not the most pressing concern for the potential users of this particular line. Therefore, development of this capability was not prioritized for the Pretoria instance.
In addition, we would have liked to enable travel time comparisons between private vehicles and the BRT for the Pretoria instance, since this would provide an intuitive visualization of the benefits of BRT on a dedicated bus lane during peak hour congestions. Nonetheless,
development of this capability would require: 1) simulated or surveyed automobile travel time matrices for the region, and 2) the capability to calculate isochrones on the basis of these travel
' A travel cost surface is a raster of travel costs from the selected origin to the rest of the region. Current generation
time matrices. Currently, the isochrones from a given origin are calculated from a series of binary regular grids, which are generated from the travel time surface9 for a given origin. Each binary regular grid represents whether a point can be reached or not within a given time
constraint from the origin.10 The isochrone calculation from a binary regular grid is performed on the front-end", and the conversion from travel time matrices to travel time surfaces and
corresponding regular grids is fairly easy in terms of programming. Therefore, travel time matrices can be converted to binary regular grids separately, and these regular grids can be loaded directly on the front-end, to achieve fast calculation of private vehicle isochrones on-the-fly. However, development of this feature was constrained by the fact that auto travel time matrices during peak hours were not available.
3.3 Development and Adaptation for the Pretoria Instance
3.3.1 Scenarios Definition
As introduced in Subsection 1.1.2, two scenarios for the Line 2B trunk route are under
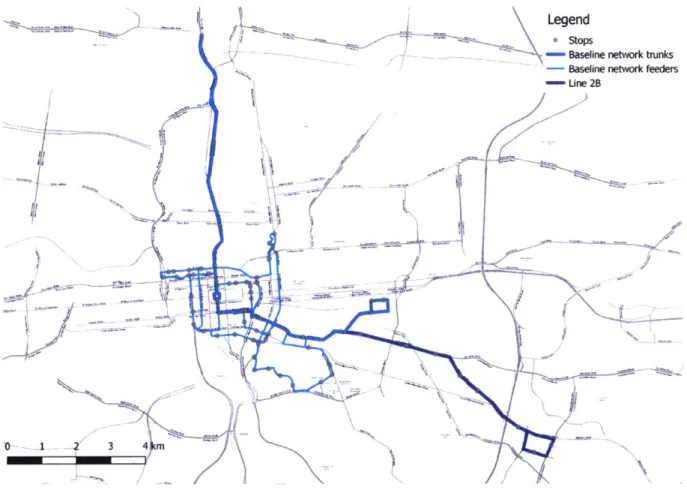
consideration - BRT operations in mixed traffic or on additional dedicated bus lane. In addition, we have a baseline, status quo, scenario, i.e., no Line 2B (Figure 2).
9 A travel time surface is a raster of travel times from the selected origin to the rest of the region, see
http://docs.analysis.conveyal.com/en/dev/analysis/.
1 Imagine a series of planes cutting through a surface, generating areas on the plane that are either covered under
the surface or exposed.
" An isochrone is generated from a binary regular grid using a front-end package called jsolines, see https://2ithub.com/conveyal/isolines.
'Legend
- ' stops
-Baseline network trunks
Baseline network feeders
/m- Une 2B
Figure 2. Map of baseline scenario and Line 2B trunk route
Figure 3 illustrates the street configurations of the trunk route scenarios along Lynnwood Road. The current street consists of two general traffic lanes in each direction, and a shared turning lane in the middle, with parking on sidewalks. For the mixed traffic scenario of the Line 2B addition, parking spaces will be removed at places where BRT stations need to be located, and buses will travel on the general traffic lanes with all other vehicles. For the dedicated bus lane scenario, parking spaces on each side will be removed while the sidewalk will remain, and a bus lane dedicated to the BRT and separated from general traffic lanes by barriers will be added. There are two options for the dedicated bus lane addition: 1) the bus lane located along the sidewalk of each direction, with open bus stations located on the sidewalks; 2) the bus lane located on the center side of each direction, with closed bus stations located on the median.
(a) Existing Lynnwood Road
(c) Line 2B -Dedicated lane scenario (option 1) (d) Line 2B -Dedicated lane scenario (option 2)
Figure 3: Schematics of trunk route scenarios
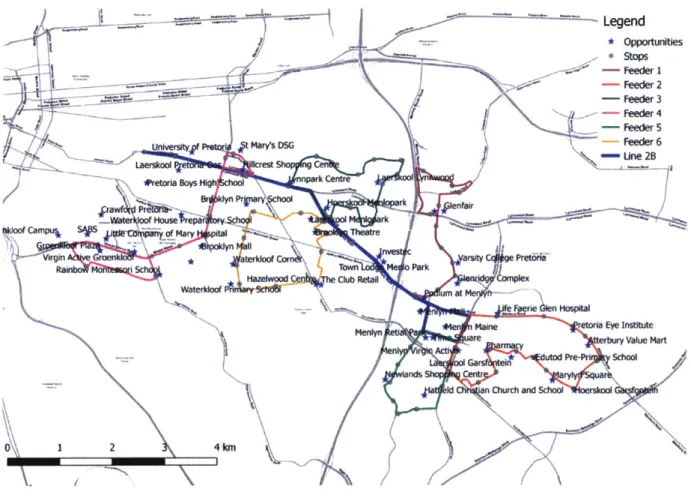
Beyond the two possible street configuration scenarios for the Line 2B trunk route, interest in exploring possible feeder routes for Line 2B was also raised in discussion between the local CoAXs team and city officials. Subsequently, the local team created six hypothetical feeder routes based on their knowledge of the surrounding neighborhoods and the existing feeder routes
for Lines IA and 2A (Figure 4).
-.-..---- Legend * Opportunities Stops -- - Feeder I --- -- - Feeder 2 .- - - '-- -- Feeder 3 -... -- ---eeder 4 -Feeder 5
Une t Mar's DSG Feeder 6
Laerskool llcrest Cna mUe2
F retoria Boys Hig paderte
P" rk fair
Car pur is n of Mary Ital Theatre
rgin aL ru u narsity C nPretaria
Rain TonPark
Hazelwood Club Retail X
Wateko urn at
- len Hospital
Maine retoria Eye Institute
uare basl beryeValue Mart
totalAct numbe of cearis ri
Ga I Schoo2
rids Cen
'~ Ch 'n Church an~d Scoln
0 1 2 4 kin
Figure 4: Map of hypothetical feeder routes and places of interest in context
For the Pretoria instance of CoAXs, we allow users to select any combination of the six feeder
routes as long as either of the Line 2B trunk route scenarios is selected. In each case, the number of scenarios of feeder route combination n can be calculated as
6
n = y = 2 6 = 64
-r=O
Since there are two trunk route scenarios with Line 2B, in addition to a baseline scenario, the total number of scenarios N is
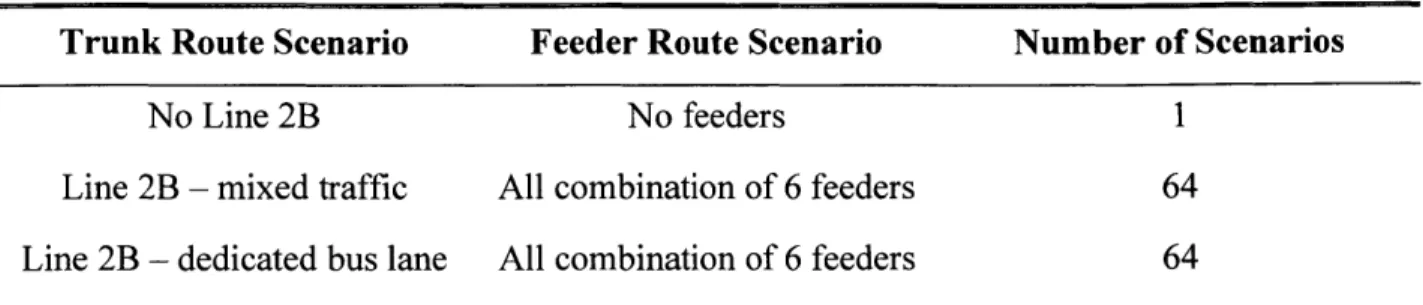
Table 1 summarizes the scenarios.
Table I. Summary of scenarios
Trunk Route Scenario Feeder Route Scenario Number of Scenarios
No Line 2B No feeders 1
Line 2B - mixed traffic All combination of 6 feeders 64
Line 2B - dedicated bus lane All combination of 6 feeders 64
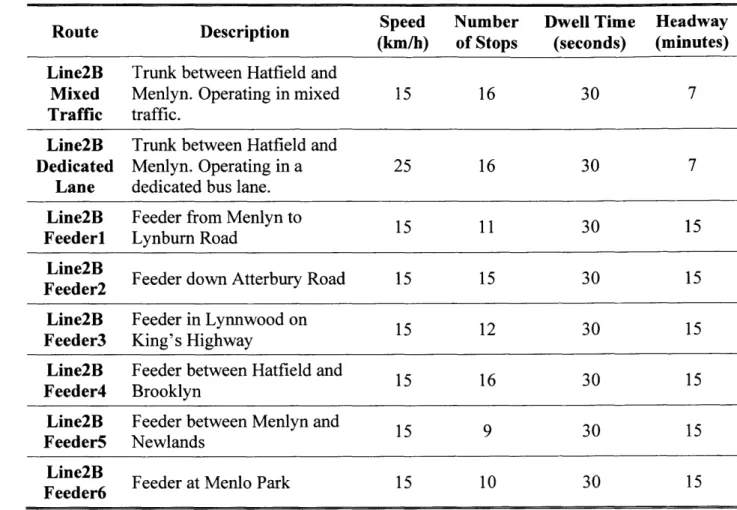
3.3.2 Route Specifications and Assumptions
For simplicity and clarity, we made the following assumptions when defining route
specifications. First, since the benefits of a BRT operating on a dedicated lane are most evident when traffic is most congested, we make all the calculations based on travel speeds during morning peak hours, which is from 6am to 9am on weekdays. Second, since travel time matrices for the surrounding area of proposed Line 2B was not available, and the capacity and travel demand of Lynnwood Road are comparable to those of the roads where Line 1 A and Line 2A operate, we assume that the average travel speed of BRT in the dedicated bus lane scenario is similar to the average travel speeds of Line 1 A and Line 2B. Third, for the feeder routes and the mixed traffic scenario of the trunk route, we assume that the BRT travel speeds are similar to the travel speeds of the existing feeder routes for Line 1 A and Line 2A. Fourth, we assume that the morning peak frequencies of the proposed trunk route and feeder route buses are the same as those of the existing ones.
Using actual operational records from March 2016 for Line 2A, we calculated the morning peak hours average speed as 25 km/h. Using timetables of the existing feeder routes for Line 1A and
Line 2A, we calculated the average speed as 15 km/h. Table 2 lists specifications of the existing routes in the baseline scenario based on morning peak timetables.
Table 2: Specifications of baseline routes
Route Description Speed Number Dwell Time Headway
(km/h) of Stops (seconds) (minutes)
LinelA Trunk between CBD and 25 11 30 7
Pretoria North
Trunk between Molefe Makinta
Line2A Station and General M. 25 19 30 7
Siyothula Station
Existing Feeder between Ruth Mompati 15 11 30
7 Feederi Station and Steve Biko Hospital
Existing Feeder route between Mahatma
Feedext4 Gandhi Station and TUKS 15 15 30 7
Groenkloof
Existing Feeder between Nana Sita 15 23 30
7 Feeder5 Station and Belle Ombre
Existing Another feeder route between 15 25 30 7
Feeder6 Nana Sita Stn and Belle Ombre Existing Another feeder between
Feedexi7 Mahatma Gandhi Station and 15 13 30 7
TUKS Groenkloof
Based on the aforementioned assumptions, Table 3 provides the specifications for the proposed trunk and feeder route scenarios.
Table 3: Specifications ofproposed routes
Route Description Speed Number Dwell Time Headway
(km/h) of Stops (seconds) (minutes)
Line2B Trunk between Hatfield and
Mixed Menlyn. Operating in mixed 15 16 30 7
Traffic traffic.
Line2B Trunk between Hatfield and
Dedicated Menlyn. Operating in a 25 16 30 7
Lane dedicated bus lane.
Line2B Feeder from Menlyn to 15 11 30
15
Feederi Lynburn Road
Fende2 Feeder down Atterbury Road 15 15 30 15
Line2B Feeder in Lynnwood on 15 12 30
15
Feeder3 King's Highway
Line2B Feeder between Hatfield and 15 16 30
15
Feeder4 Brooklyn
Line2B Feeder between Menlyn and 15 9 30
15
Feeder5 Newlands
Feeder Feeder at Menlo Park 15 10 30 15
3.3.3 Data Requirements and Preparation
As introduced in Section 3.1, each new CoAXs instance requires three types of data for the specific context to be developed: the OSM network for the region, the GTFS for the transit routes, and georeferenced data of opportunities.
OSM provides open source georeferenced data around the world, including road and walking path networks. The OSM extract of the Greater Pretoria region is available for download in Protocolbuffer Binary Format (PBF), which is readable by Conveyal for back-end calculations.
GTFS information for Pretoria is not available from the city or the transit agency. Therefore, for the purpose of this experiment, we created the GTFS feeds of the existing and proposed BRT routes with GTFS Editor, using the specifications in Table 2 and Table 3. The georeferenced geometries and stops of the proposed trunk route are drawn based on the public proposals, and those of the proposed feeder routes are drawn based on the local team's hypothetical proposal.
For the Pretoria instance, the opportunity data refer to Geographic Information Systems (GIS) data of job locations in the region. We obtained the data in shapefile format from the Council for Scientific and Industrial Research (CSIR) of South Africa. This dataset represents number of jobs in the 243 Transport Analysis Zones (TAZs) of Tshwane in 2014. It includes jobs in sectors
of retail, office, industrial, commercial, local services, agriculture and mining, construction, transport, domestic workers, and others. For this experiment, we use the total number of jobs for the calculation. Figure 5 shows the distribution of total number of jobs across TAZs in Tshwane (divided into quantiles).
/
~7IL I f /i MJ -5 0Figure 5: Choropleth map of total number ofjobs in Tshwane by T AZ
3.3.4 Back-end Configuration Legend - Line 28 Total Jobs 0 -0416 416-1396 1396-2407 2407 -4742
m
4742-35760 5 10 15 20 kmDevelopment of the Pretoria instance involved back-end configurations made through Conveyal Analysis UI, which is Conveyal's front-end for creating and modifying scenarios.12 With the three types of data uploaded, we created two scenarios in Conveyal Analysis, referred to as Scenario 1 and Scenario 2. Scenario 1 represents the baseline scenario described in Subsection 3.3.1, i.e., without Line 2B or feeders. Scenario 2 is the new scenario that users can modify and compare with the baseline scenario.
We also created a series of eight modifications in Conveyal Analysis, each removing one of the proposed routes - Line 2B trunk mixed traffic, Line 2B trunk dedicated lane, and each of the six Line 2B feeders. By default, all modifications are active in both scenarios, so that both scenarios on the front-end represent the baseline scenario upon initial loading of each session. Through users' interactions on the CoAXs front-end, all modifications remain active in Scenario 1, and get toggled between active and inactive in Scenario 2. Therefore, Scenario 1 always represents the baseline scenario, while Scenario 2 gets modified with routes selected by users.
3.3.5 Front-end Modification
We used the CoAXs "remote" version as the basis of the front-end development, due to its simplified workflow and updated framework.13 Through tests with local internal users, three
types of modifications were made to develop the front-end for the Pretoria instance. First, to make it suitable for a workshop setting, the landing page with tutorial videos, step-by-step guidance, and built-in surveys were removed. Second, to make the interface specific to the
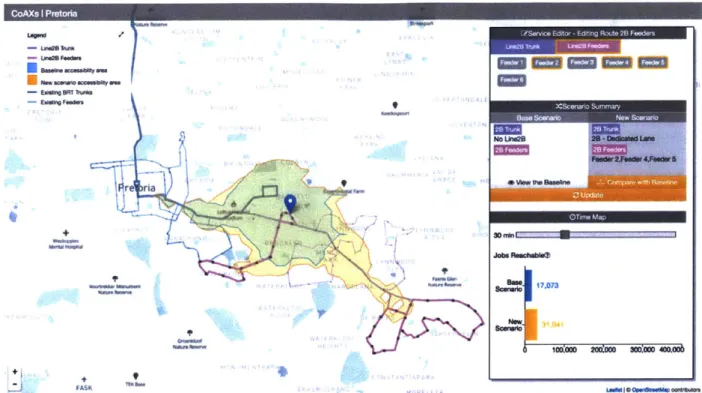
structure of the scenarios, the Service Editor panel was updated to allow for multiple selection of feeder routes only when one of the two trunk route scenarios is selected. Third, to help users find locations on the map, major points of interest, such as landmarks, institutions, public amenities, etc., were added to the map. In addition, due to back-end upgrades made by Conveyal, requests to the back-end with modified scenarios were made through Application Programming Interface (API) calls, a more common and formalized way to integrate the front-end and back-end. Figure 6 shows a screenshot of the CoAXs Pretoria interface.
a/ gnewbWm" aEyie
UM
*
W
Em -Emr
VAR rw ia "Iw ft i N 9tNA VOMM*6m A;AY#P0 ,c FASKFigure 6: Screenshot of CoAXs Pretoria
The interface for the Pretoria instance remains similar to the previous "remote" version, with a map as the main component that has a movable pin representing the user-selected origin point of isochrones. A panel on the right-hand side has a scenario editing area, a scenario summary table, a slider for setting the time constraint, and a bar chart area showing the scenario results in accessibility statistics (from top to bottom in Figure 6). The isochrones are recalculated either when a user clicks the "Update" button or moves the origin pin.
No Unk2B 28 -Dedtd LMW 30000 min-030 0040 Jobs PRahM =1, 17.073 NOW SOuMID 100:oo 200:= 3WEAD 4W LafI1 OPPes~ft crftwn CoAXs I Pretoria yfto
Chapter 4: Experiment Design
With the CoAXs instance developed specifically for the Pretoria context as described in the preceding chapter, four workshops with local residents were held in July 2018, in partnership with the University of Pretoria. These workshops were designed drawing from the experiences of previous workshops in Boston and Santiago de Chile, with modifications according to the
Pretoria context. This chapter provides detailed information on how these workshops were organized, including general information (Section 4.1), workshop activities (Section 4.2), and data collection methods (Section 4.3)
4.1 Workshops Overview
Some of the general arrangements of the workshops were the same across all four workshops, while some varied. These arrangements are introduced in the following subsections.
4.1.1 Common Arrangements: Scheduling, Staff, and Setup
In terms of scheduling, the four workshops were scheduled on evenings of four separate weekdays over two weeks - two in the first week and two in the second week. Each workshop took approximately three hours, following the same agenda (Table 4) that will be discussed in detail in Section 4.2.
All four workshops had similar staff arrangements, including two presenters introducing the tool and background information, two facilitators for the discussion session, and two other staff members in charge of reception, room setup, food, survey distribution and collection, etc. The two presenters were also present at the scenario analysis session to provide guidance for user
interaction with the tool. The facilitators were doctoral students recruited from the sociology department at the University of Pretoria, so that facilitation during the discussion session was provided by an impartial third-party.
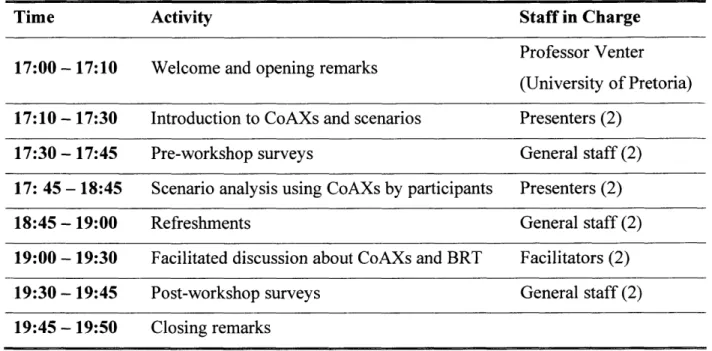
Table 4: Workshop agenda and staff arrangement
Activity S
Time taff in Charge
Professor Venter 17:00 - 17:10 Welcome and opening remarks
(University of Pretoria) 17:10 - 17:30 Introduction to CoAXs and scenarios Presenters (2)
17:30 - 17:45 Pre-workshop surveys General staff (2)
17: 45 - 18:45 18:45 - 19:00 19:00 - 19:30
19:30 - 19:45 19:45 - 19:50
Scenario analysis using CoAXs by participants Refreshments
Facilitated discussion about CoAXs and BRT Post-workshop surveys Closing remarks Presenters (2) General staff (2) Facilitators (2) General staff (2)
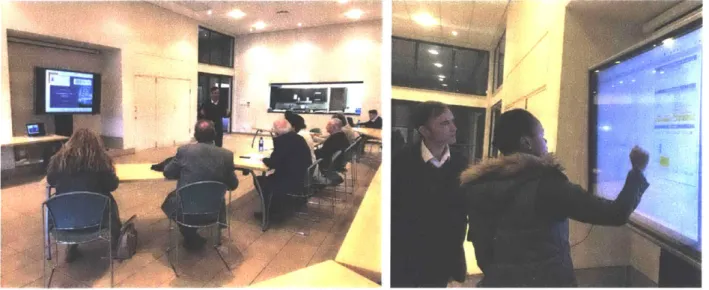
As for room setup, in each workshop, a 60-inch touch screen was used for group interaction with the tool. The touch screen was placed in a vertical position so that all participants around it could see the contents well. In the last two workshops, an additional option of individual interaction with the tool on a laptop was provided.'4 Participant seating was arranged in a row of table and
chairs in an enclosing format facing the touch screen, which was also used for the presentation. The participants were asked to leave their seats and gather around the screen during the scenario
" This option was not provided in the first two workshops because the internet bandwidth at the venue of the first
two workshops did not allow for multiple instances running simultaneously, which was an unexpected practical constraint.
analysis session. Figure 7 shows the setup at the first workshop, including seating layout during presentation (left) and scenario analysis session at the touch screen (right).
Figure 7: Workshop setup
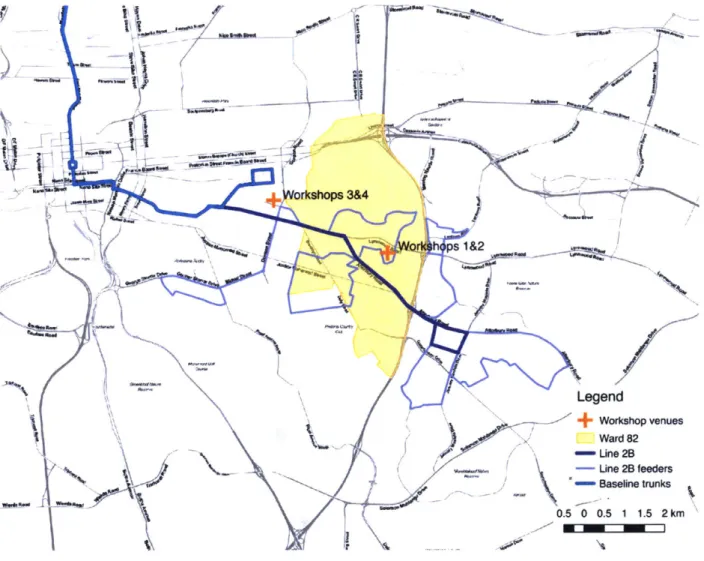
4.1.2 Arrangements Specific to User Groups: Venues and Participant Recruitment
To test the research questions and hypotheses in Section 1.2, the workshops targeted two main groups of participants: 1) residents in the surrounding neighborhoods of the Line 2B trunk route, who are mostly private vehicle users; and, 2) students and young professionals in the
surrounding area, who are mostly public transport users. The first two workshop targeted the first group, and the last two targeted the second group. Therefore, the two sets of workshops took place at different venues and used different participant recruitment channels.
Venues for both sets of workshops were community churches. The first two workshops took place in a residential neighborhood closer to the Menlyn end of Line 2B trunk, while the last two took place in the student area in Hatfield close to University of Pretoria (Figure 8). Participants