HAL Id: hal-00404384
https://hal.archives-ouvertes.fr/hal-00404384
Submitted on 16 Jul 2009
HAL is a multi-disciplinary open access archive for the deposit and dissemination of sci-entific research documents, whether they are pub-lished or not. The documents may come from teaching and research institutions in France or abroad, or from public or private research centers.
L’archive ouverte pluridisciplinaire HAL, est destinée au dépôt et à la diffusion de documents scientifiques de niveau recherche, publiés ou non, émanant des établissements d’enseignement et de recherche français ou étrangers, des laboratoires publics ou privés.
To cite this version:
F.A. Miannay, A. Bányász, T. Gustavsson, D. Markovitsi. Excited States and Energy Transfer in G-Quadruplexes. Journal of Physical Chemistry C, American Chemical Society, 2009, 113 (27), pp.11760-11765. �10.1021/jp901839x�. �hal-00404384�
Excited states and energy transfer in G-quadruplexes
François-Alexandre Miannay, Akos Banyasz, Thomas Gustavsson and Dimitra Markovitsi*
Laboratoire Francis Perrin, CEA/DSM/IRAMIS/SPAM - CNRS URA 2453, CEA Saclay, 91191 Gif-sur-Yvette, France
Abstract
DNA nanostructures formed by association of four oligonucleotides d(TGGGGT) (TG4T quadruplexes) are studied by steady-state and time-resolved optical spectroscopy with femtosecond resolution using fluorescence upconversion. A comparison between single-stranded and four-single-stranded structures and the corresponding stoichiometric mixture of non-interacting nucleotides shows how horizontal and vertical organization affects the properties of the excited states. Emission from guanine excimers is observed only for single strands, where conformational motions favor their formation. Quadruplex fluorescence arises from a multitude of excited states generated via electronic coupling between guanines; the average fluorescence lifetime is longer and the fluorescence quantum yield higher compared to those of non-interacting nucleotides. The fluorescence anisotropy recorded on the sub-picosecond time-scale, where molecular motions are hindered, reveal that energy transfer takes place among the bases composing the nanostructure. These results are in line with the conclusions drawn from similar studies on model DNA duplexes.
Introduction
G-quadruplexes are four-stranded DNA strucures in which the repetitive motif is the guanine tetrad resulting from association of four guanines via Hoogsteen hydrogen bonds, 1,2
as shown in Figure 1. Such structures are encountered in guanine rich telomeric ends of eukaryotic chromosomes; they are related to biological functions and constitute targets for anticancer therapy.3-5 Moreover, G-quadruplexes are considered as promising building blocks
for applications in the field of nanotechnology6,7 and medicinal chemistry.8-10 Fluorescence
methods, including resonance energy transfer, have been widely used to study structural and functional aspects of G-quadruplexes,3,11,12 as well as their interactions with various agents.13
In all these investigations, the emission of a fluorescent label is probed. However, self-associated guanine assemblies do emit light at room temperature albeit with a very low fluorescence quantum yield, of the order of 10-4.14,15 The study of the intrinsic fluorescence of
G-quadruplexes contributes to elucidate the fundamental processes preceding photochemical reactions responsible for carcinogenic mutations16,17 and may provide a basis for
nanobiophotonic devices. Figure 1
In the present communication, we report the fluorescence properties of G-quadruplexes formed by the hexadeoxynucleotide d(TGGGGT), noted hereby as TG4T, in the presence of sodium ions. In contrast to the previously examined systems, composed solely of guanine stretches GGG14 or GGGG15 which may lead to the formation of long wires,
oligonucleotides in which the guanine stretch is terminated in both sides by a thymine residue give rise to well defined four-stranded nanostructures.18,19 In order to reveal the particular
features due to the G-quadruplex structure, we compare their optical properties with those of non-interacting nucleotides, thymidine monophosphate (TMP), 2-deoxyguanosine monophosphate (dGMP) and the corresponding stoichiometric mixture [(dGMP)/(TMP) = 2]
on the one hand, and with those of single strands on the other. First, we examine the steady-state absorption and fluorescence spectra with the objective to detect the fingerprint of the various types of electronic coupling. Then we turn to femtosecond time-resolved measurements using fluorescence upconversion. We present fluorescence intensity and anisotropy decays providing information about excitation energy transfer. We discuss our results in connection with previous studies performed for DNA double strands using the same methodology.20-24
Experimental details
Preparation of the solutions.
Nucleotides, dGMP and TMP, were obtained from Sigma Aldrich and were dissolved in ultapure water where no aggregation was detected at concentrations used in the present experiments. The oligonucleotide TG4T was purchased from Eurogentec and was dissolved either in phosphate buffer (pH=6.8; 0.15 M NaH2PO4,0.15 M Na2HPO4) or in NaCl aqueous solution with the same ionic strength as the phosphate
buffer. Upon dissolution of TG4T (10-3 M in single strand), the G-quadruplex was formed
quasi instantaneously. The absorption spectra obtained immediately after dissolution, after maintaining the solution at 4 °C during 12 h and several days later were practically identical. Subsequently, absorption spectra of diluted solutions were recorded on the 220-360 nm range as a function of temperature from which melting curves were derived (Figure 2). Full heating and cooling cycles were performed allowing the sample to reach equilibrium at each temperature during 10 min. Upon increasing temperature, the absorbance at 295 nm was decreased by 30% reaching a minimum value at 72 °C and subsequently it increased slightly. Upon cooling, a quasi linear decrease was observed down to 20 °C. Such a pattern is typical of the melting of TG4T quadruplexes.25 Solutions of single strands were prepared via heating
Melting curves and steady-state spectra of single strands were obtained for concentrations of ca. 4x10⁻⁵ M per base. Time-resolved measurements of G-quadruplexes were performed for concentrations of ca. 8x10⁻⁴ M per base. As these measurements are quite long, single-strands eventually self-associated; therefore, no reliable results could by obtained by this technique.
Figure 2
Absorption and fluorescence spectra obtained in phosphate buffer and NaCl solutions were identical; NaCl solution were used for the determination of the fluorescence quantum yields (Φ) necessitating very low solute concentrations because the phosphate buffer exhibits a weak emission.
Apparatus and methods.
Steady-state absorption and fluorescence spectra were recorded with a Perkin-Elmer Lamda 900 and a SPEX Fluorolog-3 spectrofluorometer, respectively, according to the procedure described previously.26 Emission spectra werecorrected for the spectral response of the detection system. Fluorescence quantum yields were determined using TMP in water as a reference. During both absorption and fluorescence measurements the temperature of the solutions was controlled by a Huber CC3 apparatus with a precision of ± 0.1°C. Ultrapure water was delivered by a MILLIPORE (Milli-Q Synthesis) system.
The fluorescence upconversion setup is described in detail elsewhere.26-28 Briefly, the
excitation source was the third harmonic of a mode-locked Ti-sapphire laser (50 mW at 267 nm) operating at a repetition rate of 76 MHz. Temporal scans were made over a 10 ps time
window at 310, 330, 360 and 420 nm in both parallel (Ipar) and perpendicular (Iperp) excitation
and detection configurations, by controlling the polarization of the exciting beam with a half-wave plate. The total fluorescence decays F(t), designated hereafter simply as “fluorescence
+ 2Iper(t) and r(t) = [Ipar(t) - Iperp(t)]/[Ipar(t) + 2Iperp(t)], respectively. The apparatus function was
ca. 330 fs (fwhm) at 330 nm and it decreased slightly with increasing wavelength. The time-resolution of our setup is judged to be 100 fs after deconvolution.
The 267 nm beam diameter was measured to be about 30 µm at the surface of the cell giving an irradiance of ca. 500 MW/cm2.. About 25 mL of solution were kept flowing through a 0.4 mm quartz cell (optical density: 0.25 ± 0.05 at 267 nm), which was in continuous motion perpendicular to the excitation beam to avoid artifacts due to photodamage.29 It was
particularly important to respect this condition because guanine runs are known to be more sensitive than other DNA sequences versus ionization at 267 nm.30 At each wavelength, 10
parallel and 10 perpendicular decays were recorded successively. In the successive recordings no alteration of the signals was detected. Subsequently they were merged in order to decrease the noise of the signal. The time-resolved measurements were carried out at 20 ± 1°C.
Results
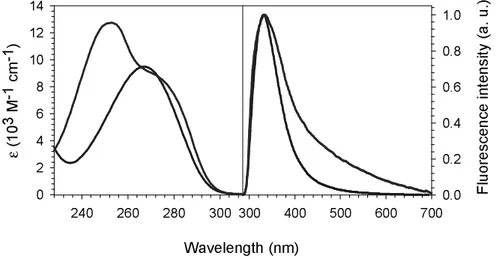
Before presenting the results obtained for TG4T we recall the properties of the isolated monomeric constituents TMP and dGMP, described in detail in reference 26. Figure 3 shows the absorption and fluorescence spectra of these nucleotides. In the case of dGMP, the absorption band around 260 nm corresponds to two electronic transitions, S0→ S1 and S0 →
S2, whereas only one transition contributes to the absorption of TMP in this area.31 The dGMP
and TMP fluorescence emission spectra do not vary with the excitation wavelength. They peak respectively at 334 and 330 nm, the dGMP spectrum being characterized by a red wing extending up to 700 nm. The fluorescence quantum yield of dGMP (1.1x10⁻⁴) is lower than
that of TMP (1.5x10⁻⁴). Their fluorescence decays on the femtosecond time-scale with
average lifetimes of 0.34 ps (dGMP) and 0.50 ps (TMP). Figure 3
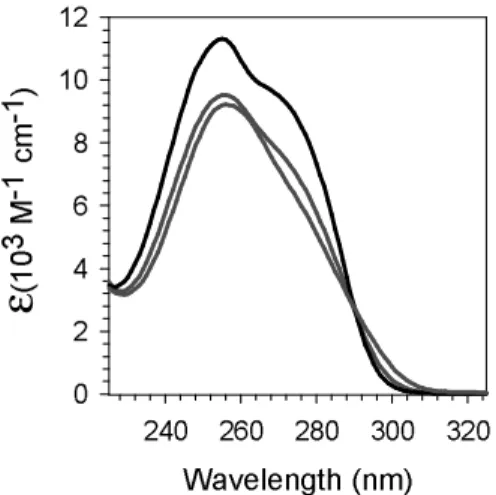
The absorption spectra of single-stranded and four-stranded TG4T recorded at 20°C are presented in Figure 4 together with the spectrum of the corresponding stoichiometric mixture of dGMP and TMP. The maximum molar absorption coefficient (εmax) of the
quadruplex spectrum was derived from that of the single strand provided by Eurogentec. For comparison, the ε values are given per base.
Figure 4
Three main changes are observed in the absorption spectra when going from non-interacting chromophores to the single strand and further to the G-quadruplex. The εmax
decreases by 16%. The shoulder around 275 nm becomes less and less visible. A hyperchromism appears in 290 - 310 nm region.
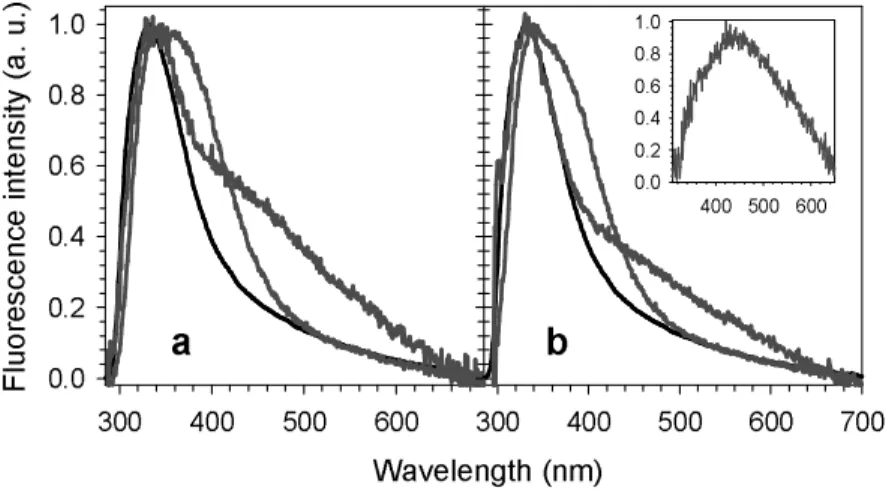
Figure 5 shows the effect of the molecular organization on the fluorescence spectra of TG4T recorded following excitation at 255 and 267 nm. The positions of the fluorescence maxima λmax and the fluorescence quantum yields are given on Table 1.
Figure 5
Despite the different shapes of dGMP and TMP fluorescence spectra (Fig. 3), those corresponding to the stoichiometric mixture do not present any significant change with the excitation wavelength. This is due to a subtle interplay between absorbed photons and quantum yields. For both the examined wavelengths, the same fluorescence maximum (333 ± 1) nm and the same fluorescence quantum yield (1.2±0.1x10⁻⁴) were found. Exactly the same
Φ was determined for single-stranded TG4T whose main emission band (7000 cm-1 fwhm), after normalization, practically overlaps that of the non-interacting chromophores. However, at longer wavelengths, an important shoulder is present in the spectra of the single strand. Its relative intensity with respect to that of the main peak is higher for excitation at 255 nm compared to excitation at 267 nm.
The long wavelength shoulder is completely absent from the quadruplex spectra which overlap those of non-interacting chromophores between 500 and 700 nm. The arrangement of the bases in a four-stranded structure induces an increase in the fluorescence quantum yield by a factor of 2.5. Moreover, it affects the main emission band which becomes broader (8000 cm-1 fwhm), red-shifted and clearly inhomogeneous. Excitation at 255 nm gives rise to a
rather flat peak extended from 338 nm to 350 nm, whereas upon excitation at 267 nm we observe a sharp peak at 341 nm and a shoulder around 370 nm.
Figure 6
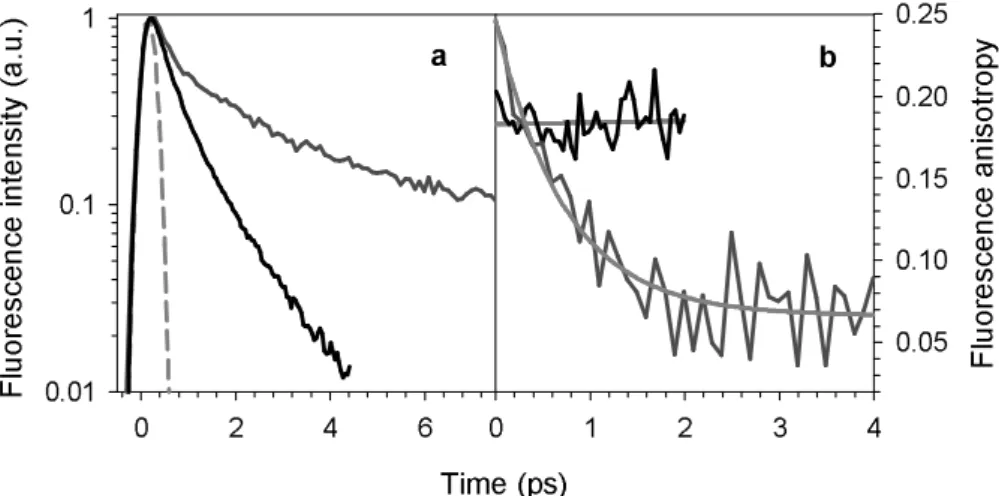
The fluorescence decays recorded for four-stranded TG4T between 310 and 420 nm are longer than those corresponding to the stoichiometric mixture of non-interacting chromophores at the same wavelength. The decays obtained at 360 nm are presented in Figure 6a.
Figure 7
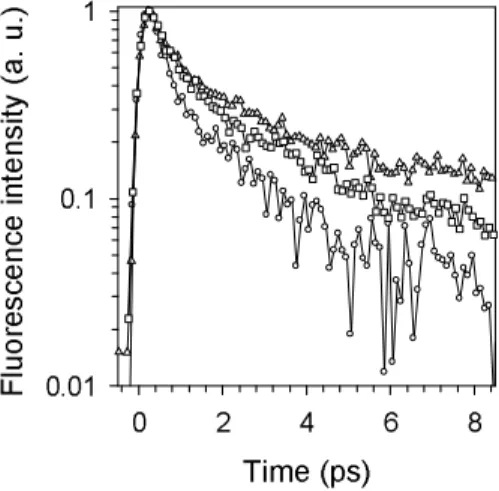
The fluorescence decays of the TG4T quadruplex vary substantially with the emission wavelength as can be seen in Figure 7. In order to describe them in a quantitative way we performed a non-linear fitting/deconvolution procedure using tri-exponential functions, F(t)=
∑
=3 − 1 ) / exp( i i i ta τ , convoluted with the Gaussian apparatus function. The time constant τ3 was
fixed to 20 ps in order to reproduce the long tail which could not be precisely determined by fluorescence upconversion due to its weak intensity. The fitting parameters as well as the
average decay time, defined as
∑
∑
= = = 3 1 3 1 i i i i i a aτ τ where
∑
= = 3 1 1 i ia , are given on Table 2. Table 2
It is unlikely that the τ1 and τ2 time constants reported on Table 2 correspond to
precise emitting species. As a matter of fact, two time constants are already needed to fit the fluorescence decays of TMP (0.21 and 1.07 ps) and two others to fit the decays of dGMP
(0.20 and 0.79 ps).26,27 In contrast, the average decay times, ranging from 1.21 to 3.50 ps,
allow a rough comparison with the decays of other systems.
The fluorescence anisotropies determined for the TG4T quadruplex and the stoichiometric mixture of non-interacting nucleotides at 360 nm are presented in Fig. 6b. The signal corresponding to the nucleotide mixture remains constant over 2 ps and is equal to 0.18, as derived from a fit with a linear function. The zero-time fluorescence anisotropies r0
reported for dGMP and TMP are 0.36 and 0.13, respectively.26 The anisotropy of the
quadruplex at zero time is higher than that of the monomer mixture and dwindles down to 0.07 at long times. Although the quadruplex anisotropy decays recorded at 330, 360 and 420 nm appear to be quite similar, their fit with mono-exponential functions r(t) = r∞+a·exp(-t/τr)
reveals some subtle differences. The results of the fits are presented on Table 3. The anisotropy signal at 310 nm was too noisy to be fitted; its initial value r0 was 0.26 ± 0.1 as the
values derived from the fits of the signals at 330 and 360 nm. A slightly lower r0 value
(0.22±0.01) was determined at 420 nm. Upon increasing the emission wavelength, τr
increases and r∞ decreases.
Table 3
Discussion
The spectra presented in the previous section clearly show that the properties of the TG4T excited states depend on the type of the molecular organization. A schematic illustration of the geometries corresponding to the single and quadruple helices is shown in Figure 8. The stacked structure of the single strand is deduced from the observation that its absorption spectrum differs considerably from that of non-interacting chromophores. No structural information regarding the thymine residues within the TG4T quadruplex is available. Their position at the extremities of the helix and the absence of interbase hydrogen bonding suggest that they are able to perform large amplitude motions. Consequently, their
excited states should not be electronically coupled to those of the guanines. Assuming that the spectral properties of thymine residues in both single-stranded and four-stranded TG4T are those of isolated TMP, it is possible to subtract their contribution from the absorption and fluorescence spectra of the helices. In this way the effect of vertical and horizontal organization on the optical properties of guanines can be distinguished.
Figure 8
In Figure 9, the absorption spectrum of “G4” vertical stacks in single strands is compared with that of isolated dGMP on the one hand (a) and with the spectrum of the guanine quadruplex core “4xG4”, on the other (b). The most striking feature observed upon stacking is a 20% decrease of εmax. Recent quantum chemistry calculations have shown that
charge transfer excited states involving different bases are responsible for the well known DNA hypochromism.32-35 More precisely, it was found that charge transfer states among
stacked bases and not among hydrogen-bonded bases induce the larger effect on the oscillator strength. This is corroborated by the spectra in Figure 9. The 5% difference in εmax between
“G4” and “4xG4” could be due to a better stacking of the guanines within the quadruplex core.
A detectable, albeit minor, difference between the “G4” and dGMP concerns the position of the absorption maximum, which is located at 252 and 253 nm, respectively. Hypsochromic shift is typical of Frenkel excitons formed following vertical stacking of chromophores (also called H aggregates).36-39 Such excitons are linear combinations of the
excited states of the monomeric chromophores composing the aggregate and extend over several of them. The degree of delocalization may be reduced in the presence of conformational disorder,40 as probably happens in the case of TG4T single strands.
Hoogsteen pairing among guanines of different “G4” stacks leads to a slight shift of the absorption spectrum toward lower energies (inset in Figure 9). More markedly, the shoulder associated with S0 → S1 transition shifts from ca. 280 to 290 nm giving rise to
hyperchromism at 295, used to detect the quadruplex formation via the melting curves. These changes can be comprehended in terms of dipolar coupling between electronic transitions located on the same plane.37 Such a coupling is typical of J aggregates formed, for example,
by cyanine dyes.41 The spectra of these molecular systems present a well defined absorption
peak located at the red side of the monomer band. In the case of “4xG4”, this effect is attenuated because of the presence of two overlapping ππ* transitions, S0→ S1 and S0→ S2,
per chromophore. As a result, four different combinations of dipolar coupling may operate between each pair of bases (V11, V22, V12, V21) leading to a spread out of the oscillator
strength. All four couplings were taken into account in the calculation of exciton states of alternating dGdC duplexes. These calculations, combining data from quantum chemistry, molecular dynamic simulations and taking into account the width of the experimental spectra,42 showed that the absorption spectrum of the duplex is the envelop of a large number
of electronic transitions. The same conclusions were drawn from theoretical studies on adenine-thymine model double helices.40,43,44 So far, this type of calculations have not been
performed for G-quadruplexes. Nevertheless, it is reasonable to assume that the same picture, found for double helices of various sequences, is also valid for four-stranded structures. Especially, the existence of multiple hydrogen bonds within guanine tetrads should reduce structural fluctuations with respect to duplexes and favor delocalization of the excited states. Finally, we remark that, Frenkel excitons may be coupled to charge transfer states,32,45 further
increasing the diversity of the quadruplex excited states.
The long wavelength shoulder present in the fluorescence spectra of TG4T single strands (Fig. 5) is attributed to excimer emission. The formation of excimers necessitates
some geometrical rearrangement to reach the minimum of the excited state potential energy curves. Since excimer emission is not observed in the case of TG4T quadruplexes we deduce that it involves two guanine moieties whose mobility is blatantly different in the two types of arrangements. Another reason for this attribution is that the relative intensity of the excimer emission is stronger upon excitation at 255 nm than at 267 nm, the fraction of photons absorbed by guanines being higher at the former wavelength. We tempted to reconstruct the excimer emission as follows. First we subtracted the contribution of thymine residues from the fluorescence spectrum of the TG4T single strand taking into account the fluorescence quantum yield of TMP and the molar fraction of the photons absorbed by this chromophore at each excitation wavelength. Then, we further subtracted a fraction α of the dGMP spectrum so that to obtain a well shaped band. An α value equal to 0.75 ± 0.10 gave the best results, for excitation at both 255 and 267 nm, revealing a band peaking at 450 ± 5 nm (inset in Fig. 5b). This rudimentary spectral analysis suggests that not all guanines of the “G4” stacks evolve to excimers. Emission from localized states and possibly from weakly delocalized Frenkel excitons, whose spectral properties resemble those of the monomers,20,21 takes also place.
The above described analysis performed for the quadruplex fluorescence spectra did not reveal any well defined band as that found for the single strand. The spectra resulting from subtraction of any fraction the dGMP and TMP emission were not very different from those in Fig. 5, showing that emission arises from a multitude of exited states. This is in line with the strong variation of the fluorescence decays with the emission wavelength (Fig. 7).
The fluorescence decays determined for the quadruplex by fluorescence upconversion are longer than those determined for various double helices at the same wavelength. Interestingly, a longer decay time (<τ> = 4.0 ps at 350 nm) was detected for self-associated triguanosine diphosphates.14 This probably happens because the tight structure of stacked
guanine tetrads reduces the channels of non-radiative excited state relaxation46 and/or favors
the collective character of the excited states.
The signals detected by fluorescence upconversion are associated to excited states carrying non-negligible oscillator strength (typically ππ* states). Thus excimers in alternating dAdT duplexes decaying on the nanosecond timescale47 are undetectable by fluorescence
upconversion.24 Long-lived excited states were indeed detected by time-resolved infrared
spectroscopy for quadruplexes formed by telomeric sequences and by time-correlated single photon counting for G4 wires.15,48
Focusing on the early times, we recall that the anisotropy determined for model double helices on the sub-picosecond time-scale is lower than those corresponding to an equimolar mixture of non-interacting nucleotides and it decays more rapidly.20-24 Such a loss of
anisotropy observed when molecular motions are hindered constitutes a proof for energy transfer among bases. The onset of this process takes place before 100 fs, the time resolution of the experiment. Such an ultrafast process is typical of intraband scattering,49 e.g. internal
conversion among exciton states.36 We stress that in the case of multichromophoric systems
involving delocalized excited states, energy transfer cannot be described correctly by Förster and Dexter mechanisms.
In the case of the TG4T quadruplex, r0 is higher than that of the nucleotide mixture.
This is not incompatible with ultrafast energy transfer within the “4xG4” core because of the presence of uncoupled thymine moieties. As the TMP anisotropy is close to 0.36 and its average lifetime is 0.5 ps, its contribution to the anisotropy during the first few hundreds of femtoseconds blurs the loss due to energy transfer. Within 1 ps, the quadruplex anisotropy becomes equal to that of dGMP (0.13) and subsequently it continues to drop. The limiting r∞
values (0.05 - 0.07; Table 3) are lower than that expected for energy transfer involving transition moments orthogonal to an axis as found, for example, for triphenylene columnar
phases (0.1).50 That should be also the case for ππ* transitions in guanine tetrads with
perfectly planar structure. The low long-time anisotropy observed for TG4T quadruplexes may be due either to weak conformational motions or to the emission from excited states with partial charge transfer character whose polarization differs from that of ππ* transitions.
The results presented here for TG4T allowed us to draw some qualitative conclusions about properties of excited states and energy transfer in G-quadruplexes. We hope that this experimental work will motivate theoretical developments, in line with those who started to appear for double stranded DNA,34,44,51 which could provide a more detailed picture about the
effect of optical excitation on guanine nanostructures.
Acknowledgment
. We are grateful to Dr. Valerie Gabelica and to Dr. Frederic Rosu for helpful discussions in the frame of the bilateral project CNRS/FRS-FNRS/CGRI N° 20192 and to the NanoSciences Ile-de-France for funding (project N° IF-06-357/R-9).References
(1) Simonsson, T. Biol. Chem. 2001, 382, 621.
(2) Lane, A. N.; Chaires, J. B.; Gray, R. D.; Trent, J. O. Nucleic Acids Res. 2008,
36, 5482.
(3) Mergny, J. L.; Lacroix, L.; Teulade-Fichou, M. P.; Hounsou, C.; Guittat, L.; Hoarau, M.; Arimondo, P. B.; Vigneron, J. P.; Lehn, J. M.; Riou, J. F.; Garestier, T.; Helene, C. Proc. Natl. Acad. Sci. USA 2001, 98, 3062.
(4) Neidle, S.; Parkinson, G. Nature Reviews Drug Discovery 2002, 1, 383.
(5) Gabelica, V.; Rosu, F.; De Pauw, E.; Antoine, R.; Tabarin, T.; Broyer, M.; Dugourd, P. J Am Soc Mass Spectrom 2007, 18, 1990.
(6) Alberti, P.; Mergny, J. L. Proc. Natl. Acad. Sci. USA 2003, 100, 1569.
(7) Alberti, P.; Bourdoncle, A.; Sacca, B.; Lacroix, L.; Mergny, J. L. Org. Biomol. Chem. 2006, 4, 3383.
(8) Wyatt, J. R.; Vickers, T. A.; Roberson, J. L.; Buckheit, R. W.; Klimkait, T.; Debaets, E.; Davis, P. W.; Rayner, B.; Imbach, J. L.; Ecker, D. J. Proc. Natl. Acad. Sci. USA
1994, 91, 1356.
(9) Chou, S. H.; Chin, K. H.; Wang, A. H. J. Trends in Biochemical Sciences 2005,
30, 231.
(10) Gabelica, V.; Baker, E. S.; Teulade-Fichou, M. P.; De Pauw, E.; Bowers, M. T. J. Am. Chem. Soc. 2007, 129, 895.
(11) Riou, J. F.; Guittat, L.; Mailliet, P.; Laoui, A.; Renou, E.; Petitgenet, O.; Megnin-Chanet, F.; Helene, C.; Mergny, J. L. Proc. Natl. Acad. Sci. USA 2002, 99, 2672.
(12) Ying, L. M.; Green, J. J.; Li, H. T.; Klenerman, D.; Balasubramanian, S. Proc. Natl. Acad. Sci. USA 2003, 100, 14629.
(13) Nagatoishi, S.; Nojima, T.; Juskowiak, B.; Takenaka, S. Angew. Chem.-Int. Edit.
2005, 44, 5067.
(14) Markovitsi, D.; Gustavsson, T.; Sharonov, A. Photochem. Photobiol. 2004, 79,
526.
(15) Gepshtein, R.; Huppert, D.; Lubitz, I.; Amdursky, N.; Kotlyar, A. B. J. Phys. Chem. C 2008, 112, 12249.
(16) Cadet, J.; Sage, E.; Douki, T. Mutat Res 2005, 571, 91.
(17) Melnikova, V. O.; Ananthaswamy, H. N. Mutat Res 2005, 571, 91.
(18) Aboul-ela, F.; Murchie, A. I. H.; Lilley, D. M. J. Nature 1992, 360, 280.
(19) Laughlan, G.; Murchie, A. I. H.; Norman, D. G.; Moore, M. H.; Moody, P. C. E.; Lilley, D. M. J.; Luisi, B. Science 1994, 265, 520.
(20) Markovitsi, D.; Onidas, D.; Gustavsson, T.; Talbot, F.; Lazzarotto, E. J. Am. Chem. Soc. 2005, 127, 17130.
(21) Markovitsi, D.; Gustavsson, T.; Talbot, F. Photochem. & Photobiol. Sci. 2007,
717
(22) Miannay, F. A.; Banyasz, A.; Gustavsson, T.; Markovitsi, D. J. Am. Chem. Soc. 2007, 129, 14574.
(23) Onidas, D.; Gustavsson, T.; Lazzarotto, E.; Markovitsi, D. J. Phys. Chem. B
2007, 111, 9644.
(24) Onidas, D.; Gustavsson, T.; Lazzarotto, E.; Markovitsi, D. Phys. Chem. Chem. Phys. 2007, 9, 5143.
(25) Mergny, J. L.; De Cian, A.; Ghelab, A.; Sacca, B.; Lacroix, L. Nucleic Acids Res. 2005, 33, 81.
(26) Onidas, D.; Markovitsi, D.; Marguet, S.; Sharonov, A.; Gustavsson, T. J. Phys. Chem. B 2002, 106, 11367.
(27) Gustavsson, T.; Sharonov, A.; Markovitsi, D. Chem. Phys. Lett. 2002, 351,
(28) Gustavsson, T.; Sharonov, A.; Onidas, D.; Markovitsi, D. Chem. Phys. Lett.
2002, 356, 49.
(29) Markovitsi, D.; Onidas, D.; Talbot, F.; Marguet, S.; Gustavsson, T.; Lazzarotto, E. J. Photochem. Photobiol. A: Chem. 2006, 183, 1.
(30) Gabelica, V.; Rosu, F.; Tabarin, T.; Kinet, C.; Antoine, R.; Broyer, M.; De Pauw, E.; Dugourd, P. J. Am. Chem. Soc. 2007, 129, 4706.
(31) Bouvier, B.; Gustavsson, T.; Markovitsi, D.; Millié, P. Chem. Phys. 2002, 275,
75.
(32) Starikov, E. B. Modern Phys. Lett. B 2004, 18, 825.
(33) Varsano, D.; Di Felice, R.; Marques, M. A. L.; Rubio, A. J. Phys. Chem. B
2006, 110, 7129.
(34) Santoro, F.; Barone, V.; Improta, R. Proc. Natl. Acad. Sci. USA 2007, 104,
9931.
(35) Santoro, F.; Barone, V.; Improta, R. ChemPhysChem 2008, 9, 2531.
(36) Rashbah, E. I.; Sturge, M. D. Excitons; North-Holland: Amsterdam, 1982. (37) Kasha, M.; Rawls, H. R.; El-Bayoumi, M. A. Pure Appl Chem 1965, 11, 371.
(38) Marguet, S.; Markovitsi, D.; Millié, P.; Sigal, H.; Kumar, S. J. Phys. Chem. B
1998, 102, 4697.
(39) Ecoffet, C.; Markovitsi, D.; Millie, P.; Lemaistre, J. Chem. Phys. 1993, 177,
629.
(40) Bouvier, B.; Dognon, J. P.; Lavery, R.; Markovitsi, D.; Millié, P.; Onidas, D.; Zakrzewska, K. J. Phys. Chem. B 2003, 107, 13512.
(41) Higgins, D. A.; Reid, P. J.; Barbara, P. F. J Phys Chem 1996, 100, 1174.
(42) Emanuele, E.; Zakrzewska, K.; Markovitsi, D.; Lavery, R.; Millie, P. J. Phys. Chem. B 2005, 109, 16109.
(43) Emanuele, E.; Markovitsi, D.; Millié, P.; Zakrzewska, K. ChemPhysChem
2005, 6, 1387.
(44) Bittner, E. R. J. Photochem. Photobiol. A: Chem. 2007, 190, 328.
(45) Starikov, E. B.; Lewis, J. P.; Sankey, O. F. Intern. J. Modern Phys. B 2005, 19,
4331.
(46) Gustavsson, T.; Banyasz, A.; Lazzarotto, E.; Markovitsi, D.; Scalmani, G.; Frisch, M. J.; Barone, V.; Improta, R. J. Am. Chem. Soc. 2006, 128, 607.
(47) Markovitsi, D.; Talbot, F.; Gustavsson, T.; Onidas, D.; Lazzarotto, E.; Marguet, S. Nature 2006, 441, E7.
(48) McGovern, D. A.; Quinn, S.; Doorley, G. W.; Whelan, A. M.; Ronayne, K. L.; Towrie, M.; Parker, A. W.; Kelly, J. M. Chem. Comm. 2007, 5158.
(49) Sundstrom, V. Annu Rev Phys Chem 2008, 59, 53.
(50) Markovitsi, D.; Germain, A.; Millie, P.; Lécuyer, I.; Gallos, L.; Argyrakis, P.; Bengs, H.; Ringsdorf, H. J. Phys. Chem. 1995, 99, 1005.
Table 1: Fluorescence properties of TG4T
struct λex (nm)a λem,max (nm)b Φ x104c G-quadruplex 255 267 340, 370 (sh) 338-350 2.9 3.0 single strand 255 267 336, 460(sh) 330 1.2 1.2 non-interacting nucleotides 255 267 333 333 1.2 1.3λex : excitation wavelength; λem,max maximum of the fluorescence emission; Φ: fluorescence quantum yield;
error: a) ±0.5 nm; b) ±1 nm; c) ± 0.1
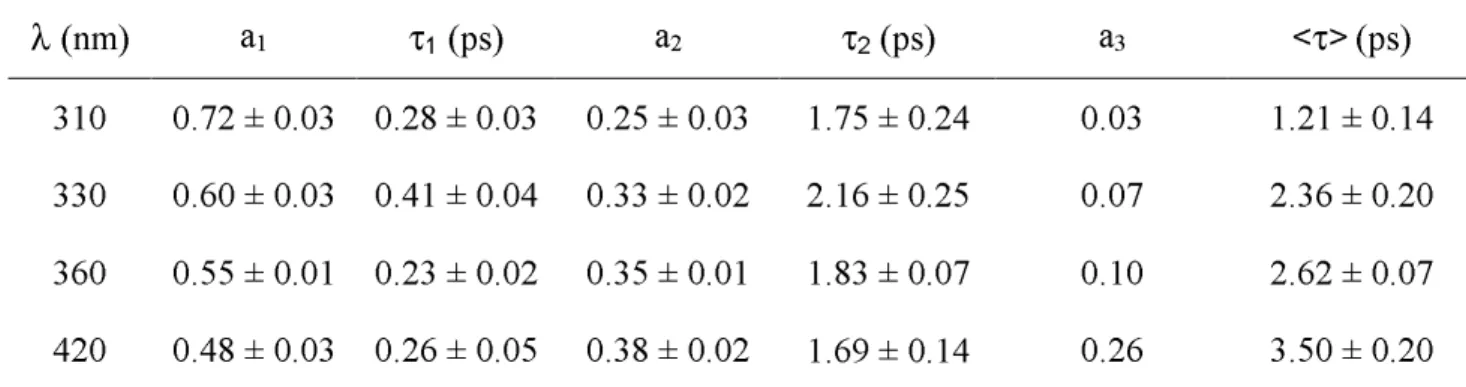
Table 2:
Parameters derived from the fit of the fluorescence decays of TG4T quadruplexes using tri-exponential functions r(t) =∑
= − 3 1 ) / exp( i i i t
a τ ; τ3 was given a fixed to 20 ps. The
average lifetime is defined as
∑
∑
= = = 3 1 3 1 i i i i i a aτ τ , where
∑
= = 3 1 1 i ia . The error bars result from the fits. The errors given correspond to one standard deviation
λ(nm) a1 τ1 (ps) a2 τ2 (ps) a3 <τ>(ps)
310 0.72 ± 0.03 0.28 ± 0.03 0.25 ± 0.03 1.75 ± 0.24 0.03 1.21 ± 0.14 330 0.60 ± 0.03 0.41 ± 0.04 0.33 ± 0.02 2.16 ± 0.25 0.07 2.36 ± 0.20 360 0.55 ± 0.01 0.23 ± 0.02 0.35 ± 0.01 1.83 ± 0.07 0.10 2.62 ± 0.07 420 0.48 ± 0.03 0.26 ± 0.05 0.38 ± 0.02 1.69 ± 0.14 0.26 3.50 ± 0.20 Table 3: Parameters derived from the fit of the fluorescence anisotropy decays of TG4T quadruplexes using mono-exponential functions r(t) = r∞+aexp(-t/τr). The errors given
correspond to one standard deviation
λ(nm) a τr(ps) r∞ r0
330 0.19 ± 0.03 0.68 ± 0.10 0.07 ± 0.01 0.25 ± 0.01 360 0.18 ± 0.01 0.72 ± 0.10 0.06 ± 0.01 0.25 ± 0.01 420 0.16 ± 0.02 0.91 ± 0.10 0.05 ± 0.01 0.22 ± 0.01
FIGURE 1
Figure 1. Schematic representation of the guanine tetrad formed via Hoogsteen hydrogen bonds.
FIGURE 2
Temperature (°C)
20 30 40 50 60 70 80 90Ab
so
rba
nc
e a
t 2
95
nm
0.7 0.8 0.9 1.0Figure 2. Variation of the absorbance observed at 295 nm upon increasing (circles) and decreasing temperature (squares) of TG4T in phosphate buffer. For comparison with literature data, the initial absorbance value was set equal to one.
FIGURE 3 Wavelength (nm) 240 260 280 300 ε (1 03 M -1 cm -1) 0 2 4 6 8 10 12 14 300 400 500 600 700 Flu ore sc en ce in ten sit y ( a. u.) 0.0 0.2 0.4 0.6 0.8 1.0
FIGURE 4 Wavelength (nm) 240 260 280 300 320 ε (10 3 M -1 cm -1) 0 2 4 6 8 10 12
Figure 4.Absorption spectra of four-stranded TG4T (red) and single-stranded TG4T (green) at 20 °C. The spectrum in black corresponds to the stoichiometric mixture of non-interacting nucleotides. The molar absorption coefficient is given per base.
FIGURE 5 Wavelength (nm) 300 400 500 600 Fl uo re sc en ce in te ns ity (a . u .) 0.0 0.2 0.4 0.6 0.8 1.0 300 400 500 600 700 a b 400 500 600 0.0 0.2 0.4 0.6 0.8 1.0
Figure 5. Normalized fluorescence spectra of four-stranded TG4T (red) and single-stranded TG4T (green). The spectrum in black corresponds to the stoichiometric mixture of non-interacting nucleotides. The spectrum in the inset was obtained by subtracting the contribution of monomeric dGMP and TMP emission from the spectrum of the single strand. Excitation wavelength: (a) 255 nm and (b) 267 nm.
FIGURE 6 Time (ps) 0 2 4 6 Fl uo re sc en ce in te ns ity (a .u .) 0.01 0.1 1 0 1 2 3 4 Fl uo re sc en ce a ni so tro py 0.05 0.10 0.15 0.20 0.25 a b
Figure 6. Comparison of the fluorescence decay (a) and fluorescence anisotropy decay (b) of four-stranded TG4T (red) with the decays of the stoichiometric mixture of non-interacting nucleotides (black). The apparatus function is shown in dashes. Excitation wavelength: 267 nm; emission wavelength: 360 nm. The time-zero is defined at the half rise of the fluorescence decays. The grey lines correspond to fits with mono-exponential functions.
FIGURE 7 Time (ps) 0 2 4 6 8 Fl uo re sc en ce in te ns ity (a . u .) 0.01 0.1 1
Figure 7. Fluorescence decays of TG4T quadruplexes recorded at 310 nm (circles), 330 nm (squares) and 420 nm (triangles). Excitation wavelength: 267 nm.
FIGURE 8
Figure 8. Schematic representation of thymine (blue) and guanine (dark red) residues in single-stranded and four-stranded TG4T.
FIGURE 9 240 260 280 300 εεεε (1 03 M -1 cm -1) 0 2 4 6 8 10 12 14 Wavelength (nm)240 260 280 300 320 0 2 4 6 8 10 245 250 255 260 0.8 0.9 1.0
Figure 9. Absorption spectra of the guanine residues as a function of the molecular organization. Black: “isolated” dGMP; green: “G4” guanine stack in single-stranded TG4T; red: “4xG4” guanine core in four-stranded TG4T. The molar absorption coefficient is given per base.