Publisher’s version / Version de l'éditeur:
Vous avez des questions? Nous pouvons vous aider. Pour communiquer directement avec un auteur, consultez la première page de la revue dans laquelle son article a été publié afin de trouver ses coordonnées. Si vous n’arrivez pas à les repérer, communiquez avec nous à [email protected].
Questions? Contact the NRC Publications Archive team at
[email protected]. If you wish to email the authors directly, please see the first page of the publication for their contact information.
https://publications-cnrc.canada.ca/fra/droits
L’accès à ce site Web et l’utilisation de son contenu sont assujettis aux conditions présentées dans le site LISEZ CES CONDITIONS ATTENTIVEMENT AVANT D’UTILISER CE SITE WEB.
Paper (National Research Council of Canada. Institute for Research in
Construction), 1987
READ THESE TERMS AND CONDITIONS CAREFULLY BEFORE USING THIS WEBSITE. https://nrc-publications.canada.ca/eng/copyright
NRC Publications Archive Record / Notice des Archives des publications du CNRC : https://nrc-publications.canada.ca/eng/view/object/?id=3985f2c9-6c8c-43bd-9328-40f9b7a4edb3 https://publications-cnrc.canada.ca/fra/voir/objet/?id=3985f2c9-6c8c-43bd-9328-40f9b7a4edb3
NRC Publications Archive
Archives des publications du CNRC
This publication could be one of several versions: author’s original, accepted manuscript or the publisher’s version. / La version de cette publication peut être l’une des suivantes : la version prépublication de l’auteur, la version acceptée du manuscrit ou la version de l’éditeur.
For the publisher’s version, please access the DOI link below./ Pour consulter la version de l’éditeur, utilisez le lien DOI ci-dessous.
https://doi.org/10.4224/40001417
Access and use of this website and the material on it are subject to the Terms and Conditions set forth at
Experiments of piston effect on elevator smoke control
Ser
THI
Natlonal
Rewarch Consell natlonal
''laC+I
Council
c a n
mtwrches Canada
no.1547
c * 2
B D G
Institute for
lnstitut de
- -_-,'
Research in
recherche en
Construction
construction
Expedments of Piston Effect on Elevator
Smoke Control
by
J.H. Klote and G.T. Tamura
Reprinted from
ASHRAE Transactions 1987
Vol. 93, R. 2
p. 2217-2228
(IRC Paper No. 1547)
NRCC 291 20
L I B R A R Y
I
B ~ B L ~ O T H ~ Q U E
I R C
C N W C-
lClsT1
-I-, --,."Les pressions transitoires produites lorsqu'une cabine d'ascenseur se dkplace dans un puits
peuvent poser un probl&me pour les systkmes de protection contre la fumCe dans les
ascenseurs. Cet effet de piston peut attirer la fumCe dans une entree d'ascenseur en
pression normale. Ce document fait Ctat des dsultats d'experiences portant sur l'effet de
piston et rkalides dans des conditions de limitation de la propagation de la fumCe. Les
resultats d'une analyse thCorique concordent gCn6ralement avec ceux des experiences.
Pour la plupart des ascenseurs, on peut r6soudre le problkme pose par l'effet de piston au
moyen de dispositions qui empCchent l'infiltration de la fumCe dans les entrCes
d'ascenseurs; on prCsente ici des Quations indiquant la quantitd d'air de mise en pression
necessaire pour y parvenir.
EXPERIMENTS OF PISTON EFFECT
ON ELEVATOR SMOKE CONTROL
J.H. Klote, P.E., D.Sc. G.T. Tamura,
P.E.
ASHRAE Member ASHRA E Fellow
ABSTRACT
The transient pressures produced when an elevator car moves in a shaft are a potential problem for elevator smoke-control systems. This piston effect can pull smoke into a normally pressurized elevator lobby. This paper presents' the results of piston effect experiments under smoke-control conditions. The results of a theoretical analysis and those of the experiments are in good agreement. For most elevators the piston-effect problem can be overcome by designs that prevent smoke from being pulled into elevator lobbies, and equations for the amount of pressurization air needed to accomplish this are presented.
INTRODUCTION
Throughout most of the world, there are signs next to elevators indicating that they should not be used in fire situations and that stairwells should be used for fire evacuation. However, some people cannot use stairwells because of physical disabilities, and for these people fire evacuation is a serious problem. Klote (1984) has discussed the long-standing obstacles to the use of elevators for fire evacuation, and all of these obstacles can be addressed by existing technology except for smoke protection. The National Bureau of Standards (NBS) in the United States and the National Research Council of Canada (NRCC) are engaged in a joint project to evaluate the feasibility of usidg elevators for the evacuation of the handicapped during a fire. The transient pressures produced when an elevator car moves in a shaft present a potential problem for elevator smoke-control systems. This paper summarizes a method of analysis of such elevator "piston effect," presents the results of piston-effect experiments and discusses the implications of piston effect with respect to elevator smoke control.
The term "smoke control" is used in this report to mean the limiting of smoke movement by pressurization produced by mechanical fans. This meaning has attained some level of acceptance in North America. The elevator smoke-control system discussed in this paper is intended to protect the elevator shaft and the elevator lobbies from smoke infiltration due to fires I outside these areas.
Tamura and Shaw (1976) have demonstrated that most elevator dcors have large gaps around them. Such large leakage areas around the doors result in lobby and shaft pressures that are nearly equal under most conditions. Thus, if pressurization air is supplied to the elevator shaft, the lobbies will be pressurized indirectly to almost the same pressure as the shaft. Elevator smoke control can be achieved by supplying air to the elevator shaft, to the elevator lobbies, or to both shaft and lobbies. The first report (Klote and Tamura 1986) of this project demonstrates that systems which supply air into shafts only can operate effectively under a wide range of conditions. The experiments and discussions in this paper are limited to shaft-pressurization systems.
John H. Klote, Center for Fire Research, National Bureau of Standards, Gaithersburg, MD; George T. Tamura, Division of Building Research, National Research Council of Canada, Ottawa.
where ANALYSIS
Klote (1987) developed a method of analysis of the influence of piston effect on elevator smoke control. This method is outlined below. For the sake of simplicity, buoyancy, wind, stack effect, and the heating and ventilating system have been omitted from this analysis. Omitting stack effect is equivalent to stipulating that the building air temperature and the outside air temperature are equal. Because these temperatures are the same, the gravity effects on air density and pressure are negligible. For this analysis elevator car motion is limited to a single car moving in a single-car shaft or in a multiple-car shaft. The analysis is for a downward-moving elevator car, however the problem of an upward-moving one is same mathematically. Thus, the equations presented can be extended for an upward-moving car by
reversing subscripts a (above the car) and b (below the car).
Pressures Inside the Shaft
The pressure, Pa, above the elevator car is calculated by the following equation:
%a
'
Kbasba1-
1
(1)
-
K
~
-
P AsV~
0s
~
~
rhpa
= mass flow rate of pressurization air to the shaft space above the carKba = A@,
5
1
Sba = sign of (Pb
-
Pa) c = ($a+
'$b)/Kbo b = S,Na/NbI
Pa = pressure above the car relative to outside
Kao = N,CA,
JK
'
a = sign of Pa P = air density
As = cross-sectional area of shaft
V
= car velocityAf = free flow area in the shaft around the car c = flow coefficient for flow around car Pb = pressure below the car relative to outside
ij,b
= mass flow rate of pressurization air to the shaft below the car Kbo ' NbCAeJ
x
N a = number of floors above the car Nb = number of floors below the car
C = flow coefficient for flow paths other than around elevator cars Ae = effective flow area per floor between the shaft and the outside
The free flow area, Af, around the car equals the cross-sectional area, As, of the shaft less the horizontal projected area of the car. The flow coefficient, Cc, for flow around the car was evaluated by Klote and Tamura (1987) on a twelve-story elevator shaft at the NBS
Administration Building. For one car traveling in a two-car shaft, the flow coefficient was 0.94, and for two cars traveling side-by-side together the flow coefficient was 0.83. The case of the two cars traveling together was measured to obtain an approximation of a car moving in a
single-car shaft. The flow coefficient, C, is for the flow through leakage paths from the building to the outside. For most narrow leakage paths in buildings such as cracks around doors and construction cracks, C is generally in the range of 0.6 to 0.7.
The effective flow area, A,, is the area that results in the same flow as the system of flow areas from the building to the outside when A, is subjected to the same pressure difference as the system. The system of flow areas can consist of areas in parallel with one another, in series, or a combination of both parallel and series. The ASHRAE smoke control manual (Klote and Fothergill 1983) presents a detailed discussion of effective flow areas, and an evaluation of A, for a system of three flow paths in series is presented later in this paper.
The pressure, Pb, below the elevator car is
Motion of Car
The motion of an elevator car can be considered to consist of five phases: constant acceleration, transitional acceleration, constant velocity motion, transitional deceleration and constant deceleration. A car starting from rest accelerates at a constant rate, a, until the transitional velocity, Vt, is reached. The time, tt, to-reach this velocity is
The distance, Xt, the car travels in this time is
During the transitional acceleration phase the acceleration decreases until full operational velocity, Vp, is reached. Strakosch (1983) uses the following approximate relations for this
phase:
and
where
%
is the distance the car travels before it reaches full operational velocity at time tp from the start of motion. At time, t, during the constant velocity phase the car position isThe car motion during the deceleration phases is similar to that of the acceleration phases. Thus the distance of car travel, Xd, to reach the start of transitional deceleration is
Xd = Xtot-
Xp
where Xtot is the total distance of car travel. The time to Xd is
td ' tp
+
(Xtot-
2Xp)/Vp (9)The time, tg, to reach Xg is
where ttot is the total time of car travel (ttot = td
+
tp].Three Series Flow Path Model
For fire evacuation by elevators, the pressure difference, APli, across the lobby doors is
I
of major importance. If APli is positive, the resulting airflow from the lobby to the buildingwill act to prevent smoke infiltration of the lobby. This pressure difference can be evaluated by examination of the effective flow area. For a system of three series flow paths from the
shaft to the outside, the effective flow area per floor is
I
where
Asl = leakage area between the lobby and the shaft
Ali
= leakage area between the building and the lobbyAio
= leakage area between the outside and the building.For paths in series, the pressure difference across one path equals the pressure difference across the system times the square of the ratio of the effective area of the system to the flow area of the path in question. Thus for flows above the elevator car, APli can be expressed as
This equation is general in that it applies to any system of flow paths not just three flow paths in series, provided that.
A,
is evaluated for that particular system. This analysis does not include the effects of other shafts such as stairwells and dumbwaiters. Provided that the leakage of these other shafts is relatively small compared to Aio, Equation 7 obviously is appropriate for evaluation of A, for buildings with open floor plans. The results of the experiments described in the next section are some indication of the applicability of the three series flow path model to a building with considerable leakage to other shafts.EXPERIMENTS
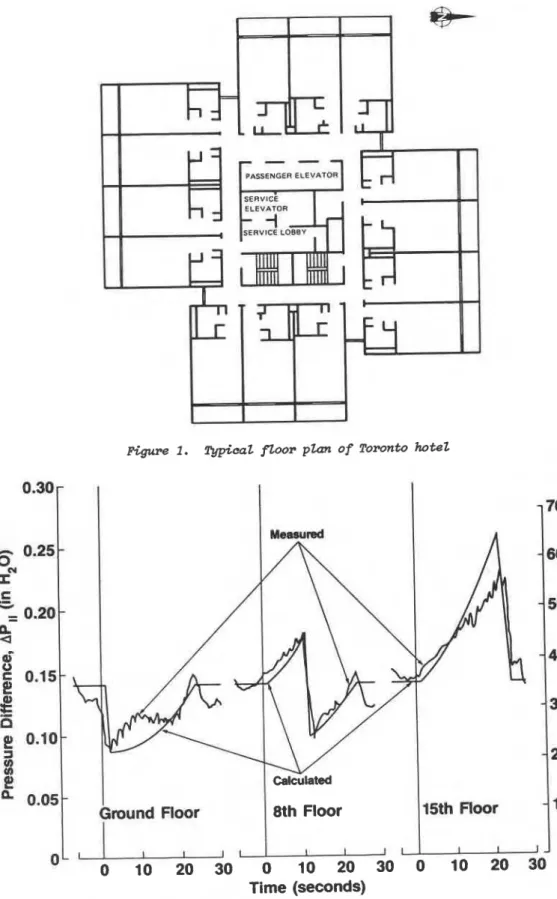
Experiments were conducted on an elevator of a hotel in Mississauga, Ontario, Canada. This elevator served each floor of the 15-story building, and the height between floors was 8.53 ft (2.60 m). The service elevator was used for the experiments, because it had an enclosed lobby as illustrated in the typical floor plan of Figure 1. To achieve shaft pressurization, a vane axial fan located on the top mechanical floor was connected by duct work through the outside to the service elevator. The flow rate of supply air through the duct work was measured using velocity pressure averaging tubes. Pressure differences between the lobby and the building interior were measured at the ground, 8th, and 15th floors by piezo-resistive pressure transducers sensitive to 0.005 in H20 (1.2 Pa). Output voltages from the transducers were recorded by strip chart recorders. Elevator car speed was measured by recording the time when the floor indicator lights lighted up as the elevator ascended or descended past each floor.
COMPARISON OF EXPERIMENTS AND THEORY
A computer program was developed to solve Equation 1 for Pa by method of bisection (Burden and Faires 1981) using car velocities and displacements of equations (3) through (11). Equation 2 was used to calculate Pb, and equation (12) used to obtain APli. This program was used to simulate the piston effect of the experiments. Values of the required variables for this analysis are presented in Table 1.
The leakage areas, Asl, Ali and Aio, listed in Table 1 were calculated from measured pressure differences and flows. The effective flow area can be expressed in terms of the pressure difference, Pa, from the shaft to the outside as
where Ntot is the total number of floors. Thus by measuring Pa and
$A,
A, was determined. By using the measured value of APli, Equation 13 was solved for Ali. The two other leakage areas were obtained in a similar manner.ascend in^ Elevator
Figure 2 is a comparison of measured and calculated APli due to an ascending elevator car. The general trends of the calculations are in agreement with the measurements. On the ground floor, piston effect causes a rapid drop in pressure followed by a gradual pressure increase as the car moves away from the ground floor. Intuitively, a reduction in pressure is expected below an ascending car. This pressure reduction decreases as the car moves away due to the effect of increasing leakage area of the shaft below the car. On the top floor, piston effect due to the ascending car causes a gradual pressure increase with distance traveled until the car gets close to that floor. On a middle floor (the 8th), the pressure increases as the car approaches, drops suddenly as the car passes, and increases after it travels away. For the ground and 8th floors, the extremes of the calculated curves deviates from those of the measured curves by only about 0.004 in H20.(1 Pa), and for the 15th floor the extremes deviate by about 0.03 in H20 (8 Pa). The calculations are in good agreement with measurement. The pulsations in the measured curves may be due to fluctuations of the wind, unsteady supply rates of the fan or changes in apparent elevator shaft size as the car passes the housings of the automatic doors. The larger deviation on the 15th floor may also be due to these factors or possibly the shaft coefficient, Cc, may not be constant or deviations from the three series flow path model for Ae may be at fault.
Descending Elevator
In general, the measured fluctuations for the descending car are about as large as the pressure changes due to piston effect as can be observed from Figure 3. On the ground floor, both calculations and measurements show the sudden pressure drop near the end of car travel. On the 8th floor, both curves show the sudden pressure drop as the car passes. The influence of piston effect is much less for the descending car than for the ascending car as can be observed by comparing of Figures 2 and 3. The pressurization air supplied at the top of the shaft reduces the extent of pressure drop above the downward-moving car. The pressure,
Pb,
below the car is related to the pressure, Pa, above it by Equation 2. %us, .it- is not surprising that both pressures above and below the descending car are influenced less by piston effect than they are for an ascending car. In general, it can be stated for shaft pressurization with a single air supply location, that when a car is moving away from the supply location the results of piston effect are less than when the car is moving toward the supply locat ion.
Leaka~e Model
The above experiments were all conducted with the elevator lobby doors closed. TO evaluate the usefulness of the leakage areas, Asl and Aio, obtained above, another experiment was conducted with all the lobby doors opened. The measured and calculated pressure differences, APsi, from the shaft to the building at the ground floor are shown on Figure 4 for an ascending car. The values (Table 1) used for calculation were all the same as for the preceding experiments except that area, Ali, between the lobbies and the building interior was 22. f t2 (2.0 m2) to account for the open door. The shape of the two curves of Figure 4 agree about as well as those of Figures 2 and 3. However, the measured curve is noticeably above the calculated one. Before car travel (at t
<
0). the measured curve is 0.015 in H20 (3.7 Pa) above the calculated curve. This difference is believed to be to limitations of the above approach for determining the leakage areas, Asl and Aio. This approach was based on the simple model of effective leakage area, A,, consisting of three areas in series, which does notinclude any vertical air flows such as those in the passenger elevator shafts. Caution should be exercised in the use of the three series leakage model, and ideally leakage areas evaluated
by it should be obtained at levels of pressure near those of interest for a particular application.
Applicability of Theory
The pressure difference that is of concern with regard to elevator smoke control during piston effect is the minimum value of APli. AS can be observed from Figures 2 and 3, the extremes predicted by the theory are in good agreement with the measured extremes. Of particular interest is the minimum value of APli on the ground floor while the car ? s zscending which is shorn on Figure 2. For this value, the difference between theory and measurement is only about 0.004 in H20 (1 Pa). Thus it can be concluded that the theory is sufficiently developed for application to elevator smoke control. However, the methods of analysis presented so far do not lend themselves to quick, direct, and simple calculations. The equations in the next section overcome this problem.
CRITICAL PRESSURIZATION
As part of his piston effect analysis, Klote (1987) developed the concept of critical pressurization rate. This is a rate of supply air to an elevator shaft at which piston effect can not overcome shaft pressurization. Thus if the supply air equals or exceeds the critical pressurization rate, m
crif,.the elevator shaft and lobby pressurization will remain positive on all floors during car motion. Klote developed equations for this flow rate based on the assumptions of the analysis previously discussed. If all the air is supplied at one location within the shaft, the critical mass flow rate is
For pressurization air supplied evenly at the top and bottom of the shaft (%a =
ribb
=the critical mass flow rate is
The flow rates obtained from Equations 15 and .16 are conservative in that at these flow rates the lobby and shaft pressurization will have some positive value even during extreme conditions of piston effect. However, these equations can be used during smoke control design to ensure whether that piston effect results in loss of shaft pressurization. An advantage of these Equations is their simplicity compared with Equations 1 through 13.
For the building of the previously described experiments with one supply air inlet location, Equation 15 gives a critical pressurization of 10,700 scfm (5.06 kg/s at p = 1.2 kg/m3). For pressurization air supplied evenly at the top and bottom of the shaft, Equation 16 gives a critical pressurization rate of 8,800 scfm (4.14 kg/s at p = 1.2 kg/m3). The two Equations, 15 and 16, are the maxirmun and minimum values of the
merit
respectively for any combination of supply air inlet locations. Because the difference between the values critical pressurization rate calculated by the two equations is relatively small, it is apparent that inlet location is not important with respect to the critical mass flow rate. For simplicity, the critical mass flow rate of pressurization air will be considered to be defined by Equation 15.CRITICAL PRESSURE DIFFERENCE
Without car motion, the pressure difference, ( A P ~ ~ ) ~ ~ ~ ~ , from the lobby to the building at the critical mass flow rate of pressurization air can be obtained by substituting iCrit from Equation 15 into Equation 14 and combining Equation 13.
For the elevator of the experiments, ( A P ~is 0.056 in H20 (14 Pa). ~ ) ~ ~ ~ ~ A greater pressure difference may be desired for smoke control as discussed in previous reports (Klote 1984 and Klote and Tamura 1986).
There is the possibility for some elevator systems, that ( A P ~might be so large that ~ ) ~ ~ ~ ~ meeting it would result in difficulty in opening the lobby doors. The National Fire Protection Association Life Safety Code (NFPA 1985) states that the force required to open any door in a means of egress of a new building shall not exceed 30 lb (133 N). Because exposure to smoke can adversely affect a person's physical ability, some fire protection professionals have suggested even lower door opening forces. For discussion the NFPA value is used in this paper, and this force would be required to open a door 7 ft (2.13 m) by 40 in (1.02 m) with a pressure difference across it of 0.36 in H20 (90 Pa) allowing 11 lb (49 N) force to overcome the door closer.
As can be observed from Equation 17, a greater velocity results in a greater ( A P ~ ~ ! ~ ~ ~ ~ . Strakosch (1983) indicates that the upper limit of elevator velocities commercially available
is about 2000 fpm (10 m/s). At this veiocity the elevator of the experiments would have a ( A P ~of 0.13 in H20 (33 pa), which would not cause a door opening problem. ~ ) ~ ~ ~ ~ For small
free flow areas (Af) around the car, it is apparent from Equation 17 that ( A P ~becomes ~ ) ~ ~ ~ ~ large. Multiple car shafts have much greater free flow areas (Af) around the car, and it can
be observed from Equation 17 that this would tend to reduce It is obvious, that for most elevators, it is feasible to deal with the piston effect problem by designing systems such that ( A P ~does not result in excessive elevator lobby door opening forces. ~ ) ~ ~ ~ ~
CONCLUSIONS
1. For a pressurized elevator shaft during elevator car motion, the pressure differences calculated by a method of analysis developed by Klote (1987) were in good agreement with the piston effect experiments described in this paper. Further, the theory of this method of analysis is sufficiently developed for application to elevator smoke control.
2. For most elevators, especially those in multiple-car shafts, it is feasible to deal with the piston effect problem by designing to prevent smoke from being pulled into the elevator lobby by piston effect.
3. Piston effect will not result in loss of shaft pressurization provided the mass flow rate of pressurization air is at least as great as the critical mass flow rate determined from Eqn. 15. NOMENCLATURE A = area a = acceleration b = SaNa/Nb C = flow coefficient C = ( % a + Oibb)/Kbo
i
= mass flow rate N = number of floors P = pressureQ = volume t = time
X
= distance of car travelp = density
AP = pressure difference Subscripts
a = above elevator car b = below elevator car c = elevator car crit = critical
d = transitional deceleration e =effective
f = free flow around g = constant deceleration i = building 1 = lobby o = outside s = shaft p = full operational t = transitional acceleration tot = total
Burden,
R.L.,
Faires, J.D. and Reynolds, A.C. 1981. Numerical analysis, Boston: Prindle, Weber & Schmidt 2nd Edn., pp 21-25.Klote, J.H. 1984. "Smoke Control for Elevators", ASHRAE Journal, Vol. 26, No. 4, pp. 23-33. Klote, J.H. 1987. "An Analysis of the Influence of Piston Effect on Elevator Smoke Control",
submitted to Fire Safety Journal.
Klote,
J.H.
and Fothergill, J.W. 1983. "Design of Smoke Control Systems for Buildings", ASHRAE, Atlanta, GA.Klote, J.H. and Tamura G.T. 1986. "Smoke Control and Fire Evacuation by Elevators", ASHRAE Trans., Vol. 92, Part lA, pp. 231-245.
Klote, J.H. and Tamura G.T. 1987. "Elevator Piston Effect and the Smoke Problem", Fire Safety Journal, Vol. 11, No. 3, pp. 227-233.
Strakosch, G.R. 1983. "Vertical Transportation: Elevators and Escalators", Wiley & Sons, NY,
2nd Edn., pp 122-127.
Tamura, G.T. and Shaw, C.Y. 1976. "Air Leakage Data for the Design of Elevator and Stair Shaft Pressurization Systems", ASHRAE Trans., Vol. 83 Part 2, pp. 179-190.
ACKNOWLEDGEMENTS
The authors gratefully acknowledge the assistance of R.G. Evans in the planning and conducting the elevator experiments including data reduction and P.J. Manley, J. de Jong and other members of the staff of MacLaren Engineers Inc. who ably assisted in the experiments.
TABLE 1
Values Used for Analysis of Piston Effect Experiments
Supply rate of pressurization air( 1).
%,
Cross-sectional shaft area( 1 ).
AsFree flow area around car(l1, Af
Leakage area between lobby and shaft(3). ASI Leakage area between building and lobby( 31, Ali
Leakage area between outside and building(3), Ai, Pull operational car velocity(1). Vp
Transitional velocity(4), V Constant ear acceleration(&!, a Flow coef f icient(4), C
Flow coefficient for flow around shaft(41, Cc
14200 scfm(2) 59.36 ft2 20.96 ft2 1.41 ft2 0.967 ft2 4.84 ft2 340 fpm 204 fpm 3.3 ft/sec2 .65 -83 Notes: (1) measured value
(2) scfm is standard cfm at 68 OF and 1 atmosphere
(3) value obtained from effective flow concept as explained in text (4) estimated value based experience
- -
EHGER ELEVA
Pigure 1 . Typicat fLoop p l a n of Toronto hoteZ
1
Ground
Floor
I
8thFloor
Time (seconds)
Figure 2 . Comparison of measured and caZcutated A Pt due t o t h e piston e f f e c t of an ascending car
I
I
MeasuredI
~ l d u n d
Floor
/
8th
Floor
I
15th Floor
Time
(seconds)
Figure 3 . Comparison o f measured and caZcutated 6 P i ! due t o
t h e p i s t o n e f f e c t o f a descending car
Time
(seconds)
Figure 4 . Comparison o f measured and caZcuZated A P ~ on t h e
ground floor due t o p i s t o n e f f e c t on an ascending car
Discussion
J.S. BUCKLEY, I.A. Naman & Associates, Inc., Houston. TX: Were the levels listed on graphs where the doors were open or just pressure measurement points?
KUYlX: The graph (Figure 2 in the paper) showed pressure difference against time for an
ascending elevator car. The time axis might be thought of as being building levels or heights, but because the car velocity is not constant the shape of the curves would be changed slightly. Because the elevator car was moving, all the elevator doors were closed. Pressure measurements
were made on the ground, 8th and 15th floors.
BUCKLEY: What did the dip in each curve indicate?
W: On each curve a dip or sudden drop in pressure occurred when the elevator passed the
pressure probe.
M.D.F. LING, Penn State University, University Park, PA: Was the analysis performed for a single car in a shaft? How might this analysis be extended to multi-car installations? KUYlX: The analysis is general in that it applies to both single- and multi-car shafts.
Reprinted from ASHRAE TRANSACTIONS by permission of the American Society of Heating, Refrigerating and Air-Conditioning Engineers, Inc.
T h i s paper
i s
being d i s t r i b u t e d i n r e p r i n t form by t h e I n s t i t u t e f o r Research i n.
C o n s t r u c t i o n . A l i s t of b u i l d i n g p r a c t i c e and r e s e a r c h p u b l i c a t i o n s a v a i l a b l e from t h e I n s t i t u t e may be o b t a i n e d by w r i t i n g t o t h e P u b l i c a t i o n s S e c t i o n , I n s t i t u t e f o r Research i n Const m c t i o n , N a t i o n a l Research C o u n c i lof
C a n a d a , O t t a w a , O n t a r i o ,KIA
0R6.C e document e s t d i s t r i b u 6 sous forme de t i r 8 - 3 - p a r t p a r 1 ' I n s t i t u t de r e c h e r c h e e n c o n s t r u c t i o n . On peut o b t e n i r une l i s t e d e s p u b l i c a t i o n s de 1 ' I n s t i t u t p o r t a n t s u r les t e c h n i q u e s ou les r e c h e r c h e s e n
matiGre
d e batiment e n Q c r i v a n t