HAL Id: hal-00304083
https://hal.archives-ouvertes.fr/hal-00304083
Submitted on 9 Apr 2008HAL is a multi-disciplinary open access
archive for the deposit and dissemination of sci-entific research documents, whether they are pub-lished or not. The documents may come from teaching and research institutions in France or abroad, or from public or private research centers.
L’archive ouverte pluridisciplinaire HAL, est destinée au dépôt et à la diffusion de documents scientifiques de niveau recherche, publiés ou non, émanant des établissements d’enseignement et de recherche français ou étrangers, des laboratoires publics ou privés.
Laboratory studies of H2SO4/H2O binary homogeneous
nucleation from the SO2+OH reaction: evaluation of the
experimental setup and preliminary results
L.-H. Young, D. R. Benson, F. R. Kameel, S.-H. Lee
To cite this version:
L.-H. Young, D. R. Benson, F. R. Kameel, S.-H. Lee. Laboratory studies of H2SO4/H2O binary homo-geneous nucleation from the SO2+OH reaction: evaluation of the experimental setup and preliminary results. Atmospheric Chemistry and Physics Discussions, European Geosciences Union, 2008, 8 (2), pp.6903-6947. �hal-00304083�
ACPD
8, 6903–6947, 2008 Laboratory studies of H2SO4/H2O binay homogeneous nucleation L.-H. Young et al. Title Page Abstract Introduction Conclusions References Tables Figures ◭ ◮ ◭ ◮ Back CloseFull Screen / Esc
Printer-friendly Version Interactive Discussion
Atmos. Chem. Phys. Discuss., 8, 6903–6947, 2008 www.atmos-chem-phys-discuss.net/8/6903/2008/ © Author(s) 2008. This work is distributed under the Creative Commons Attribution 3.0 License.
Atmospheric Chemistry and Physics Discussions
Laboratory studies of H
2
SO
4
/H
2
O binary
homogeneous nucleation from the
SO
2
+
OH reaction: evaluation of the
experimental setup and preliminary
results
L.-H. Young1,2, D. R. Benson1, F. R. Kameel1, and S.-H. Lee1
1
Kent State University, Chemistry Department, Kent, OH 44240, USA
2
China Medical University, Department of Occupational Safety and Health, Taichung, Taiwan Received: 26 February 2008 – Accepted: 11 March 2008 – Published: 9 April 2008
Correspondence to: S.-H. Lee ([email protected])
ACPD
8, 6903–6947, 2008 Laboratory studies of H2SO4/H2O binay homogeneous nucleation L.-H. Young et al. Title Page Abstract Introduction Conclusions References Tables Figures ◭ ◮ ◭ ◮ Back CloseFull Screen / Esc
Printer-friendly Version Interactive Discussion
Abstract
We have developed a new laboratory nucleation setup to study binary homogeneous nucleation (BHN) of sulphuric acid and water (H2SO4/H2O). Here we provide a
de-tailed evaluation of this new experimental setup and also discuss our preliminary results by comparing with other laboratory studies. H2SO4 is produced from the 5
SO2+OH→HSO3reaction and OH radicals are produced from water vapor UV
absorp-tion. The residual H2SO4concentrations ([H2SO4]) are measured at the end of the fast flow nucleation reactor with a chemical ionization mass spectrometer. The measured BHN rates (J) ranged from 0.02 and 550 cm−3s−1 at the residual [H2SO4] from 10
8
to 1010cm−3, a temperature of 288 K and relative humidity (RH) from 6 to 23%; J
10
increased with increasing [H2SO4] and RH. J also showed a power dependence on [H2SO4] with the exponential power of 3 to 8. These results are consistent with other
laboratory studies under similar [H2SO4] and RH, but different from atmospheric field
observations which showed that particle number concentrations are often linearly de-pendent on [H2SO4]. Both particle sizes and number concentrations increased with 15
increasing [H2SO4], RH, and nucleation time, consistent with the predictions from
nu-cleation theories. Particle growth rates were estimated between 28 to 127 nm h−1, much higher than those seen from atmospheric field observations, because of the higher [H2SO4] used in our study. While these experimental results demonstrate a
validation of our laboratory setup, there are also technical difficulties associated with
20
nucleation studies, including wall loss and H2SO4measurements.
1 Introduction
Atmospheric particles affect atmospheric composition, cloud formation, global radia-tion budget, and human health. Nuclearadia-tion is a gas-to-particle conversion process in which new particles form directly from gas phase species (Seinfeld and Pandis, 1998)
25
ACPD
8, 6903–6947, 2008 Laboratory studies of H2SO4/H2O binay homogeneous nucleation L.-H. Young et al. Title Page Abstract Introduction Conclusions References Tables Figures ◭ ◮ ◭ ◮ Back CloseFull Screen / Esc
Printer-friendly Version Interactive Discussion
shown that new particle formation occurs ubiquitously in the atmosphere, ranging from ground-level rural and urban areas to the upper troposphere and lower stratosphere (Kulmala et al., 2004). The most common feature of the new particle formation events is a substantial increase of number concentrations of nucleation mode particles (di-ameter <20 nm), reaching up to 105 to 106cm−3
in the condensable vapor-laden air.
5
The involvement of sulphuric acid (H2SO4) in nucleation has been widely suggested,
with the binary (Vehkam ¨aki et al., 2002; Yu, 2007), ternary (Korhonen et al., 1999; Napari et al., 2002), or ion-induced nucleation (Yu and Turco, 2000; Lee et al., 2003; Lovejoy et al., 2004). However, it was often found the nucleation rates predicted from nucleation theories cannot explain the atmospheric observations and there are large
10
discrepancies (e.g., Weber et al., 1996).
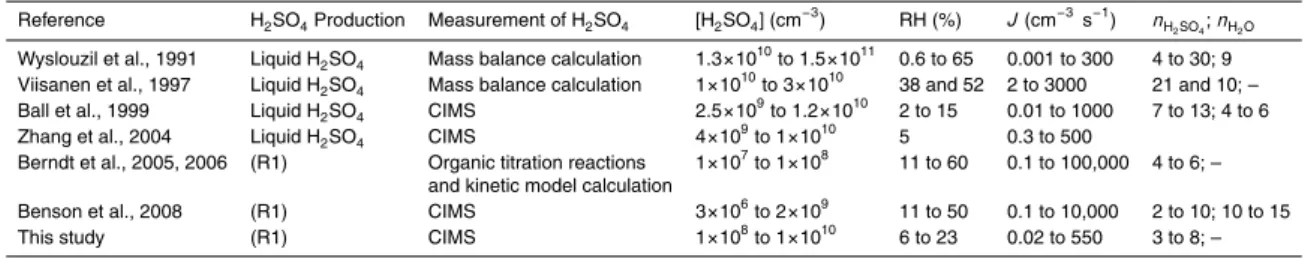
Table 1 summarizes the H2SO4/H2O binary homogeneous nucleation (BHN)
labora-tory studies found in the current literature. Earlier laboralabora-tory studies typically produced H2SO4vapors by vaporizing the liquid H2SO4samples for simplicity and calculated the saturation ratio, relative acidity, or the H2SO4concentration ([H2SO4]) based on mass 15
balance (Reiss et al., 1976; Mirabel and Clavelin, 1978; Wyslouzil et al.,1991; Viisanen et al.,1997). Other studies have produced H2SO4 from gas phase SO2 by means of α-ray irradiation for ion-induced nucleation studies (Diamond et al., 1985; M ¨akel ¨a et al., 1995; Kim et al., 1997). In addition, Christensen et al. (1994) used photolytic excitation of SO2(wavelength between 240 and 330 nm) in NH3/H2O ternary system to produce
20
H2SO4.
A number of H2SO4/H2O BHN studies were performed in continuous-flow reactor
systems. For example, Wyslouzil et al. (1991) investigated the H2SO4, relative humid-ity (RH), and temperature dependence of nucleation rate (J). At relative humidhumid-ity (RH) between 0.6 to 65% and temperatures of 293, 298, and 303 K, they measured J
be-25
tween ∼0.001 to ∼300 cm−3s−1for calculated relative acidities between 0.04 and 0.46; the estimated numbers of H2SO4molecules in the critical cluster ranged from 4 to 30.
Viisanen et al. (1997) measured J between 2 to 3000 cm−3s−1for calculated [H2SO4]
esti-ACPD
8, 6903–6947, 2008 Laboratory studies of H2SO4/H2O binay homogeneous nucleation L.-H. Young et al. Title Page Abstract Introduction Conclusions References Tables Figures ◭ ◮ ◭ ◮ Back CloseFull Screen / Esc
Printer-friendly Version Interactive Discussion
mated numbers of H2SO4 molecules in the critical cluster at 38% and 52% RH are 21 and 10, respectively. Ball et al. (1999) directly measured [H2SO4] with a chemical
ionization mass spectrometer (CIMS) and obtained J ranging from approximately 0.01 to 1000 cm−3s−1 for [H2SO4] between ∼2.5×10⁹–1.2×1010cm−3 at RH from 2–15%, 295 K and ambient pressure. The estimated numbers of H2SO4 and H2O molecules 5
in the critical clusters are between 7 to 13 and 4 to 6, respectively (Ball et al., 1999). With a similar approach with CIMS, Zhang et al. (2004) obtained J ranging from ∼0.3 to 500 cm−3s−1 for [H2SO4] from ∼4×10
9
–1.0×1010cm−3 at RH of ∼5%, 298 K and ambient pressure.
Reiss et al. (1976) and Boulaud et al. (1977) have noted the difficulties with the liquid
10
H2SO4 samples; for example, the corrosiveness and extremely low vapor pressure of H2SO4, and the vapor equilibrium in the carrier gas and the homogeneity of the
H2SO4/H2O mixture are difficult to characterize. Boulaud et al. (1977) used in-situ gas
phase reaction of SO3 + H2O for the production of H2SO4 vapors, and obtained J of 1 cm−3s−1 for [H2SO4] from ∼10
10
–1011cm−3 at RH from 15–70% and 293 K. Berndt
15
et al. (2005, 2006) used the gas phase reaction of SO2+ OH to produce H2SO4vapor,
via the following reactions:
SO2+ OH → HSO3 (Rate limiting step) (R1)
HSO3+ O2→SO3+ HO2 (R2)
SO3+ 2H2O → H2SO4+ H2O (R3)
20
Berndt et al. (2005, 2006) then calculated [H2SO4] from the estimated [OH] and
[SO2]; [OH] was calculated from titration reactions of hydrocarbons and OH. From this
method, they obtained a low threshold for nucleation, [H2SO4] of ∼10 7
cm−3, consid-erably lower than those from other previous laboratory nucleation studies (Viisanen et al., 1997; Ball et al., 1999; Zhang et al., 2004). Recently, Berndt et al. (2007) have also
25
ACPD
8, 6903–6947, 2008 Laboratory studies of H2SO4/H2O binay homogeneous nucleation L.-H. Young et al. Title Page Abstract Introduction Conclusions References Tables Figures ◭ ◮ ◭ ◮ Back CloseFull Screen / Esc
Printer-friendly Version Interactive Discussion
Reactions (R1–R3), in which gas phase HSO5 may be produced to contribute to new particle formation.
We have performed laboratory studies of H2SO4/H2O binary homogeneous
nucle-ation in a fast flow reactor at 288 K, RH from 5 to 25%, and the ambient pressure. Our laboratory system is constructed based on the selective combination of the
exper-5
imental methods utilized in Berndt et al. (2005, 2006), Ball et al. (1999) and Zhang et al. (2004). Similarly to Berndt et al. (2005, 2006), we also used (R1–R3) to in-situ pro-duce H2SO4; but we measure H2SO4 directly with a CIMS, the same method utilized
as in Ball et al. (1999) and Zhang et al. (2004). Unlike Berndt et al. (2005, 2006) where OH forms from ozone UV reactions, in the present study OH is produced by water
10
photolysis to allow direct measurement of [OH]. The primary objective of this study is to evaluate the performance of the nucleation experimental setup from the measured nucleation rates at various [H2SO4] and RH conditions.
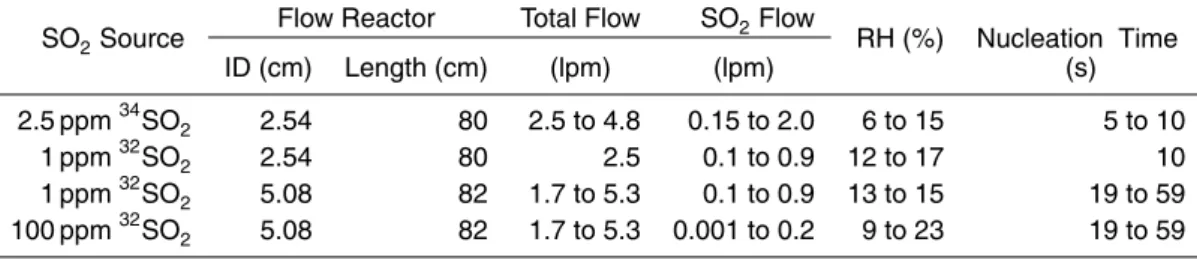
2 Experimental setup
Our nucleation experimental setup consists of (a) an OH generator, (b) a
temperature-15
and RH-controlled, fast flow nucleation reactor, (c) a high sensitivity, atmospheric pres-sure CIMS to meapres-sure low concentrations of H2SO4, and (d) TSI aerosol
spectrome-ters to measure aerosol sizes and concentrations (Fig. 1). Table 2 shows the typical experimental conditions used in the present study.
2.1 OH radical and sulphuric acid generation
20
H2SO4 vapor is produced in-situ via (R1–R3). SO2is taken from standard SO2 gases
(1, 2.5, and 100 ppm) that are further diluted with standard air. OH forms from the photo-dissociation of H2O vapor in a quartz tube (13 cm long with 2.54 cm I.D.), using a mercury lamp (Pen-Ray 11SC-1) filtered for λ<185 nm with a bandpass filter (Omega Optical XB32 185NB20). Both the lamp and the filter are housed inside a
ACPD
8, 6903–6947, 2008 Laboratory studies of H2SO4/H2O binay homogeneous nucleation L.-H. Young et al. Title Page Abstract Introduction Conclusions References Tables Figures ◭ ◮ ◭ ◮ Back CloseFull Screen / Esc
Printer-friendly Version Interactive Discussion
controlled metal box, which is purged with a constant N2 flow rate to provide a stable
photon flux. At the bottom of the box, there is a radiation exit slit with the long side parallel to the flow direction. The photon flux exiting the light source is detected as a function of distance using a solar-blind CsI phototube (Hamamatsu R5764), which is calibrated against a NIST-certified Si photodiode (40599S). The photocurrents are
5
measured with a pico-ampere meter (Keithley 6517A) or converted to voltage signals with resistors and measured by a voltage meter (Fig. 2a). By measuring H2O mixing
ratios and UV photon intensities, [OH] is calculated based on the known photochemical reaction rates (absolute calibration) (Cantrell et al., 1997). For example, the photon flux, I, at radiation wavelength, λ (nm), is determined by:
10
I(λ) = A(λ)
e × ε(λ) (1)
where A is the measured ampere at λ, e is the electronic charge (1.6×10⁻¹⁹C), and ε is the quantum efficiency of the NIST-certified photodiode at λ. [OH] then is calculated from the following equations (Cantrell et al., 1997):
[OH] = JH2O[H2O]tp (2)
15
JH
2O= Iσφ (3)
where JH2O is the H2O photolysis rate, σ the absorption cross-section of water vapor
(σ=7.14×10⁻²⁰cm2molecule−1 (Cantrell et al., 1997),φ the quantum yield [φ(OH)= 1.0 (DeMore et al., 1997)], and tp the photolysis time. [H2O] is determined from the
measured temperature and RH (%):
20 [H2O]= RH 100 ps ptNd (4)
where ps is the H2O saturation vapor pressure [e.g., 1612 Pa (or 12.09 torr) at
ACPD
8, 6903–6947, 2008 Laboratory studies of H2SO4/H2O binay homogeneous nucleation L.-H. Young et al. Title Page Abstract Introduction Conclusions References Tables Figures ◭ ◮ ◭ ◮ Back CloseFull Screen / Esc
Printer-friendly Version Interactive Discussion
of dry air molecules. At typical experimental conditions, A=1.2×10⁻⁵A cm−2, I=1.4×10¹⁴photon cm−2s−1, and hence typically JH2O=9.7×10
−6
s−1. Thus the [OH] produced were at the 109–1010cm−3range as a function of RH and tp(Fig. 2b). When [SO2]≫[OH], the initial [H2SO4]=[OH] based on Reaction (R1).
2.2 Nucleation reactor
5
The nucleation reactor is made of a fast-flow reactor (Pyrex cylinders with a length of 50, 88, or 100 cm and with an inner diameter of 2.54 or 5.08 cm) with a laminar, fast flow. The reactor is also controlled for temperature with a refrigerating/heating circulating bath (Cole-Parmer Model 12101-31) and washed with distilled water daily to remove H2SO4 and particles deposited on its inside wall during the previous day’s
10
experiments. The total pressure in the nucleation reactor is ∼97.3 kPa (slightly higher than the room air pressure to prevent leak from the room air), 288 K, and the RH of ∼5– 25%. The total flow rate is up to 1.7–5.3 l min−1and tnwas estimated to be from 5–59 s, when assuming that nucleation occurs in the entire nucleation reactor. We believe that this time scale is sufficient for converting SO2to H2SO4and also for particle nucleation 15
and yet, short enough to minimize the wall loss of H2SO4and particles. The measured aerosol sizes and number concentrations increased with increasing tn (in the range
from 4–57 s), indicating that nucleation dominates over condensation processes and in this condition, tn can be assumed to be the same as the residence time in the nucleation reactor.
20
Because of the wall loss and condensation of H2SO4, the CIMS-measured [H2SO4]
is not the initial [H2SO4] and is rather the equilibrium or residual [H2SO4]. This is the same situation as with other nucleation studies that used CIMS (Ball et al., 1999; Zhang et al., 2004). In the present study, we provide the CIMS-measured, residual [H2SO4]
to compare with these other studies using CIMS, but we also provide wall loss factors
25
(WLFs) (the ratios of the initial [H2SO4] over the residual [H2SO4] at the end of the nucleation reactor) and the initial [H2SO4] (which are the same as the produced [OH],
ACPD
8, 6903–6947, 2008 Laboratory studies of H2SO4/H2O binay homogeneous nucleation L.-H. Young et al. Title Page Abstract Introduction Conclusions References Tables Figures ◭ ◮ ◭ ◮ Back CloseFull Screen / Esc
Printer-friendly Version Interactive Discussion
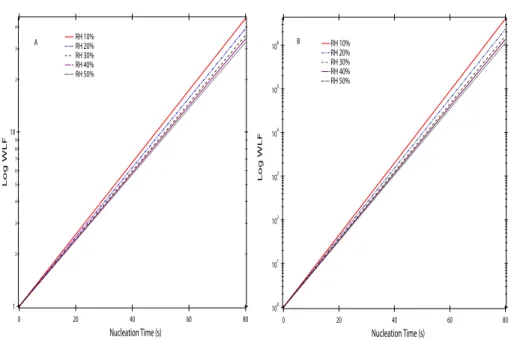
because [SO2] ′′
[OH]) (Fig. 2b). WLFs of H2SO4were estimated by assuming that wall
loss is a diffusion-limited process based on Hanson and Eisele (2000) and Benson et al. (2008). Figure 3 shows the calculated the WLFs as a function of tn and RH for
different nucleation tubes used in this study (I.D.=5.08 cm and 2.54 cm). At the typical experimental conditions used in this study, the estimated wall loss factors ranged from
5
2 to 12 for the tn from 20 to 54 s and RH from 5 to 25% for the nucleation reactor with
I.D. 5.08 cm (Fig. 3a).
2.3 Particle measurements
A nanoparticle differential mobility analyzer (Nano-DMA) (TSI 3080N) and an ultrafine water condensation particle counter (CPC) (TSI 3786) are used for particle number
10
and size distribution measurements. These aerosol instruments were operated in two modes, the CPC standalone mode and the Nano-DMA/CPC combination mode. In the standalone mode, CPC has a 50% detection efficiency at ∼2.5 nm and gives total particle number concentrations every 5 s. The CPC inlet flow is set at 0.6 liter per min (lpm). In the Nano-DMA/CPC combination mode, size-resolved particle number
15
concentrations are obtained from 2.5–102 nm every 180 s. The SMPS inlet and sheath flows are set at 0.6 and 6 lpm, respectively.
The integrated “total” particle number concentrations from the combination mode were on average five to ten times lower than the total particle number concentrations from the standalone mode. This concentration difference is in part because of the
ad-20
ditional tubing length involved in the SMPS/CPC measurement in this study. Based on Baron and Willeke (2001), the estimated fractional penetration efficiency of 3 nm particles through the additional 39-cm long cylindrical tubing at 0.6 lpm is 0.65. In addi-tion, it is possible that the CPC may be able to detect H2SO4particles smaller than the stated minimum measurable size (∼2.5 nm). When the CPC is operated with the
nano-25
SMPS, some of the particles smaller than 2.5 nm may be excluded in the nano-DMA, hence further contributing to the concentration difference. Note that however Berndt et al. (2006) showed reasonable agreement between the combination and standalone
ACPD
8, 6903–6947, 2008 Laboratory studies of H2SO4/H2O binay homogeneous nucleation L.-H. Young et al. Title Page Abstract Introduction Conclusions References Tables Figures ◭ ◮ ◭ ◮ Back CloseFull Screen / Esc
Printer-friendly Version Interactive Discussion
mode as opposed to the findings in the present study.
The J were determined by the measured particle number concentrations (N) and tn. In most cases the N were determined using the CPC standalone mode, except when the size distribution measurements were involved. Because critical clusters (∼1 nm) are typically smaller than the minimum measurable size of the CPC, the J reported
5
here, strictly speaking, is not the actual nucleation rate, but rather the formation rate of particles with diameters larger than ∼2.5 nm, the so-called “apparent formation rate” (Kerminen and Kulmala, 2002). However, when condensation and coagulation growth are negligible which was the case for most of our experiments, the values estimated from such a calculation are close to the actual J values (Kulmala et al., 2004).
10
The numbers of H2SO4molecules (n) in the critical clusters are calculated with the J vs. [H2SO4] at specific values of RH and absolute temperature T , based on the first
nucleation theorem (Kashchiev, 1982; Strey and Viisanen, 1993): ∂ln J ∂ln[a1] a 2,T ≈n (5)
where a1 and a2 are the activity of species 1 and 2, respectively. In practice, the n
15
values for H2SO4molecules can be approximated by fitting the data points with power
regression:
J = c[H2SO4]n (6)
where c is a constant, at specific values of temperature and RH. 2.4 H2SO4-CIMS
20
Our CIMS was built by Greg Huey’s group at Georgia Tech based on (Eisele and Tan-ner, 1993). The CIMS instrument is constructed from an ion source, an ion molecular reactor, and a quadrupole mass spectrometer. The following ion molecule reaction NO−
3 + H2SO4→HNO3+ HSO −
ACPD
8, 6903–6947, 2008 Laboratory studies of H2SO4/H2O binay homogeneous nucleation L.-H. Young et al. Title Page Abstract Introduction Conclusions References Tables Figures ◭ ◮ ◭ ◮ Back CloseFull Screen / Esc
Printer-friendly Version Interactive Discussion
is used to detect H2SO4(Viggiano et al., 1997). This reaction scheme has been proven to be very effective for H2SO4measurements, and this is one of the very few methods
currently available to detect H2SO4 at atmospheric concentrations. This low detection
limit is achieved because of its high reaction rate, high selectivity against other species, and the atmospheric pressure ionization used.
5
The210Poradiation source is used as an ion source. The ion source region also has
a unique design to prevent artifact H2SO4 detection. Because OH radicals also form from water molecule dissociation reactions in the ion source region (210Po radiation), there is a possibility that those OH radicals react immediately with the SO2 in the air
samples to produce H2SO4. To eliminate such artifacts of H2SO4 formation, a weak 10
electric field is applied between the ion source region and the center of the sampling inlet so that only the electrically charged NO−3 ions (not the neutral OH radicals) travel through to the center of the sampling inlet to react with H2SO4. In addition, C3F6
gases are also mixed with HNO3 gases so that OH radicals are efficiently removed by C3F6. With the current CIMS configuration, the background [H2SO4] is negligible 15
even when high concentrations of SO2gases are introduced into the CIMS. A collision
dissociation chamber (CDC) is applied to dissociate the weakly bonded ion molecule clusters of sulphuric acid, nitric acid, and water molecules by low energy collisions with N2 molecules to provide simpler ion peaks. Ions are focused by an octopole
before reaching the quadrupole mass filter (Extrel) and then detected by a channeltron
20
detector (K+M). The pressures in the CDC, octopole, and quadrupole are about 101, 10−1, and 10−3Pa, respectively.
[H2SO4] are calculated from the ratio of the HSO− 4 to NO
−
3 ion counts [HSO − 4]/[NO
− 3],
the rate constant k of (R1), and the reaction time tr based on Huey (2007):
[H2SO4] ≈ [HSO−4] [NO− 3]ktr (7) 25
Where k for (R1) is 1×10⁻⁹cm3molecule−1s−1(Viggiano et al., 1997) and tris typically 0.05 s under the present experimental setup. [NO−
3] (that is, [N 16
O−
indi-ACPD
8, 6903–6947, 2008 Laboratory studies of H2SO4/H2O binay homogeneous nucleation L.-H. Young et al. Title Page Abstract Introduction Conclusions References Tables Figures ◭ ◮ ◭ ◮ Back CloseFull Screen / Esc
Printer-friendly Version Interactive Discussion
rectly by measuring its isotope [N18O−3] and by taking the natural isotopic ratio of 16O and18O abundances (99.8%:0.2%) into account. Although [N18O−3] varied from day to day, the resulting [HSO−
4]/[NO −
3] ratio is fairly constant for a given [H2SO4]. Before each
experimental run, the CIMS is adjusted to obtain [N18O−3] between 1500 to 3500 Hz. Thus [NO−3] are from 8×10⁵ to 2×106cm−3 and in this condition, 1 Hz of HSO−4 ion
5
count corresponds to [H2SO4] from 1×10 4
to 3×104cm−4. Since the instrument noise of [HSO−
4] is ∼20 Hz, the CIMS detection limit for H2SO4is from 2×10 5
to 6×105cm−4. 2.5 Flow rate, RH and temperature measurements
The total flow rate (Qtotal) typically ranged from 1.7 to 5.3 lpm and composed primarily of
SO2and N2. The SO2flow rate (QSO2) varied between 0.01 to 2 lpm, depending on the 10
SO2 concentration of the cylinder. The dry N2 flow rate was adjusted simultaneously with the QSO2 to maintain a constant total flow. The H2O flow (i.e., humidified N2flow)
varied between 0.01 to 0.2 lpm to maintain the target RH values. The O2 flow was
maintained at 0.001 lpm regardless of the total flow rate.
The photolysis tube was exposed to indoor temperature (295±2 K), and the
nucle-15
ation tube was maintained at 288±0.05 K with a refrigerating circulating bath (Cole-Parmer Model 12101-31). RH is controlled mainly by changing the flow rates of wa-ter vapor into the nucleation reactor. There are three sets of temperature, RH, and pressure sensors in our nucleation reactor, temperature/humidity sensors (Campbell Scientific CS215) and pressure gauges (Granville-Phillips 275).
20
Only high purity standard gases (nitrogen, oxygen, SO2 and NH3) (Linde Gas and
Airgas Inc.) and distilled water are introduced in the nucleation region. We have used the silicon phosphates ammonia scrubber (Perma Pure Inc.) to test the effects of possi-ble ammonia impurities in our system on the H2SO4–H2O BHN experiments, and those
effects were found negligible. Test results with CO scrubbers (Carus Carulite 300) also
25
ACPD
8, 6903–6947, 2008 Laboratory studies of H2SO4/H2O binay homogeneous nucleation L.-H. Young et al. Title Page Abstract Introduction Conclusions References Tables Figures ◭ ◮ ◭ ◮ Back CloseFull Screen / Esc
Printer-friendly Version Interactive Discussion
flows of these gases in the water photolysis cell, the nucleation reactor, and CIMS are controlled with seven high precision mass flow controllers (MKS). These mass flow controllers were also regularly calibrated with a standard flow meter (DryCal DC-2, Bio International Corp.).
3 Experiment results
5
3.1 SO2, OH, H2O and O2effects on H2SO4and particle production
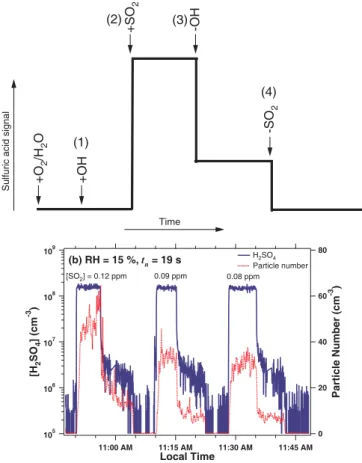
In order to confirm that nucleation takes place via (R1–R3) as designed, we first ex-amined the effects of precursor gases by observing the changes in the production of H2SO4and new particles after adding or removing the gas phase species in question. Figure 4 shows how H2SO4 and particle concentrations are affected by SO2 and OH 10
at RH of 15% and tn of 19 s. The production of OH was controlled by switching the
UV radiation on or off in the presence of H2O vapor. Figure 4a shows the experiment
sequence, (1) adding OH, (2) adding OH and SO2together, (3) removing OH only, and
(4) removing both SO2 and OH from the flow reactor, in the presence of H2O vapor
and O2. This sequence was repeated for three runs with different QSO2 of 0.6, 0.45, 15
to 0.4 lpm. The respective initial SO2 concentrations [SO2], calculated based on the
SO2 source concentration and the ratio of the QSO2 to the Qtotal, were 0.12, 0.09, and
0.08 ppm. Figure 4b shows the distinctive rise or drop of [H2SO4] when switching the QSO
2 on or off and these results confirm that H2SO4 vapor has formed from (R1–R3)
and new particles formed via nucleation involving H2SO4vapor. 20
Figure 4b also shows that there was no production of H2SO4and new particles un-less SO2was added to OH, O2, and H2O (steps (1) and (2)). It was consistent
through-out our experiments that the background values of [H2SO4] and N were negligible in
the absence of SO2, indicating that the experimental setup was well constructed and the flow reactor is fairly clean. However, at step (3) in the absence of OH and in the
25
ACPD
8, 6903–6947, 2008 Laboratory studies of H2SO4/H2O binay homogeneous nucleation L.-H. Young et al. Title Page Abstract Introduction Conclusions References Tables Figures ◭ ◮ ◭ ◮ Back CloseFull Screen / Esc
Printer-friendly Version Interactive Discussion
the initial background values (without SO2). This result was not expected from (R1– R3). In addition, since we have used much higher [SO2] than [OH] (at least three
orders of magnitude higher), [H2SO4] should be the same as [OH] and independent
of [SO2] and thus N would also be constant at the same tn and RH. However, from the first sequence run to the third one, the gradual decrease of [H2SO4] from 1.6×10⁸
5
to 1.5×108cm−3 and N from 48 to 30 cm−3 was a result of the reduced amount of SO2 added to the system (Fig. 4b). Figure 5a shows more distinctive dependence of
[H2SO4] and N on [SO2] at constant RH and tn. Similar dependence of N and [H2SO4] on [SO2] can be seen from other figures presented here (Figs. 6–12). This [H2SO4]
de-pendence on [SO2], together with [H2SO4] and new particle production in the absence 10
of OH, suggest a possible incomplete mixing between SO2and OH or/and an unknown process of the H2SO4and new particle production, as will be discussed in Sect. 4.6.
With similar experiment sequences, we tested the effects of H2O on the production
of H2SO4 and particles. As expected, removing H2O reduced the production of both H2SO4 and new particles. For example, with the presence of H2O, [H2SO4] and N 15
were 1.6×108cm−3 and 9 cm−3, respectively, at RH=15%, whereas with the removal of H2O, [H2SO4] and N were 7.2×10
6
cm−3 and 4 cm−3, respectively (not shown). It is noted that, due to the experimental setup, the removal of H2O vapor did not make the system completely free of H2O and the minimum RH attained in the current system
was 4%.
20
In contrast to the cases of SO2, OH and water, the removal of O2 from the system had only minor effects on the production of H2SO4and new particles. With or without
O2, the [H2SO4] and N were nearly the same. In addition, both the [H2SO4] and N
became more fluctuating without O2. The lack of O2effects was not expected because SO3would not form without O2, according to Reaction (R2). We believe there was no 25
leak into the system from the room air, because the pressure of the flow reactor was always maintained above the ambient pressure. Some O2 may have come from the gas cylinders as a part of the impurities.
ACPD
8, 6903–6947, 2008 Laboratory studies of H2SO4/H2O binay homogeneous nucleation L.-H. Young et al. Title Page Abstract Introduction Conclusions References Tables Figures ◭ ◮ ◭ ◮ Back CloseFull Screen / Esc
Printer-friendly Version Interactive Discussion
100 ppm), to obtain a given J value. We also have seen that a substantially higher initial [SO2] was required when diluting the SO2 from the 100 ppm cylinder than from the 1 ppm cylinder (Fig. 5). Figure 5 shows the measured [H2SO4] and N at RH of
15%, Qtotal of 5 lpm and tn of 19 s. For example, it required an initial [SO2] of 3.2 ppm
for the 100-ppm experiment to obtain J of 0.8 cm−3
s−1
, while only 0.08 ppm SO2was
5
required for the 1-ppm experiment to form similar numbers of new particles. The flow ratios of QSO2 to Qtotal were from 0.03–0.15 and from 0.025–0.04 for the 1 ppm and
100 ppm SO2 cylinder experiments, respectively. Because SO2 molecules were re-leased near the centerline of the flow reactor, it would take a longer time for SO2
molecules to be vigorously mixed with OH radicals at lower mixing ratios than at higher
10
mixing ratios. This will lead to a reduced production efficiency of H2SO4, hence lower
particle production. If the data for the 100 ppm experiment were extrapolated to [SO2]
of 0.03 ppm, the expected [H2SO4] would be 8.1×10 7
cm−3, which is in fact about a fac-tor of two lower than the measured [H2SO4] (1.4×10
8
cm−3) from the 1 ppm experiment with the same [SO2]. The extrapolated results clearly suggest the H2SO4 production
15
efficiency of 100 ppm experiments is lower than the 1 ppm experiments. However, this “non-overlapping” data may suggest something more complex than we currently un-derstand.
3.2 Nucleation time (tn) dependence of particle numbers (N) and [H2SO4]
Figure 6 shows the effects of tn on the production of H2SO4 and N. tn was varied 20
between 4 and 9 s, by using two nucleation tubes with similar lengths (L of 80 cm and 82 cm) but different diameters (I.D.=2.54 cm and 5.08 cm) at Qtotal of 5 lpm and RH of
15%. The initial [SO2] varied from 0.03 to 0.15 ppm in the two experiments and were
identical for these two different tn at the constant Qtotal. Astn increased from 4 to 19 s ,
N increased while [H2SO4] decreased. The positive correlation between the N and tn
25
suggests that the nucleation process, rather than the condensation process, dominates within the tn from 4 to 19 s. Therefore, again it is reasonable to assume tn values are
ACPD
8, 6903–6947, 2008 Laboratory studies of H2SO4/H2O binay homogeneous nucleation L.-H. Young et al. Title Page Abstract Introduction Conclusions References Tables Figures ◭ ◮ ◭ ◮ Back CloseFull Screen / Esc
Printer-friendly Version Interactive Discussion
the same as the flow residence times in such a condition. Note that the calculated J from the experiments with tnof 4 s and 19 s were on the same order of magnitude (0.3– 2.1 cm−3s−1vs. 0.3–2.7 cm−3s−1), but the CIMS-measured [H2SO4] were different. In
fact, [H2SO4] at tn of 4 s was about a factor of two higher than that at tn of 19 s (1.2–
2.1×108cm−3 vs. 3.2–5.8×108cm−3). Since the J values were comparable, it is likely
5
that the [H2SO4] difference was mostly due to the increased wall loss at longer tn.
These results also highlight a technical issue when comparing [H2SO4] with different
tn.
Figure 7 also shows the similar wall loss effects on the residual [H2SO4]. At Qtotal
of 4.1, 2.6, and 1.8 lpm (the corresponding tnwere 24, 37, and 54 s, respectively) and 10
QSO
2 varied between 0.03 and 0.15 lpm and with similar initial [SO2] (i.e., 4.9, 4.6, and
4.4 ppm), the CIMS-measured [H2SO4] decreased from 2.5×10⁹ to 1×108cm−3 with increasing tn.
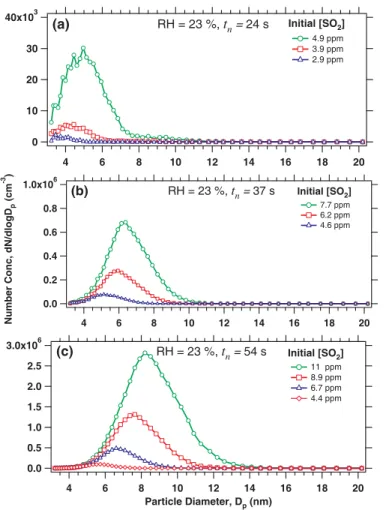
3.3 Number concentrations (N) vs. particle sizes (Dp)
We also investigated how N varies with Dp and how N and Dp vary as a function of 15
tn and the initial [SO2] at constant RH (e.g., 23%) (Figs. 8 and 9). In this series of experiments, Qtotalwas decreased to increase tn and the initial [SO2]. At RH of 23%
and tnof 24 s, when the initial [SO2] was raised from 2.9 to 4.9 ppm, N increased from
220 to 6.9×103cm−3and Dpincreased from 3.6 to 5.0 nm (Fig. 8a). The corresponding [H2SO4] ranged from 1.5×10
9
to 2.4×109cm−3. Such increases of N and Dp with 20
increasing initial [SO2] were even more substantial at the tn of 54 s; the N increased
from 1.4×10⁴to 5.5×105cm−3and the Dpincreased from 5.6 to 8.2 nm when the initial
[SO2] increased from 4.4 to 11.1 ppm (Fig. 8c). As tn increased from 24 to 54 s, with similar initial [SO2] (4.9, 4.6, and 4.4 ppm), N also increased from 6.9×10
3
to 1.4×104 cm−3and the Dpincreased from 5.0 to 5.7 nm (Fig. 9). These results indicate larger N 25
and Dpat higher tn, consistent with the predictions from nucleation theories. However,
ACPD
8, 6903–6947, 2008 Laboratory studies of H2SO4/H2O binay homogeneous nucleation L.-H. Young et al. Title Page Abstract Introduction Conclusions References Tables Figures ◭ ◮ ◭ ◮ Back CloseFull Screen / Esc
Printer-friendly Version Interactive Discussion
related to Dp, which brings additional complexity to the interpretation of J from the measured N and tn.
3.4 The RH effects on nucleation rate (J) and particle size (Dp)
Figure 10 shows the RH effects on the production of H2SO4and particles at constant tn
(e.g., 19 s). Qtotal(5 lpm) and the nucleation reactor’s I.D. (5.08 cm) and L (82 cm) were
5
identical for these three RH levels. The initial [SO2] was between 2.4 and 4 ppm for RH
of 11 and 15%, while the initial [SO2] was between 0.2 and 1 ppm for RH of 23%. At
[SO2] of 2.4 ppm, for example, [H2SO4] and J doubled from 6.5×10 8
to 1.6×109cm−3 and 1 to 2 cm−3s−1, respectively, when the RH was raised from 11 to 15%, showing higher productions of H2SO4and N at higher RH.
10
Figure 11 shows the particle size distributions measured at QSO2 of 0.1 lpm, Qtotalof
2.6 lpm, the initial [SO2] of 3.8 ppm, and tn of 38 s for RH of 22%, 26%, and 30%. As RH increased from 22 to 30%, the CIMS-measured [H2SO4] increased from 7.3×10⁸to 1.0×109cm−3and N increased from 5.9×10³to 1.1×105cm−3. The calculated J were 160, 810, 3010 cm−3s−1at 22%, 26%, and 30% RH, respectively. The mode
diame-15
ter also increased from 5.1 to 6.4 nm with increasing RH due to the increased H2SO4 production and particle growth. These results are consistent with the predictions of nu-cleation theories, higher H2SO4production, higher nucleation rates and larger particle
sizes at higher RH.
3.5 The34SO2experiments 20
The SO2 + OH experiments were also carried out with 2.5 ppm isotope34SO2gases, instead of 32SO2 gases, to test the validity of our nucleation experiments (Fig. 12).
These isotope experiments were made at RH of 15%, temperature of 288 K, tn of
10 s and the initial [SO2] ranging from 0.15–0.9 ppm. When the 34
SO2 gases were
introduced into the system, both H34SO−
4 and H 32
SO−
4 ion peaks appeared and they 25
ACPD
8, 6903–6947, 2008 Laboratory studies of H2SO4/H2O binay homogeneous nucleation L.-H. Young et al. Title Page Abstract Introduction Conclusions References Tables Figures ◭ ◮ ◭ ◮ Back CloseFull Screen / Esc
Printer-friendly Version Interactive Discussion
were positively correlated with the34SO2 flow rates, consistent with the 32
SO2results
(e.g., Fig. 11). The H322 SO4in Fig. 12a was resulted from the impurity of 32
SO2 in the 34
SO2gas cylinder.
4 Discussions
4.1 Uncertainties in the particle measurement
5
The measured particle concentrations were generally not as stable and reproducible as the H2SO4measurements. Overall, the relative standard deviation for the [H2SO4] is only 0.06 and for the N is 0.39 during a 23-min period of the experiments, for example. Most of the present data however were taken over a much shorter period (<3 min). The reproducibility of the particle and H2SO4 measurements can be examined when the
10
same experimental condition is repeated several times. For example, the percentage differences between two measurements with the same [SO2] were less than 6% for the
[H2SO4] and between 8–10% for the N (Fig. 10c). In addition, as described in Sect. 2.3, there are differences of a factor of five to ten between the N values measured by the CPC standalone mode and by the SMPS/CPC combination mode.
15
4.2 H2SO4wall loss and its effects on the CIMS-measured [H2SO4]
Figure 13 shows hypothetical processes that are involved in H2SO4 loss in the nucle-ation reactor, including loss to the wall, by nuclenucle-ation and condensnucle-ation. There are substantial wall losses of H2SO4 inside the flow reactor and as shown by the lower
[H2SO4] at longer tn (Figs. 6 and 7). The wall loss is a limitation of flow tube
experi-20
ments, especially when the nucleation reactors have small inner diameter. In addition, other processes which can enhance or reduce the H2SO4 losses will also change the
ACPD
8, 6903–6947, 2008 Laboratory studies of H2SO4/H2O binay homogeneous nucleation L.-H. Young et al. Title Page Abstract Introduction Conclusions References Tables Figures ◭ ◮ ◭ ◮ Back CloseFull Screen / Esc
Printer-friendly Version Interactive Discussion
Firstly, the H2SO4 wall loss depends on the flow rate, tube length, and diffusion co-efficient. As shown in Figs. 6 and 7, we observed an anti-correlation between [H2SO4]
and tn. This observation is consistent with Hanson and Eisele (2000) which showed
that wall loss of H2SO4 in a fast flow reactor can be expressed with a first order rate and nucleation time (as illustrated in Fig. 3). This trend can also be attributed to the
5
higher particle concentration and hence more H2SO4 loss via nucleation as well as
condensation, especially at longer tn. The second factor is less important when the J is small.
Secondly, in the present experimental setup, H2O molecules participate in both the
H2SO4 formation and aerosol nucleation process. This is because increasing [H2O]
10
would increase the [OH] and thus H2SO4production (R1), and also favor the hydration of H2SO4 molecules. The addition of H2O molecules to H2SO4 molecules can also
reduce the diffusion coefficients and thus decrease the wall loss. For example, Hanson and Eisele (2000) found a ∼20% reduction in effective diffusion coefficients of H2SO4
as RH increased from 0 to 40%. Such RH effects are also shown on the estimated
15
WLFs (Fig. 3). The overall RH effect is an increase of the particle production and the penetration efficiency of H2SO4molecules at higher RH.
From the above qualitative assessments of the wall loss of H2SO4, there are several
factors that can affect the CIMS-measured, residual [H2SO4], including RH, tn, and the
diameter of the nucleation reactor. Most of these factors are dependent on the
exper-20
imental setup, such as the physical dimensions and flow characteristics. Therefore, comparisons of the [H2SO4] measured by CIMS and nucleation rates from different
studies require a caution.
4.3 Nucleation rate (J) calculations
There are several factors that should be taken into account for nucleation rate
calcula-25
tions, including particle sizes, tn, [H2SO4] and RH. In nucleation experiments, particle
nucleation rates are calculated from the measured N and tn. The calculated J values shown here, as well as in other laboratory studies such as Ball et al. (1999), Zhang et
ACPD
8, 6903–6947, 2008 Laboratory studies of H2SO4/H2O binay homogeneous nucleation L.-H. Young et al. Title Page Abstract Introduction Conclusions References Tables Figures ◭ ◮ ◭ ◮ Back CloseFull Screen / Esc
Printer-friendly Version Interactive Discussion
al. (2004) and Berndt et al. (2005, 2006), are the production rates of particles larger than 3 nm, and thus again the “apparent” formation rates. Several competing pro-cesses simultaneously take place in the nucleation reactor, such as nucleation, wall loss, and coagulation and condensation growth (Fig. 13). These processes, however, also affect the measured [H2SO4], N, and Dp, and in turn, affect the calculated J and 5
the J dependence on [H2SO4](Fig. 14).
Our results show that the measured particles are not at the same size and both the N and Dp vary as a function of [H2SO4], RH and tn (Figs. 8, 9, 11). Also, at high tn, the condensation growth and wall loss of H2SO4becomes more important. At higher J
values, N can be even anti-correlated with [H2SO4] (Benson et al., 2008), because con-10
densation growth becomes to dominate over nucleation processes with larger particle surface areas (at higher N and Dp). If coagulation process is comparable to that of the
nucleation process, it will lead to the reduced N and subsequently underestimated J (Wyslouzil et al., 1991). In addition, this kind of error increases with increasing particle number concentration (or J values). Under such a circumstance, the underestimated
15
J at the high end of the concentration range will in turn reduce the steepness of the slope of the power relationship between J and [H2SO4]. On the other hand, enhanced condensation growth will allow more particles to grow larger than 3 nm, leading to an increase of N and subsequently an overestimated J (Kulmala et al., 2006). Ball et al. (1999) have noted that the predicted J values are larger than the observed J values
20
at the low and high-end of the [H2SO4] range when using a single power regression.
To obtain accurate “apparent” formation rates (which are referred as to J in this study), nucleation experiments must be conducted below the level at which nucleation dominates over coagulation or condensation growth process (for example, at lower H2SO4 concentrations, lower particle number concentrations and shorter tn). The ef-25
fect of condensation growth is unavoidable, however, because H2SO4 condensation is needed for nucleation. To reduce such effects of condensation and coagulation on the measured J values, the measured N can be extrapolated at a specific Dp (e.g.,
ACPD
8, 6903–6947, 2008 Laboratory studies of H2SO4/H2O binay homogeneous nucleation L.-H. Young et al. Title Page Abstract Introduction Conclusions References Tables Figures ◭ ◮ ◭ ◮ Back CloseFull Screen / Esc
Printer-friendly Version Interactive Discussion
allow one to obtain J values that are more representative of the “true” nucleation rates (i.e., the formation rate of the critical clusters). In the present study, we report the measured “apparent” formation rates to directly compare with other laboratory kinetics experiments.
4.4 Particle sizes (Dp) and growth rates 5
The sizes of the newly formed particles, Dp, were predominantly smaller than 10 nm
(Figs. 8 and 11), indicating that nucleation takes place via the gas-phase homogeneous nucleation from the SO2 + OH reaction (R1). In addition, the mode diameter of the
newly formed particles shifts towards larger sizes with increasing N and [H2SO4]. For example, the mode diameter increased from 5.0 to 5.1, to 5.7 nm as tnincreased from 10
24 to 37, to 54 s (Fig. 9). This translates to growth rates roughly ranging from 28 to 127 nm h−1
(average ∼84 nm h−1
). In field observations, on the other hand, the derived growth rates are in the range of 1 to 20 nm h−1(Kulmala et al., 2004). The high particle growth rates taken from our experiments are probably due to the fact that the particle precursor concentrations were much higher than those in the atmosphere. But from the
15
viewpoint of experimental design, however, large particle growth rates allow us to grow newly formed particles to measurable sizes (>2.5 nm) within a shorter timeframe (e.g., <60 s). To accommodate such high growth rates, very high initial [H2SO4] is required. On the other hand, the high initial [H2SO4] can also increase J and therefore, H2SO4
dependence of J can also be overestimated (Sect. 4.5.)
20
4.5 Dependence of nucleation rates (J) on [H2SO4], RH and nucleation time (tn)
A summary of the measured [H2SO4] and J at 288 K, 97.3 kPa, and RH of 11%, 15%, and 23% is given in Table 3. At RH of 11%, the measured J ranged from 0.03 to 1.1 cm−3s−1 for [H2SO4] (measured by CIMS at the end of the nucleation reactor)
between 5.2×10⁸ and 1.9×109cm−3. The estimated number of H2SO4 molecules (n)
25
ACPD
8, 6903–6947, 2008 Laboratory studies of H2SO4/H2O binay homogeneous nucleation L.-H. Young et al. Title Page Abstract Introduction Conclusions References Tables Figures ◭ ◮ ◭ ◮ Back CloseFull Screen / Esc
Printer-friendly Version Interactive Discussion
0.02 to 8.5 cm−3s−1 for [H2SO4] between 8.9×10 7
and 3.9×109cm−3; the n values ranged from 4 to 8. At RH of 23%, the measured J ranged from 0.16 to 550 cm−3s−1 for [H2SO4] between 8.7×10⁷and 9.6×109cm−3; the n values were ∼3. These n values were derived from the slopes of J vs. [H2SO4] plots (Fig. 14).
Figure 14a shows the measured J as a function of [H2SO4] from the present study 5
from the SO2 + OH reaction. We also included here the J values cited from earlier studies by Ball et al. (1999) and Berndt et al. (2006) for comparison (Fig. 14b). The data points from the present study fall between those from these two earlier studies. In this study, the slopes at RH of 23% are not as steep as that at RH of 11 and 15%; n increased from ∼3 to ∼8 when RH decreased from 23% to 15%. These results indicate
10
that there are less H2SO4 molecules in the critical clusters at higher RH, as predicted
from the nucleation theories. The increased n with decreasing RH is consistent with nucleation theories and also consistent with Ball et al. (1999) and Berndt et al. (2005, 2006) results. The slopes at RH of 15%, however, are not distinctly different from that at RH of 11% (4–8 vs. 3–6). Interestingly, the n values at RH of 15% and 10% from
15
Ball et al. (1999) were also not very different from each other (7 vs. 8). Nevertheless, the n value increased from 7 to 13 when the RH was lowered from 15 to 2% in Ball et al. (1999). The data points from this study (group B) at RH of 15% and tnof 19 s (from 100 ppm source cylinder experiments) nearly overlap with those from Ball et al. (1999)’s liquid H2SO4experiments at RH of 15%.
20
In order to measure the H2SO4/H2O binary J of 1 cm −3
s−1, in the present study the minimum residual [H2SO4] was at the 108cm−3 range at RH between 11 to 23% and 288 K (Fig. 14). In Berndt et al. (2005, 2006), however, the residual [H2SO4] of
∼107cm−3 was sufficient to produce J of 1 cm−3s−1 at RH of 11%, 22%, and 288 K. In Ball et al. (1999), [H2SO4] of ∼10
9
cm−3 was needed at RH between 2 and 15%
25
and 295 K for binary and ternary (with NH3) homogeneous nucleation. A recent re-fined kinetic quasi-unary nucleation model for H2SO4/H2O shows that the initial (or
nucleation-zone) [H2SO4] has to be at least 10 11
cm−3 to observe significant binary J at RH<20% and 300 K (Yu, 2007).
ACPD
8, 6903–6947, 2008 Laboratory studies of H2SO4/H2O binay homogeneous nucleation L.-H. Young et al. Title Page Abstract Introduction Conclusions References Tables Figures ◭ ◮ ◭ ◮ Back CloseFull Screen / Esc
Printer-friendly Version Interactive Discussion
The number of H2SO4 molecules in the critical clusters obtained from laboratory studies of H2SO4/H2O binary homogenous nucleation is typically larger than 3 and
even up to ∼30 for [H2SO4] between ∼10 7
to 1011molecules cm−3 (this study; Wys-louzil et al., 1991; Viisanen et al., 1997; Ball et al., 1999; Berndt et al., 2005; Berndt et al., 2006; Benson et al., 2008). These numbers are much higher than those
ac-5
tually observed in the atmospheres. Field studies have shown that that the number of H2SO4 molecules in the critical clusters is often between one and two (Weber et
al., 1996; Sihto et al., 2006; McMurry and Eisele, 2005). Such discrepancy raises questions on whether the binary homogeneous nucleation is the primary nucleation mechanism in the atmosphere. Recently, Kulmala et al. (2006) proposed an activation
10
theory of ion or neutral clusters containing one or two H2SO4molecules to explain the field observations, but further experimental work will be required to prove their theory. 4.6 H2SO4and particle formation in the absence of OH
Although it is not the focus of the present study, we observed that H2SO4and particle
formation in the absence of OH, i.e., only from SO2, O2, and water vapor. There
15
are several experimental results related to this observation. Firstly, this feature is shown in Fig. 4. Secondly, it was consistent from our experiments that the mea-sured [H2SO4] and particles were directly related to the initial [SO2] (Figs. 4–12), even though [SO2]≫[OH] and therefore, the produced [H2SO4] from (R1) should be the
same as [OH] and independent from [SO2]. Finally, the estimated growth rates (28 20
to 127 nm h−1) from our experiments are much higher than those predicted from the initial [H2SO4] of 10
9
cm−3 (Fig. 2b). These results suggest that there may be some unknown oxidation processes in the absence of OH, related to H2SO4and new particle
formation. However, future studies are required to better understand the mechanisms involved in these processes.
ACPD
8, 6903–6947, 2008 Laboratory studies of H2SO4/H2O binay homogeneous nucleation L.-H. Young et al. Title Page Abstract Introduction Conclusions References Tables Figures ◭ ◮ ◭ ◮ Back CloseFull Screen / Esc
Printer-friendly Version Interactive Discussion
5 Conclusions
We have developed a laboratory experimental set up to study the binary homogeneous nucleation H2SO4/H2O. This setup design is largely based on Ball et al. (1999) and Berndt et al. (2005). Specifically, our nucleation reactor has similar dimension and flow rates as in Ball et al. (1999) and both these two studies directly measure [H2SO4] with 5
CIMS at the end of the nucleation reactor. We also produce H2SO4 vapor at in-situ from the SO2+ OH → HSO3reaction similarly to Berndt et al. (2005, 2006). However,
unlike Berndt et al. (2005, 2006), OH is produced from the water UV absorption, which also allows for direct measurements of [OH] with accurate photon flux measurements and thus the initial [H2SO4]. In the present study, we provide a systematic evaluation
10
of this new nucleation experimental system from various technical aspects and discuss our primarily BHN results by comparing with other laboratory studies.
Binary homogeneous nucleation rates of H2SO4/H2O were measured using SO2+ OH → HSO3 at 288 K, 97.3 kPa, RH from 6 to 23% for the H2SO4 residual
concentrations from 108 to 1010cm−3 and tn between 5 and 59 s. Wall loss factors
15
of H2SO4are also provided as a function of nucleation time and diameter of the
nucle-ation reactor. The measured nuclenucle-ation rates ranged from 0.02 and 550 cm−3s−1and increased with increasing [H2SO4] and RH. Such trends are consistent with the
pre-dictions of nucleation theories. Under our experimental conditions, at least 108cm−3 of H2SO4 molecules were needed to produce the nucleation rate of 1 cm
−3
s−1. This
20
[H2SO4] threshold falls between 10 7
cm−3 in Berndt et al. (2005, 2006) and 109cm−3 in Ball et al. (1999), two earlier laboratory nucleation studies. The nucleation times used in our study are longer than that of Ball et al. (1999) (4 s), but shorter than that of Berndt et al. (2005, 2006) (560 and 290 s, respectively). These differences, together with different methods to produce and detect H2SO4, make a comparison of H2SO4 25
threshold for nucleation amongst different studies less straightforward, because differ-ent nucleation times and differdiffer-ent dimensions of the nucleation reactor lead to differdiffer-ent wall losses, particle sizes, and particle growth rates under similar precursor
concentra-ACPD
8, 6903–6947, 2008 Laboratory studies of H2SO4/H2O binay homogeneous nucleation L.-H. Young et al. Title Page Abstract Introduction Conclusions References Tables Figures ◭ ◮ ◭ ◮ Back CloseFull Screen / Esc
Printer-friendly Version Interactive Discussion
tions.
The power relationship between measured nucleation rate and H2SO4concentration suggests there are 3 to 8 H2SO4molecules in the critical clusters under our
experimen-tal conditions. This number also increased with decreasing RH, in an agreement with classical nucleation theories, and is in the same range as those reported from the
pre-5
vious laboratory nucleation studies (Wyslouzil et al., 1991; Ball et al., 1999; Berndt et al., 2005; Berndt et al., 2006). The estimated numbers of H2SO4molecules in the
critical clusters from these laboratory studies are, however, much larger than those (between 1 and 2) derived from field observations (Weber et al., 1996; Sihto et al., 2006; McMurry and Eisele, 2005).
10
The measured sizes of newly-formed particles were smaller than 10 nm and the derived growth rates ranged from 28 to 127 nm h−1. Both particle sizes and concentra-tions increased with increasing tn, [H2SO4], and RH. These trends are also consistent
with nucleation theories (Kulmala et al., 2004). However, these results also indicate that the particle number concentrations, which are used for nucleation rate calculation,
15
are not necessarily on the same basis, size-wise, when comparing the results from different studies and even different experiments within the same laboratory studies.
While these experimental results demonstrate a strong validation of our nucleation kinetics setup and also provide important nucleation properties which are in fact con-sistent with predictions from the nucleation theories, there are also several difficulties
20
that are inherited in the laboratory experiments of H2SO4/H2O nucleation studies. The CIMS-measured H2SO4concentrations are not the initial concentrations, but rather the
residual or equilibrium concentrations, because a large fraction of the initially formed H2SO4 molecules are lost to the flow reactor wall and by condensation growth. In ad-dition, relatively high [H2SO4] was used in order to form particles at measurable sizes 25
(>3 nm) within the short nucleation time (<60 s). High wall losses of H2SO4 are also
responsible for high [H2SO4] used in the present study due to large surface-to-volume ratio of our nucleation reactor. Under high [H2SO4] and number concentrations,
ACPD
8, 6903–6947, 2008 Laboratory studies of H2SO4/H2O binay homogeneous nucleation L.-H. Young et al. Title Page Abstract Introduction Conclusions References Tables Figures ◭ ◮ ◭ ◮ Back CloseFull Screen / Esc
Printer-friendly Version Interactive Discussion
also affect the H2SO4 dependence of nucleation rates. Nucleation time is another
im-portant technical aspect for nucleation experiments. With increasing nucleation times, the number concentrations and sizes of newly-formed particles increased, whereas the residual [H2SO4] decreased. The former implies the nucleation is still active within the nucleation time frame of the present experimental setup, and the latter shows that the
5
measured [H2SO4] could be underestimated because of the H2SO4 wall losses and
condensation growth.
Our future goal is to measure nucleation rates at atmospherically relevant conditions with [H2SO4] in the 10
6
–107cm−3range with and without ternary species and compare them with atmospherically observed nucleation rates. Thus far, our experiments shown
10
here were made at higher [H2SO4] ranging from 108–1010cm−3
. Nevertheless, our nucleation experiments provide important kinetics properties of H2SO4/H2O nucleation
required to test nucleation theories and complement previous laboratory studies. We plan to quantitatively characterize the H2SO4 wall loss by simultaneously measuring H2SO4 at the beginning and end of the nucleation reactor and provide more accurate 15
information on particle precursor concentrations for future nucleation experiments.
Acknowledgements. This study was supported by the NSF CAREER Award (ATM-0645567).
We thank G. Huey and D. Tanner for the CIMS construction and technical support, C. Cantrell and D. Tanner for providing information on designing the OH water vapor UV absorption cell, and M. Kulmala, B. Wyslouzil, F. Eisele, and K. Lehtinen for useful conversations.
20
References
Ball, S. M., Hanson, D. R., Eisele, F. L., and McMurry, P. H.: Laboratory studies of particle nucleation: Initial results for H2SO4, H2O, and NH3vapors, J. Geophys. Res., 104, 23 709– 23 718, 1999.
Baron, P. A. and Willeke, K. (eds.): Aerosol measurement: principles, techniques, and
applica-25
tions, 2nd ed., John Wiley and Sons, New York, 2001.
ACPD
8, 6903–6947, 2008 Laboratory studies of H2SO4/H2O binay homogeneous nucleation L.-H. Young et al. Title Page Abstract Introduction Conclusions References Tables Figures ◭ ◮ ◭ ◮ Back CloseFull Screen / Esc
Printer-friendly Version Interactive Discussion
rates of sulfuric acid and water binary homogeneous nucleation from the SO2+ OH reaction, Geophys. Res. Lett., in press, doi:10.1029/2008GL033387, 2008
Berndt, T., B ¨oge, O., Stratmann, F., Heintzenberg, J., and Kulmala, M., Rapid formation of sulphuric acid particles at near-atmospheric conditions, Science, 307, 698–700, 2005. Berndt, T., B ¨oge, O., and Stratmann, F.: Formation of atmospheric H2SO4/H2O
parti-5
cles in the absence of organics: a laboratory study, Geophys. Res. Lett., 33, L15817, doi:10.1029/2006GL026660, 2006.
Berndt, T., B ¨oge, O., and Stratmann, F.: Atmospheric H2SO4/H2O particle formation: Mech-anistic Investigation, Proceeding for the 17th International Conference on Nucleation and Atmospheric Aerosols., Galway, Ireland, editd by: O’Dowd, C. D. and Wagner, P., pages
10
69–72, Springer, 2007.
Boulaud, D., Madelaine, G., Vigla, D., and Bricard, J.: Experimental study on the nucleation of water vapor sulphuric acid binary system, J. Chem. Phys., 66, 4854–4860, 1977.
Cantrell, C. A., Zimmer, A., and Tyndall, G. S.: Absorption cross sections for water vapor from 183 to 193 nm, Geophys. Res. Lett., 24, 2195–2198, 1997.
15
Christensen, P. S., Wedel, S., and Livbjerg, H.: The kinetics of the photolytic production of particles from SO2and NH3in humid air, Chem. Eng. Sci., 49, 4605–4614, 1994.
DeMore, W. B., Sander, S. P., Golden, D. M., Hampson, R. F., Kurylo, M. J., Howard, C. J., Ravishankara, A. R., Kolb, C. E., and Molina, M. J.: Chemical kinetics and photochemical data for use in stratospheric modeling, Evaluation number 12, JPL Publ. 97-4, NASA Jet
20
Porpulsion Lab., Pasadena, CA, 1997.
Diamond, G. L., Iribarne, J. V., and Corr, D. J.: Ion-induced nucleation from sulphur dioxide, J. Particle Sci., 16, 43–55, 1985.
Eisele, F. L. and Tanner, D. J.: Measurement of the gas-phase concentration of H2SO4 and methane sulphonic-acid and estimates of H2SO4production and loss in the atmosphere, J.
25
Geophys. Res., 98, 9001–9010, 1993.
Hanson, D. R. and Eisele, F.: Diffusion of H2SO4in humidified nitrogen: Hydrated H2SO4, J.
Phys. Chem. A, 104, 1715–1719, 2000.
Huey, L. G.: Measurement of trace atmospheric species by chemical ionization mass spec-trometry: Speciation of reactive nitrogen and future directions, Mass Spectrom. Rev., 26,
30
166–184, 2007.
Kashchiev, D.: On the relation between nucleation work, nucleus size and nucleation rate, J. Chem. Phys., 76, 5098–5102, 1982.
ACPD
8, 6903–6947, 2008 Laboratory studies of H2SO4/H2O binay homogeneous nucleation L.-H. Young et al. Title Page Abstract Introduction Conclusions References Tables Figures ◭ ◮ ◭ ◮ Back CloseFull Screen / Esc
Printer-friendly Version Interactive Discussion
Kerminen, V.-M. and Kulmala, M.: Analytical formulae connecting the “real” and the “apparent” nucleation rate and the nuclei number concentration for atmospheric nucleation events, J. Aerosol Sci., 33, 609–622, 2002.
Kim, T. O., Adachi, M., Okuyama, K., and Seinfeld, J. H.: Experimental measurement of com-petitive ion-induced and binary homogeneous nucleation in SO2/H2O/N2 mixtures, Particle
5
Sci. Technol., 26, 527–543, 1997.
Korhonen, P., Kulmala, M., Laaksonen, A., Viisanen, Y., McGraw, R., and Seinfeld, J. H.: Ternary nucleation of H2SO4, NH3, and H2O in the atmosphere, J. Geophys. Res., 104, 26 349-26 353, 1999.
Kulmala, M., Vehkam ¨aki, H., Pet ¨aj ¨a, T., Dal Maso, M., Lauri, A., Kerminen, V.-M., Birmili, W.,
10
and McMurry, P. H.: Formation and growth rates of ultrafine atmospheric particles: a review of observations, J. Aerosol Particle Sci., 35, 143–176, 2004.
Kulmala, M., Lehtinen, K. E. J., and Laaksonen, A.: Cluster activation theory as an explana-tion of the linear dependence between formaexplana-tion rate of 3 nm particles and sulphuric acid concentration, Atmos. Chem. Phy., 6, 787–793, 2006.
15
Lee, S.-H., Reeves, J. M., Wilson, J. C., Hunton, D. E., Viggiano, A. A., Miller, T. M., Ballenthin, J. O., and Lait, L. R.: Particle formation by ion nucleation in the upper troposphere and lower stratosphere, Science, 301, 1886–1889, 2003.
Lovejoy, E. R., Curtius, J., and Froyd, K. D.: Atmospheric ion-induced nucleation of sulphuric acid and water, J. Geophys. Res., 109, D08204, doi:10.1029/2003JD004460, 2003.
20
M ¨akel ¨a, J. M., Jokinen, V., and Kulmala, M.: Small ion mobilities during particle formation from irradiated SO2in humid air, J. Particle Sci., 26, Sppl. 1, S333–S334, 1995.
McMurry, P. H. and Eisele, F. L.: Preface to topical collection on new particle formation in Atlanta, J. Geophys. Res., 110, D22S01, doi:10.1029/2005JD006644, 2005.
Mirabel, P. and Clavelin, J. L.: Experimental study of nucleation in binary mixtures: The nitric
25
acid-water and sulphuric acid-water systems, J. Chem. Phys., 68, 5020–5027, 1978. Napari, I., Noppel, M., Vehkam ¨aki, H., and Kulmala, M.: Parameterization of ternary
nucleation rates for H2SO4-NH3-H2O vapors, J. Geophys. Res., 107(D19), 4381, doi:10.1029/2002JD002132, 2002.
National Institute for Standard Technology (NIST) Chemistry Web Book, NIST Standard
Ref-30
erence Database Number 69, June 2005 Release, available at: http://webbook.nist.gov/
chemistry/, 2005.

![Fig. 2. The calculated [OH] produced from water UV absorption as a function of RH and nucleation time (t n ) (see Sect](https://thumb-eu.123doks.com/thumbv2/123doknet/14777344.594520/34.918.76.631.100.437/fig-calculated-produced-water-absorption-function-nucleation-sect.webp)
![Fig. 5. The measured particle number concentrations as a function of the residual [H 2 SO 4 ] with the 1 ppm (a) and 100 ppm (b) SO 2 source cylinder at 288 K](https://thumb-eu.123doks.com/thumbv2/123doknet/14777344.594520/37.918.186.533.49.522/measured-particle-number-concentrations-function-residual-source-cylinder.webp)
![Fig. 6. The measured particle number concentrations as a function of the residual [H 2 SO 4 ] with (a) nucleation time t n = 19 s and (b) t n = 4 s at 288 K](https://thumb-eu.123doks.com/thumbv2/123doknet/14777344.594520/38.918.184.531.50.530/fig-measured-particle-number-concentrations-function-residual-nucleation.webp)
![Fig. 7. The CIMS-measured residual [H 2 SO 4 ] at varying total flow rate Q total and nucleation time t n at RH of 23% and 288 K](https://thumb-eu.123doks.com/thumbv2/123doknet/14777344.594520/39.918.709.896.119.659/fig-cims-measured-residual-varying-total-total-nucleation.webp)