HAL Id: hal-02045782
https://hal.archives-ouvertes.fr/hal-02045782
Submitted on 7 Mar 2019HAL is a multi-disciplinary open access archive for the deposit and dissemination of sci-entific research documents, whether they are pub-lished or not. The documents may come from teaching and research institutions in France or abroad, or from public or private research centers.
L’archive ouverte pluridisciplinaire HAL, est destinée au dépôt et à la diffusion de documents scientifiques de niveau recherche, publiés ou non, émanant des établissements d’enseignement et de recherche français ou étrangers, des laboratoires publics ou privés.
Organometallic approach for platinum and palladium
doping of tin and tin oxide nanoparticles: structural
characterisation and gas sensor investigations
Laurent Erades, Céline Nayral, Aikaterini Soulantika, Bruno Chaudret, André
Maisonnat, Didier Grandjean, Philippe Menini, Frédéric Parret
To cite this version:
Laurent Erades, Céline Nayral, Aikaterini Soulantika, Bruno Chaudret, André Maisonnat, et al.. Organometallic approach for platinum and palladium doping of tin and tin oxide nanoparticles: struc-tural characterisation and gas sensor investigations. New Journal of Chemistry, Royal Society of Chemistry, 2006, 30 (7), pp.1026-1035. �10.1039/B600197A�. �hal-02045782�
Organometallic Approach for Platinum and Palladium doping of
Tin and Tin Oxide Nanoparticles: Structural Characterisation
and Gas Sensor Investigations
Laurent Erades1; Céline Nayral1; Katerina Soulantica1; Bruno Chaudret1 ; André Maisonnat1
Didier Grandjean2,3;
Philippe Menini4 and Frederic Parret4
1Laboratoire de Chimie de Coordination du CNRS, UPR 8241
205 route de Narbonne, 31077 Toulouse Cedex 04, France
2Department of Inorganic Chemistry and Catalysis, Utrecht University – Sorbonnelaan 16,
3584 CA Utrecht – Netherland
3Centre for Materials Research, School of Physical Sciences, University of Kent, Canterbury
CT2 7NR, UK
4Laboratoire d’Analyse et d’Architecture des Systèmes du CNRS, UPR 8001
7, avenue du Colonel Roche, 31077 Toulouse Cedex 04, France
**The authors thank CNRS and European Commission for funding this work within the NANOSENSOFLEX project (GROWTH-G5RD-CT-2002-00722). We express our gratitude to MM. Vincent Collière, Lucien Datas, and UPS-TEMSCAN facility for TEM measurements, M. Gérard Chatainier, and INPT-ENSIASET for ESCA measurements, Dr François Senocq for XRD measurements, M. Ad van der Eerden (Utrecht University) and Dr Julia Wienbold (X1, Hasylab) for their assistance and advise during EXAFS measurement experiments. We also wish to acknowledge the use of the EPSRC’s Chemical Database Service at Daresbury.
Abstract
Decomposition of the organometallic precursors [Pt2(dba)3] or [Pd(dba)2] in a colloidal
suspension containing tin/tin oxide nanocomposite core shell particles in anisole under 3 bars of dihydrogen at room temperature leads to surface doped tin particles which can be isolated as pure solids and for which elemental analyses show doping yields of 62% for Pt and 77% for Pd and effective doping ratios [Pt]/[Sn] and [Pd]/[Sn] of 2.5 and 3.1 % respectively. These particles were characterized by means of transmission electron and high-resolution transmission electron microscopies (TEM and HRTEM), Energy Dispersive X-Ray spectroscopy (EDX), photoelectron spectroscopy (XPS) and X-ray absorption spectroscopy (EXAFS and XANES). The TEM micrographs show spherical nanoparticles, the size and size distribution of which are essentially similar to those of the initial Sn/SnOx material. HRTEM,
EDX, XPS and X-ray absorption studies at the Pd and/or Sn-K edge indicate conservation of the composite nature of the particles that consist of a tin (0) core covered with a layer of tin oxides on which the doping element is deposited under the form of crystalline metallic platelets of size near 2 nm. The thermal oxidation of these Pt- or Pd-doped tin materials yields nanoparticles of crystallized SnO2 covered with crystallites of Pt or Pd oxides, as
demonstrated by XRD, XPS and X-ray absorption experiments, without coalescence or size change. The thermal oxidation process can be easily achieved onto the silicon platform of a micro machined device after integration of the Pt- or Pd-doped Sn/SnOx colloidal suspension by drop deposition. The first electrical measurements indicate remarkable behaviours of the as-obtained micro sensors when exposed to traces of carbon monoxide: a surprising inversion of sensitivity from undoped and Pt- and Pd-doped sensors in dry atmosphere and an important increase of sensitivity relatively to undoped sensitive layer in humid atmosphere.
1. Introduction
Metal oxides are widely employed as sensitive element in gas sensors [1-4] and commercial devices produced by a typical ceramic manufacturing process have been available for a long time.[5] Such devices are able of detecting low concentration of flammable or toxic gases at a
ppm level but their lack of selectivity and long term stability remains their weak points, and improve the cross sensitivities between gases like CO, H2, hydrocarbons and NO2 remains a
major problem.
Even though modulations of the sensor response to a given gas in a mixture can be achieved through optimization of the working temperature of the sensitive layer,[6] of the operating
mode and the signal processing[7-9] an accurate control of morphology of the sensing materials, in the nanometre range, is well known as an inescapable prerequisite for improvement of sensor performances. [7, 10-13] If the addition of small amounts of a noble metal has been shown to improve the detection of various kind of gases,[10, 14-21] sensitivity and selectivity again depend on morphology of the as-obtained doped material, in term of distribution and crystal size of the added noble metals.[22-25]
In previous studies, we have evidenced the interest of organometallic complexes for the preparation of metal nanoparticles of controlled size and shape and organization.[26-33] We have shown that this methodology can be extended to the synthesis of nanoparticles of metal oxides with a precise control of morphology. Thermolysis of [ZnCy2], (Cy = C6H11), or
[{Sn(NMe2)2}2] in anisole or methanolysis of InCp, (Cp = η5-C5H5), in toluene indeed lead to
the formation of zinc, tin or indium nanoparticles of low size dispersity[34-37] which can be oxidized, in a second step, into well crystallized nanoparticles of the corresponding oxides, without coalescence. We recently reported a direct organometallic route to ZnO colloidal solution containing nanoparticles of controlled size and shape.[38]
We have also shown that dibenzylideneacetone derivatives of palladium and platinum can be used as precursors to yield metal nanoparticles of uniform sizes in the range 1.2 – 2.5 nm by submitting solutions of these compounds to CO or H2 and in the presence of a stabilizing
agent as polymer or organic ligands.[39-41] We demonstrate in this paper that these Pd and Pt
organometallic complexes can effectively be used as precursors for a surface doping of tin nanoparticles through very mild conditions and with an accurate control of morphology. The reaction with CO of [Pt2(dba)3] or [Pd(dba)3] in anisole containing tin nanoparticles indeed
leads to the formation of tin/platinum or tin/palladium nano composites. The characterization of these nano composites by elemental analysis, TEM, HRTEM, EDX, EXAFS and XPS is described. Their oxidation by thermal treatment under air, leading to nano composites characterized as tin dioxide nanoparticles covered with platinum or palladium oxide, is also described as well as their implementation as sensitive layer on the silicon platform of a gas micro sensor and their electrical properties under carbon monoxide.
2. Experimental section
Materials and reagents
All compounds used in this work were sensitive to oxygen and moisture and were manipulated in a standard vacuum line or in argon atmosphere by using a MBraun Inert Gas System. Preparation of the platinum and palladium precursors, ([Pt2(dba)3] and [Pd(dba)2]
respectively) follows the routes described earlier[42]. Anisole was purchased from Aldrich and
its water content was checked by Karl-Fisher coulometric titration by using Metrohm equipment.
Preparation of the tin colloid follows the route described previously.[35, 43] The precursor
[Sn(NMe2)2]2 (174 mg, 0.42 mmol; 0.84 10-3 eq. Sn), in anisole (degassed under vacuum, at
liquid nitrogen temperature; 15 mL) containing traces of water (0.4 mg/mL of anisole; 0.33 mmol: [H2O]/[Sn] = 0.4) were heated at 135 °C under magnetic stirring in a Fischer-Porter bottle. The initial yellow solution darkened without 10 mn and a black solid progressively precipitated. After 3hours, the solution was removed by filtration, and the black precipitate was washed with anisole (3x40 mL). The black solid was then re-dispersed in 15 mL of degassed anisole and the Fischer-Porter bottle was then pressurized to 3 bars of dihydrogen. After stirring for 3 hours, the resulting suspension was sampled for TEM analysis: nanoparticles, size 7-2O nm (Gaussian fit, mean size: 13.2 (2.2) nm).
Decomposition of [Pt2(dba)3] in [Sn/SnOx] colloidal suspension
To 7.5 mL of the suspension of [Sn/SnOx] in anisole (0.21 10-3 eq Sn) was added the platinum
precursor (1 mL of a solution containing 46 mg of [Pt2(dba)3] in 10 mL of anisole; 0.0042
mmol; [Pt]/[Sn] = 4%). The mixture was exposed to 1 bar of CO in a Fisher-Porter bottle. After 20 mn of stirring, the Fisher-Porter bottle was evacuated and the resulting black suspension was sampled for TEM, HRTEM, EDX and XPS experiments. The supernatant solution was then removed by filtration from the remaining suspension and the precipitate was washed with anisole (3x15 mL) and dried under vacuum. Elemental analysis (%): Sn 79.23; Pt 3.23; [Pt]/[Sn] = 2.5%; doping yield: 62.5%; TEM analysis: nanoparticles, size 7-19 nm (Gaussian fit, mean size: 13.4 (1.7) nm).
Decomposition of [Pd(dba)2] in [Sn/SnOx] colloidal suspension
Similarly, to a colloidal suspension of [Sn/SnOx] in anisole (0.42 10-3 eq Sn; 15 mL) was
added the palladium precursor (4.8 mL of a solution containing 20.0 mg of [Pd(dba)2] in 10
mL of anisole; 0.0167 mmol; [Pd]/[Sn] = 4%). After exposition to 1 bar of CO during 20 mn, depressurization, sampling for TEM, HRTEM, EDX, EXAFS and XPS experiments,
decantation filtration and drying under vacuum, a black powder was obtained. Elemental analysis (%): Sn 73.72; Pd 2.06; [Pd]/[Sn] = 3.09%; doping yield: 77%; TEM analysis: nanoparticles, size 7-19 nm (Gaussian fit, mean size: 13.2 (1.7) nm).
Thermal oxidation of tin/platinum and tin/palladium products
The black solids resulting from decomposition of [Pt2(dba)3] and [Pd(dba)2] in [Sn/SnOx]
colloidal suspensions were heat-treated in air in an oven for a period of 135 min at temperatures ranging from 50 to 525°C according to the optimized multi step process already used for the oxidation of [Sn/SnOx] nanoparticles[35]
Electron microscopy experiments
Samples for TEM and HRTEM studies were prepared in a glove-box by slow evaporation of a drop of suitably diluted colloidal suspensions deposited on holey carbon-covered grids. The TEM experiments were performed at the "Service Commun de Microscopies de l'Université Paul Sabatier" on a JEOL JEM 200CXT-T electron microscope working at 200 kV and a Philips CM12 electron microscope working at 120 kV while the high resolution images were obtained with a JEOL JEM 2010 electron microscope working at 200 kV. The size distribution of the particles was determined from enlarged photographs by measuring a minimum of 200 particles for each example.
X-ray photoelectron spectroscopy experiments
Samples for XPS studies were prepared in a glove-box by slow evaporation of a nanoparticle suspension deposited on a 1 cm2 silicon support. The spectra were recorded on a VG ESCALAB MKII spectrometer with Mg-Kα radiation.
X-ray absorption spectroscopy experiments
X-ray absorption data were collected on beamline X1 (Hasylab, DESY, Hamburg, Germany), operating under beam conditions of 4.4 GeV, 150 mA using a Si (311) double-crystal monochromator. The monochromator was detuned on its rocking curve to approximately 60%
of the maximum transmitted X-ray intensity to reduce the harmonic content of the beam at a minimum level. Ionisation chambers were filled with standard N2/Ar mixtures. Appropriate
amounts of sample were finely ground with boron nitride and pressed into a self-supporting wafer producing a suitable edge jump. The spectra were recorded at 80 K by cooling the samples with liquid-nitrogen. XAS signals were measured in transmission mode at the Pd K edge (24350.3 eV) with 4 datasets summed to improve signal/noise ratio. PdO powder (Aldrich 99.999%) was used as reference sample.
Data reduction of experimental X-ray absorption spectra was performed using the program EXBROOK.[44] Pre-edge background subtraction and normalisation was carried out by fitting
a linear polynomial to the pre-edge region and cubic splines to the post-edge region of the absorption spectrum. A smooth atomic background was then obtained. EXAFS refinements were performed with the EXCURV98 package.[44] Phase shifts and backscattering factors were calculated ab initio using Hedin-Lundqvist potentials. Refinements were carried out using k3 weighting in the range 2.5-15 Å-1 for the reference compounds and k2 in the range 3.0
to 12.6 Å-1 for the Pd doped SnO2 nanomaterial. In order to improve the quality of the signal
for a better quantitative analysis and to reduce the number of fitting parameters, the data for all the samples (except for bulk Pd) were refined using Fourier filtering techniques. Fourier transform (FT’s) peaks were isolated with a Gaussian window (1.0- 4.9 Å) and the contribution of this group of shells was extracted by inverse transformation.
Implementation of colloidal suspensions of platinum and palladium doped tin/tin oxide nanoparticles on silicon platform and conductivity measurements under carbon monoxide.
A drop of the doped colloidal tin/tin oxide suspension in anisole is deposited on the heating element and electrical contacts of a silicon platform of a chemical sensor device integrating all structures that are needed to receive and make operational a sensing layer (heater, metal interconnects, membrane, insulating layer…) according to a procedure previously
described.[45, 46] The integrated micro heater is used to in situ oxidize the doped tin/tin oxide
colloid layer at a temperature close to 500°C according to the multi step process previously described[35, 45] to form fully oxidized platinum and palladium doped tin dioxide structures. The sensor heating was controlled by a constant-voltage power supply. The conductivity measurements on the sensitive layers were carried out under controlled atmosphere in a flow chamber at a flow rate of 1 lmn-1, temperature 21°C and variable relative humidity on a test
bench by using interface hardware. Humidity concentration was controlled by mixing appropriate fractions of dry and saturated synthetic air. The data acquisition was controlled through Labwindows software (National Instruments).
3. Results and discussion
3.1 Synthesis and characterization of [Sn/SnOx/Pt] nano composite:
We recently demonstrated that the reaction of [Pt2(dba)3] with carbon monoxide in THF leads
to the formation of well crystallized platinum nanoparticles of uniform size centred near 1.2 nm[41] which can be easily functionalized through coordination of various ligands at their
surface. This organometallic complex then appears as a convenient potential precursor for the doping of tin nanoparticles, and we observed that [Pt2(dba)3] indeed also decomposed in the
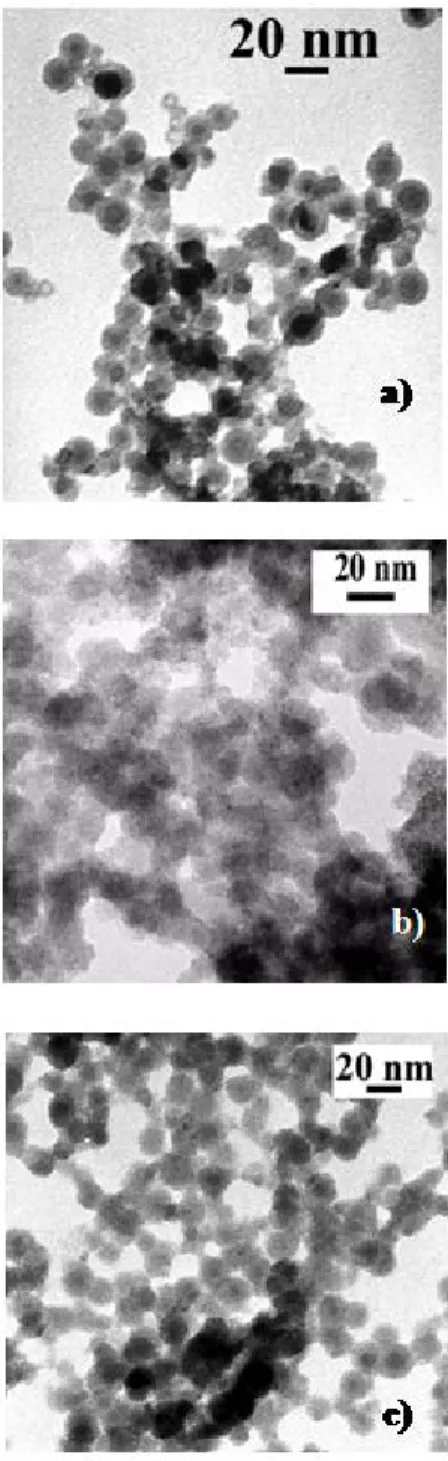
presence of colloidal tin/tin oxide nano composite suspended in anisole, when exposed to 1 bar of carbon monoxide. Elemental analysis of the black product isolated after the reaction indicates that 62.5% of the platinum initially introduced in the medium has been incorporated to the tin/tin oxide colloid. Transmission Electron Microscopy (TEM) observation and Energy Dispersive X-Ray spectroscopy (EDX) of this black product revealed spherical nanoparticles of uniform size centred near 13.4 nm, as the starting [Sn/SnOx] colloid (13.2 (2.2) nm) (Figure
1a and b), and homogeneous distribution of both Sn and Pt in the sample, the [Pt]/[Sn] atom ratio determined by this method, ie 2.3%, being in good agreement with the composition obtained from elemental analysis within the limits of instrument sensitivity.
Figure 1. TEM image of tin/tin oxide nanoparticles a) before doping, b) after platinum and c) palladium dopings
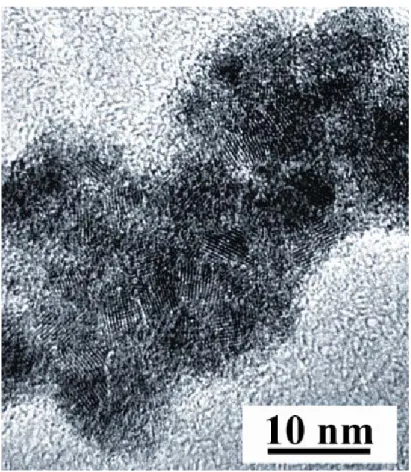
HRTEM image shows small crystallites of diameters in the range 2-3 nm at the surface of the particles (Figure 2). If the core-shell morphology observed for the starting tin colloidal material[34, 35] is not apparent on this image, surface analysis by X-ray photo-emission spectroscopy (XPS) however indicates a composition basically similar consisting of a core of
tin(0) surrounded with a tin oxide layer on which the added platinum is deposited. The Sn
3d
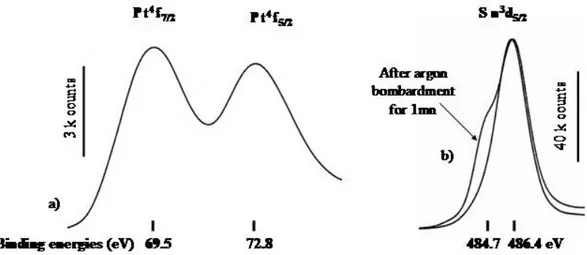
5/2 peak indeed splits into two components with binding energies of 484.7 and 486.4 eV
indicative of both tin oxides and tin(0) (Figure 3). A Pt 4f7/2 peak appears at 69.5 eV and
corresponds clearly to zero-valent platinum.[47] Tin (0) component at 484.7 eV moreover
considerably increased relatively to tin oxide component at 486.4 eV after argon bombardment of the sample for 1 mn whereas the atom ratio [Pt]/[Sn] decrease from 2.3% to 1.4%.
Figure 3. Pt4f, (a) and Sn3d5/2 (b) emission peaks of the XPS spectrum of platinum doped tin/tin oxide nanoparticles (arbitrary y scales)
3.2. Synthesis and characterization of [Sn/SnOx/Pd] nano composite:
Similarly, the decomposition under CO atmosphere of Pd(dba)2 in the presence of colloidal
[Sn/SnOx] suspended in anisole yields [Sn/SnOx/Pd] nano composite as a black solid. The
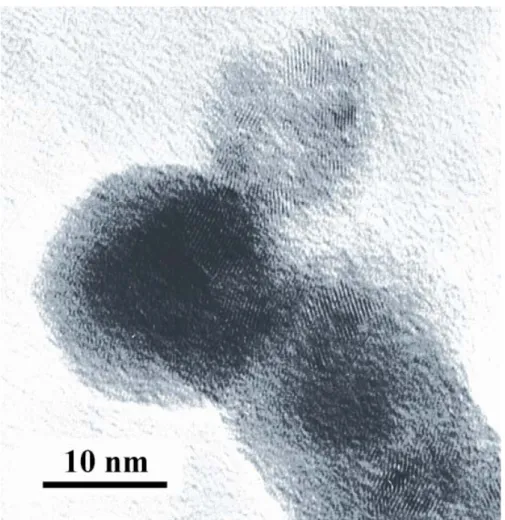
elemental analysis of this solid indicates that 77% of the palladium initially introduced in the starting suspension has been incorporated to the tin/tin oxide colloid. TEM observation indicates again similar spherical morphology with similar mean diameter as in the starting tin/tin oxide material (figure 1c) and HRTEM images (Figure 4) shows small crystallites at the surface of the particles. XPS surface analysis (Figure 5) again is consistent with conservation of a core-shell structure consisting in a core of tin(0) surrounded with a tin oxide layer on which the added palladium is deposited, the atom ratio [Pd]/[Sn] decreasing from 1.9% to 1.4% after argon bombardment of the sample for 1 mn.
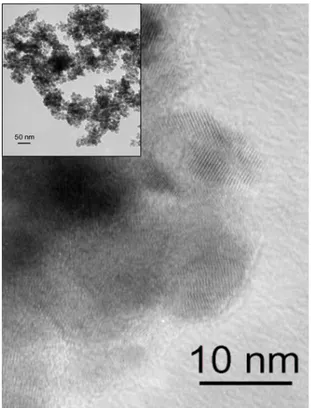
Figure 4. HRTEM image of palladium doped tin/tin oxide nanoparticles
Figure 5. Pd3d
5/2 (a) and Sn3d5/2 (b) emission peaks of the XPS spectrum of palladium
If the palladium oxidation state can not be deduced from XPS experiment, the Pd 3d
5/2 peak at
335.8 eV being close to those reported for Pd as for PdO, [48] XANES and EXAFS analyses shows that the palladium is zerovalent and has a structure close to the metal but with very small particle size and/or amorphous character[49]….. Didier, à completer et illustrer
Pd was found to be surrounded by 2.6 Sn at short distance of ca 2.58 Å, and by a second coordination shell of ca 2.3 Pd atoms located at 2.77 Å. This result identifies two metallic phases in the as-prepared sample, ie a mixed Sn/Pd phase in the metallic core of the nanocomposite accounting for 80% of the Pd atoms and a pure Pd metal one. This demonstrates the absence of the homogeneous mixing of the Pd atoms in the Sn matrix already observed in the case of volume Pd-doped tin/tin oxide nanocomposites,[49] and is on the contrary consistent with their localization as small crystalline platelets embedded in the amorphous tin oxide outer layer of the tin/tin oxide nanoparticles as suggested by XPS and as observed with HRTEM.
3.4 Oxidation of [Sn/SnOx/Pt] and [Sn/SnOx/Pd] nanocomposites
The [Sn/SnOx/Pt] and [Sn/SnOx/Pd] nanocomposites can be fully oxidized in air in an oven, at
temperatures ranging from 50 to 525°C according to the optimized multi step process already used for the oxidation of [Sn/SnOx] nanoparticles,[35] to yield black solids. This black solid is
essentially constituted of crystallized tin dioxide as shown by their XRD patterns (which exhibit the classical quadratic phase of SnO2 and, to a lesser extent, the high pressure
orthorhombic phase of SnO2). The apparent black colour of this solid is then consistent with
the presence of palladium or platinum oxide at the surface of the material. The micrograph of platinum doped material (Figure 6) shows individual agglomerated particles and displays the same type of morphology as the non-oxidized particles. Their mean-size, around 13 nm, and the size distribution are unchanged and we did not observe any sign of coalescence. The HRTEM micrograph shows well crystallized domains at the surface of the particles.
Figure 6. TEM (insert) and HRTEM images of platinum doped tin/tin oxide particles after oxidation
For confirmation of these results, XPS study of the surface of the oxidized platinum doped tin particles (Figure 7) and EXAFS study of the oxidized palladium doped tin particles were performed. XPS spectra of the oxidized Pt-doped tin particles provides evidence of the presence of oxidized tin insofar as they feature one single symmetrical peak at 486.4eV for the Sn3d
5/2 electrons, and no Sn0 was observed even after argon bombardment. The position of
the Pt4f7/2 emission peak, ie 75.0 eV, is indicative of the presence of an oxidized PtO2 phase at
the surface of the particles.[48] Side peaks at lower binding energies between 71.5 and 74.0 eV are observed and can be assigned to Pt(OH)2, PtO and/or Pt-O-Sn phases by reference to
reported for Pt-O-Sn surface species[51] which are supposed to model the platinum
chemisorption on tin dioxide. Our observations suggest a core shell structure for the nano composite SnO2/PtO2 in which platinum dioxide lies at the surface of tin dioxide particles
through an interface constituted of SnO2-bonded Pt species and rule out the presence of
metallic platinum at the surface of tin oxide grains, in agreement with previous observations[52]
Figure 7. Pt4f (a) and Sn3d
5/2 (b) emission peaks of the XPS spectrum of platinum doped
tin/tin oxide nanoparticles after oxidation (arbitrary y scales)
3.5 EXAFS studies of the fully oxidized Pd-doped Sn/SnOx nano particles
EXAFS studies of the oxidized Pd-doped tin particles suggest that the transformation occurring during the oxidation process of the Pd doped tin nanomaterial consists in the oxidation of the Pd metallic platelets into a pure Pd3O4 phase whilst the mixed metallic phase
present in the core of the particle is transformed into two phases: a mixed Pd/Sn oxide having a PdO type structure and a SnO2 phase in which some Sn are substituted by Pd atoms.
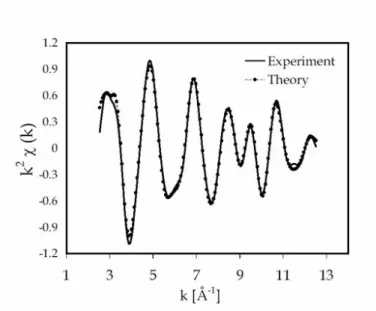
Results of the EXAFS structural refinements are summarised in Table 1. The EXAFS and Fourier transform best fit are respectively presented in Figure 8 and Figure 9
Figure 8. Sn K-edge EXAFS spectra (after background substraction, k2-weighed) of the fully oxidized Pd surface-doped Sn/SnOx nano material. The solid lines are the experimental data and the dotted line is the best fit.
Figure 9. Fourier transform of the Pd K-edge k2-weighted of the fully oxidized Pd surface-doped Sn/SnO x nano material. The solid lines are the experimental data, the dotted line is the best fit.
The phase corrected FT’s corresponding to the EXAFS measurements at the Pd K-edge of the as prepared and oxidised sample along with reference samples are presented in Figure 10. The FT of the oxidised surface-doped sample shows three relatively sharp peaks of decreasing intensities respectively located before phase correction at around 1.6, 2.5 and 3.4 Å. The main peak located at ~ 1.6 Å features a shoulder on its right hand side indicating the presence of two shells with close distances.
Figure 10. Fourier transforms of the Pd K-edge k3-weighted or k2-weighted EXAFS of a) fully oxidized Pd surface-doped Sn/SnOx nano material and reference samples, b) bulk Pd, c) bulk PdO.
The low intensity of the second and third peaks already shows that the local environment around Pd atoms is relatively disordered and that the Pd phase is part of a rather amorphous phase and/or that this phase is composed of very small particles.
The results of the EXAFS refinement presented in Table 1 show that the first peak could be fitted with two oxygen shells of respectively 3.5 atoms located at 1.997 Å and 1.7 oxygen atoms located at 2.486 Å. The second peak could be fitted with 2.2 tin atoms located at 2.648
Å. The higher R part of the FT corresponds to a Pd shell of 3.1 atoms located at 3.24 Å and two additional shells of around 0.7 Pd at 3.037 and 0.6 Sn at 3.653 Å.
The first oxygen bond distance is slightly smaller than the corresponding first Pd-O bond distance both in the PdO (2.018 Å) and the Pd3O4 (2.035 Å) phases whilst the second oxygen
shell corresponds almost exactly to the O bond distance of the Pd3O4 phase (2.492 Å). The
oxygen shells already suggest that we are in presence of two different Pd oxide phases. The relatively high Debye-Waller factor associated with this second shell O shell indicates an important level of disorder in this phase.
The general fit was greatly improved by fitting the second shell with Sn atoms instead of the Pd that would be normally expected as second neighbours in a Pd oxide phase. The distance of this Sn shell is very close to the typical Pd-Pd bond of the PdO phase (2.665 Å) but with a slightly smaller value (2.648 Å). This could correspond to a Sn atom substituting a Pd atom in a PdO type phase. This shorter bond distance is not surprising if one considers the smaller size of the Sn4+ ion (55pm 4fold coordinated) compared to the Pd2+ ion (64 pm 4 fourfold coordinated). Unusually short Pd-Sn bond distances belonging to a metallic phase were also observed in the as-prepared material before its full oxidation. The next shell of the FT was fitted with 0.6 Pd atoms located at a distance of 3.037 Å that is very close to the third Pd-Pd bond distance (3.030 Å) observed in the PdO phase. The formation of a relatively disordered and/or nanocrystalline mixed Pd/Sn oxide phase with a structure close to the PdO structure seems to be the best explanation to account for these results.
Table 1. Summary of structural results of Pd K-edge EXAFS refinements of the oxidised Pd
doped Sn/SnOx nano-materials along with bulk Pd and bulk PdO.
Bulk Pd PdO Pd surface-doped Sn/SnOx Ef -0.4(2) 4.7 (7) 1.4 (6) AFAC 0.80 0.80 0.80 k 3 3 2 k-range 3-16 3-15 2.6-12.6 N1 12* Pd 4* O 3.5 (2) O R1 2.737 (1) 2.005 (1) 1.997 (3) A1 0.0100 (1) 0.003 (1) 0.004 (1) N2 6* Pd 4* Pd 1.7 (3) O R2 3.87 (1) 3.030 (2) 2.486 (9) A2 0.018 (4) 0.004 (1) 0.01 (1) N3 24* Pd 8* Pd 2.2 (3) Sn R3 4.741 (6) 3.416 (4) 2.648 (8) A3 0.016 (2) 0.005 (1) 0.016 (5) N4 12* Pd - 0.7 (2) Pd R4 5.47 (2) - 3.037(20) A4 0.023 (3) - 0.002(8) N5 24 Pd - 2.4 (4) Pd R5 6.13 (3) - 3.24 (2) A5 0.028 (1) - 0.021 (9) N6 - - 0.6 (2) Sn R6 - - 3.653 (20) A6 - - 0.0001 (10) R (%) 15.3 17.7 10.1
Ef = contribution of the wave vector of the zero photoelectron relative to the origin of k [eV]
AFAC = amplitude reduction due to many-electron processes Ni = number of atom in the ith shell
Ri = radial distance of atoms in the ith shell [Å]
Ai = Debye-Waller term of the ith shell (A=2σ2 with σ = Debye-Waller factor)[Å2]
R factor in %
* these parameters were kept fixed during the refinement. Bulk Pd: fcc a=3.8898 Å 12Pd at 2.751 Å, 6Pd at 3.890 Å [44]
Bulk PdO: P42/mmc a=b=3.03 Å, c=5.33 Å 4O at 2.018 Å, 2Pd at 2.665 Å, 4Pd at 3.030 Å
Bulk Pd3O4: Pm3-n a= 5.756 Å 2O at 2.035 Å, 4O at 2.492 Å, 1Pd at 2.878 Å 8Pd at 3.218 Å, 4Pd at
3.525 Å
Bulk SnO2: P42/mnm Cassiterite; a=b=4.737 Å c= 3.185 Å; 4O at 2.051 Å, 2O at 2.057 Å, 4O at
3.590 Å.
Bulk SnO: P4/nmm Romarchite a=b=3.796 Å c= 4.816 Å; 4O at 2.211 Å, 4Sn at 3.515 Å, 4Sn at 3.700 Å.
2.49 Å confirms that a Pd3O4 type phase is present in these samples. Contrarily to the other
oxide phase this Pd3O4 seems to a pure Pd phase without any trace Sn atom in its structure.
The last shell that could be included in the fitting model is a Sn shell at 3.653 Å that does not correspond to any atomic shell in any of the existing Pd oxide phases. This distance could correspond to a Sn-Sn distance found in the SnO2 phase (3.590 Å) meaning that a small part
of the Pd atoms may be incorporated in the major SnO2 phase that composed these
nanocomposites.
Because the oxygen shell located at 2.489 Å only belongs to the Pd3O4 phase, a rough
evaluation of the relative ratio of the Pd atoms in this phase can be simply done by using the corresponding coordination number. The number of the oxygen located at this distance in the Pd doped nanomaterial is 1.7 compared to 4 atoms in the Pd3O4 phase which gives a ratio of
ca. 1.7/4 x 100 = 42% of Pd atoms in the Pd3O4 phase in the nanomaterial.
A previous XAFS study [49] could identify two metallic phases in the as-prepared sample: a mixed Sn/Pd phase in the metallic core of the nanocomposite accounting for ~80% of the Pd atoms and a pure Pd metal one forming the small crystalline platelets of Pd metal embedded in the amorphous tin oxide outer layer of the particle that could be observed with TEM. A possible interpretation of the changes occurring during the full oxidation of this nanomaterial is a transformation of the pure Pd metallic platelets into a pure Pd3O4 phase whilst the mixed
metallic phase present in the core of the particle is transformed into two phases: a mixed Pd/Sn oxide having a PdO type structure and a SnO2 phase in which some Sn are substituted
by Pd atoms. The discrepancy between the relative amounts of the Pd3O4 phases (ca. 40%) in
the oxidised sample compared to ca. 20% of Pd metal in the as-prepared material may be explained by a higher amount of Pd metal in the as-prepared sample. Indeed, the evaluation was made using as a reference, a Pd coordination number of 12 corresponding to the bulk Pd
metal; this figure could be too large for a highly dispersed nanomaterial. An additional phenomenon of atom migration at the interface core/outer layer/ Pd platelets may also be involved in the oxidation process explaining this discrepancy.
3.5. Resistance measurements and gas sensing properties
Gas sensitivity measurements were performed in order to compare systematically the influence of doping and of the humidity content on the sensor responses to carbon monoxide. Resistance measurements were performed after deposition of a drop of the tin nanoparticles suspensions, doped or not, in anisole between the electrodes of a gas sensing device integrated onto a silicon platform, evaporation of the solvent, and in-situ oxidation of the nanoparticles according to a multi step process similar to that used for the oxidation in the oven.
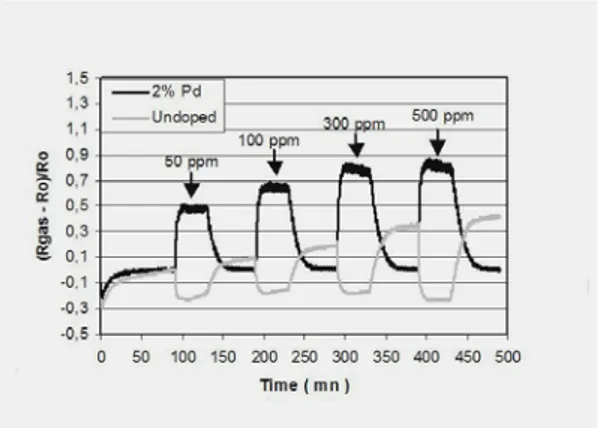
Figure 11 shows the resistance variations of undoped and palladium-doped tin dioxide sensitive layers working near 450°C when exposed to increasing amounts of carbon monoxide, eg from 50 to 500 ppm, in dry air. Surprisingly, the responses of these two types of sensors to carbon monoxide are characterized by opposite variations of the resistances, ie, a decrease of resistance for the undoped sensitive layer, which is the normal behaviour commonly observed toward reducing gas, and a sharp increase of resistance for the palladium-doped sensitive layers. Quite similar behaviours have also been observed for platinum-doped sensitive layers.
The response to CO of palladium-doped sensitive layers is in fact dramatically dependant of humidity and Figure 12 shows that the introduction of a small amount of humidity is accompanied by opposite variations of resistances under CO, whereas Figure 13 shows that the humidity dependence of the sensitivity S = [(Rgas – Rair)/Rgas] x 100 toward CO is quite
different according as the sensitive layer is doped or not. For Pd-doped sensitive layers, a zero-sensitivity to 50 ppm of CO is observed for humidity content close to 5%. Then the sensitivity increases until values in the range [-50, -60%] when RH increases from 20 to 55%. Under similar conditions and within the same limits of humidity content, undopped tin oxide layers exhibit smaller sensitivity values stabilized around -10%.
Figure 12. Pd-doped sensitive layers responses to CO in dry and humid atmospheres
The accepted mechanism of detection of reducing gases such as CO involves the partial reduction of the surface of the sensitive layer. The result of this reduction is an increase of the conductivity of the sensitive layer. The inversion of sensitivity toward CO from undoped and Pd- and Pt-doped sensors is therefore surprising and presently under investigation.
4. Conclusions
The aim of this study was to demonstrate that the organometallic route is a powerful tool for an accurate doping of tin dioxide nanoparticles and can be easily implemented in micro sensors technology. For this purpose, we have achieved a high yield doping process consisting first in the doping of the nano composite [Sn/SnOx] through the decomposition of Pd or Pt
organometallic precursors, followed by the thermal oxidation under air of the as-obtained Pd- or Pt-doped material.
The first interesting aspect of this approach is that neither the doping process nor the subsequent thermal treatments affect the morphology of the starting tin/tin oxide materials, all nanoparticles isolated at each step of the process having mean sizes close to 13 nm with narrow size distributions, as observed for the starting material. The doping element is homogeneously localized at the surface of the Sn/SnOx particles under the form of crystalline
metallic platelets having sizes close to 2 nm, whereas the full oxidation of this material yields composite nanoparticles consisting of a core of crystalline tin dioxide surrounded by crystalline platelets of Pt or Pd oxides.
The second interesting aspect is that, as the undoped Sn/SnOx nanoparticles, Pd- or Pd-doped
Sn/SnOx can be easily deposited onto silicon platforms and implemented as sensitive layer of
a micro machined silicon gas sensor. Finally, the as-obtained gas sensors show remarkable behaviours when exposed to carbon monoxide: i) a surprising inversion of sensitivity toward carbon monoxide from undoped and Pd- or Pt-doped sensors, in dry atmosphere (RH<5%),
and ii) an important increase of sensitivity to CO relatively to undoped sensitive layer under humidity level in the range 15-55 %. Current and future studies are oriented toward the understanding of this unprecedented behaviour which is believed to be basically related to the detection phenomena at the surface of the material. This includes behavioural studies of the doped sensitive layers toward other reducing gases like H2 or hydrocarbons and toward
oxidizing gases like NO2 and O3.
______________________________
[1] K. Murakami, S. Yasunaga, S. Sunahara, K. Ihokura, Anal. Chem. Symp. Ser. 1983,
17, 18.
[2] D. E. Williams, in Solid State Gas Sensor (Eds.: P. T. Moseley, B. C. Tofield), Adam Hilger, Bristol, 1987, p. 71.
[3] V. Lantto, in Gas sensors, Principle, Operation and developments (Ed.: G. Sberveglieri), Kluwer Academic, Dordrecht, Boston, London, 1992, p. 117.
[4] K. Ihokura, J. Watson, The Stannic Oxide Gas Sensor: Principles and Applications, CRC Press, Boca Raton, 1994.
[5] Technical information for carbon monoxide sensors, Figaro Engineering Inc. website. [6] A. Heilig, N. Barsan, U. Weimar, M. Schweizer-Berberich, J. W. Gardner, W. Göpel,
Sens. Actuators B 1997, 43, 45.
[7] I. Simon, N. Bârsan, M. Bauer, U. Weimar, Sens. Actuators B 2001, 73, 1. [8] U. Weimar, W. Göpel, Sens. Actuators B 1995, 26-27, 13.
[9] M. Schweizer-Berberich, M. Zdralek, U. Weimar, W. Göpel, T. Viard, D. Martinez, A. Seube, A. Peyre-Lavigne, Sens. Actuators B 2000, 65, 91.
[10] N. Yamazoe, Sens. Actuators B 1991, B5, 7.
[11] W. Göpel, in Gas sensors: principles, operation and development (Ed.: G. Sberveglieri), Kluwer Academic, Dordrecht, Boston, London, 1992, p. 365.
[12] W. Göpel, K. D. Schierbaum, Sens. Actuators B 1995, 26-27, 1. [13] G. Sberveglieri, Sens. Actuators B 1995, B23, 103.
[14] N. Yamazoe, Y. Kurokawa, T. Seiyama, Sens. Actuators B 1983, 4, 283.
[15] J. O. W. Norris, in Solid State Gas Sensor (Eds.: P. T. Moseley, B. C. Tofield), Adam Hilger, Bristol, 1987, p. 124.
[16] V. Demarne, R. Sanjines, in Gas sensors, Principles, operation and developments (Ed.: G. Sberveglieri), Kluwer Academic, Dordrecht, Boston, London, 1992, p. 89. [17] M. Schweizer-Berberich, J. G. Zheng, U. Weimar, W. Göpel, N. Barsan, E. Pentia, A.
Tomescu, Sens. Actuators B 1996, B31, 71.
[18] M. Sauvan, C. Pijolat, Sens. Actuators B 1999, 58, 295. [19] Y. Shimizu, M. Egashira, MRS Bull. 1999, 24, 18.
[20] M. Ivanovskaya, A. G. P. Bogdanov, Sens. Actuators B 2001, 77, 264.
[21] A. Cirera, A. Cabot, A. Cornet, J. R. Morante, Sens. Actuators B 2001, 78, 151.
[22] S. Matsushima, Y. Teraoka, N. Miura, N. Yamazoe, Japanese J. Applied Phys. 1988,
27, 1798.
[23] S. Matsushima, J. Tamaki, N. Miura, N. Yamazoe, Chem. Letters 1989, 1651.
[24] M. Labeau, B. Gautheron, F. Cellier, M. Vallet-Regi, E. Garcia, J. M. Gonzalez Calbet, J. Solid State Chem. 1993, 102, 434.
[25] A. Dieguez, A. Vila, A. Cabot, A. Romano Rodriguez, J. R. Morante, J. Kappler, N. Barsan, U. Weimar, W. Göpel, Sens. Actuators B 2000, 68, 94.
[26] K. Soulantica, A. Maisonnat, M.-C. Fromen, M.-J. Casanove, P. Lecante, B. Chaudret,
[27] K. Soulantica, A. Maisonnat, F. Senocq, M.-C. Fromen, M.-J. Casanove, B. Chaudret,
Angew. Chem. Int. Ed. 2001, 40, 2983.
[28] C. Pan, K. Peltzer, K. Philippot, B. Chaudret, J. Am. Chem. Soc. 2001, 123, 7584. [29] N. Cordente, M. Respaud, F. Senocq, M.-J. Casanove, C. Amiens, B. Chaudret, Nano
Lett. 2001, 1, 565.
[30] F. Dumestre, B. Chaudret, C. Amiens, M.-C. Fromen, M.-J. Casanove, P. Renaud, P. Zurcher, Angew. Chem. Int. Ed. 2002, 41, 4286.
[31] K. Philippot, B. Chaudret, C. R. Chimie 2003, 6, 1019.
[32] K. Peltzer, O. Vidoni, K. Philippot, B. Chaudret, V. Collière, Adv. Funct. Mater. 2003,
13, 118.
[33] F. Dumestre, B. Chaudret, C. Amiens, P. Renaud, P. Fejes, Science 2004, 303, 821. [34] C. Nayral, T. Ould-Ely, A. Maisonnat, B. Chaudret, P. Fau, L. Lescouzeres, A.
Peyre-Lavigne, Adv. Mater. 1999, 11, 61.
[35] C. Nayral, E. Viala, P. Fau, F. Senocq, J.-C. Jumas, A. Maisonnat, B. Chaudret, Chem.
Eur. J. 2000, 6, 4082.
[36] F. Rataboul, C. Nayral, M.-J. Casanove, A. Maisonnat, B. Chaudret, J. Organometal.
Chem. 2002, 643-644, 311.
[37] K. Soulantica, L. Erades, M. Sauvan, F. Senocq, A. Maisonnat, B. Chaudret, Adv.
Funct. Mater. 2003, 13, 553.
[38] M. Monge, M. L. Kahn, A. Maisonnat, B. Chaudret, Angew. Chem. Int. Ed. 2003, 42, 5321.
[39] C. Amiens, D. de Caro, B. Chaudret, J. Bradley, R. Mazel, C. Roucau, J. Am. Chem.
Soc. 1993, 115, 11638.
[40] A. Duteil, R. Quéau, B. Chaudret, R. Mazel, C. Roucau, J. S. Bradley, Chem. Mat.
[41] S. Gomez, L. Erades, K. Philippot, B. Chaudret, V. Collière, O. Balmes, J.-O. Bovin,
Chem. Commun. 2001, 1474.
[42] P. T. Moseley, P. Maitlis, J. Chem. Soc. Chem. Commun. 1971, 982.
[43] P. Fau, C. Nayral, B. Chaudret, A. Maisonnat, European patent, EP 0947245 (1999-10-06); US patent, US 6, 395, 053 B1 (2002-05-28).
[44] D. A. Fletcher, R. F. McMeeking, D. Parkin, the United Kingdom Chemical Database
Service, Chem. Inf. Comput. Sci. 1996, Vol. 36, 746.
[45] P. Fau, M. Sauvan, S. Trautweiler, C. Nayral, L. Erades, A. Maisonnat, B. Chaudret,
Sens. Actuators B 2001.
[46] B. Chaudret, L. Erades, P. Fau, A. Maisonnat, C. Nayral, J.-L. Simon, PCT Int. Appl., WO 01/02844 (11-01-2001).
[47] Handbook of X-Ray Photoelectron Spectroscopy, Perkin Elmer, Eden Prairie, MN, 1979.
[48] C. D. Wagner, A. V. Naumkin, A. Kraut-Vass, J. W. Allison, C. J. Powell, J. Rumble, J.R., NIST Standard reference Database 20, version 3.3 ed., National Institute of Standards and Technology, USA, 2000.
[49] D. Grandjean, R. E. Benfield, C. Nayral, A. Maisonnat, B. Chaudret, J. Phys. Chem. B
2004, 108, 8876.
[50] J. E. Drawdy, G. B. Hoflund, S. D. Gardner, E. Yngvadottir, D. R. Schryer, Surface
and Interface Analysis 1990, 16, 369.
[51] D. F. Cox, G. B. Hoflund, H. A. Laitinen, Langmuir 1985, 1, 269.
[52] J. Kappler, N. Barsan, U. Weimar, A. Dieguez, J. L. Alay, A. Romano Rodriguez, J. R. Morante, W. Göpel, Fresenius J. Anal. Chem. 1998, 361, 110.