HAL Id: hal-00329228
https://hal.archives-ouvertes.fr/hal-00329228
Submitted on 1 Jan 2003
HAL is a multi-disciplinary open access
archive for the deposit and dissemination of
sci-entific research documents, whether they are
pub-lished or not. The documents may come from
teaching and research institutions in France or
abroad, or from public or private research centers.
L’archive ouverte pluridisciplinaire HAL, est
destinée au dépôt et à la diffusion de documents
scientifiques de niveau recherche, publiés ou non,
émanant des établissements d’enseignement et de
recherche français ou étrangers, des laboratoires
publics ou privés.
N. Cornilleau-Wehrlin, G. Chanteur, S. Perraut, L. Rezeau, P. Robert, A.
Roux, C. de Villedary, P. Canu, M. Maksimovic, Y. de Conchy, et al.
To cite this version:
N. Cornilleau-Wehrlin, G. Chanteur, S. Perraut, L. Rezeau, P. Robert, et al.. First results obtained
by the Cluster STAFF experiment. Annales Geophysicae, European Geosciences Union, 2003, 21 (2),
pp.437-456. �hal-00329228�
Annales
Geophysicae
First results obtained by the Cluster STAFF experiment
N. Cornilleau-Wehrlin1, G. Chanteur1, S. Perraut1, L. Rezeau1, P. Robert1, A. Roux1, C. de Villedary1, P. Canu1, M. Maksimovic2, Y. de Conchy2, D. Hubert2, C. Lacombe2, F. Lefeuvre3, M. Parrot3, J. L. Pinc¸on3, P. M. E. D´ecr´eau3, C. C. Harvey4, Ph. Louarn4, O. Santolik5, H. St. C. Alleyne6, M. Roth7, T. Chust1, O. Le Contel1, and STAFF team
1CETP/UVSQ, 10–12 Av. de l’Europe, 78140 V´elizy, France
2DESPA, Observatoire de Paris, 92195 Meudon Cedex, France
3LPCE, 3 A Av. de la Recherche Scientifique, 45071 Orl´eans Cedex 2, France
4CESR, 9 Av. du Colonel Roche, 31029 Toulouse Cedex, France
5Faculty of Mathematics and Physics, V Holesovickach 2, CZ-180 00 Praha 8, Czech Republic
6University of Sheffield, Mapping Street, Sheffield, S1 4DU, UK
7IASB, 3 Av. circulaire, B-1180 Bruxelles, Belgique
Received: 17 July 2001 – Revised: 19 June 2002 – Accepted: 23 August 2002
Abstract. The Spatio Temporal Analysis of Field
Fluctu-ations (STAFF) experiment is one of the five experiments, which constitute the Cluster Wave Experiment Consortium (WEC). STAFF consists of a three-axis search coil magne-tometer to measure magnetic fluctuations at frequencies up to 4 kHz, a waveform unit (up to either 10 Hz or 180 Hz) and a Spectrum Analyser (up to 4 kHz). The Spectrum Analyser combines the 3 magnetic components of the waves with the two electric components measured by the Electric Fields and Waves experiment (EFW) to calculate in real time the 5×5 Hermitian cross-spectral matrix at 27 frequencies distributed logarithmically in the frequency range 8 Hz to 4 kHz. The time resolution varies between 0.125 s and 4 s. The first re-sults show the capabilities of the experiment, with examples in different regions of the magnetosphere-solar wind system that were encountered by Cluster at the beginning of its op-erational phase. First results obtained by the use of some of the tools that have been prepared specifically for the Cluster mission are described. The characterisation of the motion of the bow shock between successive crossings, using the re-ciprocal vector method, is given. The full characterisation of the waves analysed by the Spectrum Analyser, thanks to a dedicated program called PRASSADCO, is applied to some events; in particular a case of very confined electromagnetic waves in the vicinity of the equatorial region is presented and discussed.
Key words. Magnetospheric physics (magnetopause, cusp
and boundary layer) – Space plasma physics (waves and in-stabilities; shock waves)
Correspondence to: N. Cornilleau-Wehrlin
1 Introduction
The Cluster mission has been designed to study the thin lay-ers of the interaction regions between the solar wind and the Earth’s magnetosphere. Within these regions, waves are of particular importance because, in the absence of collisions, they provide the effective coupling between particles of the same and of different species and give rise to anomalous transport. The understanding of the basic physics of these regions comes from a comprehension of the wave-particle interactions therein and their consequences for the various particle populations present, as well as for the link between small scale and large scale physical processes. Thus it is im-portant to characterise the waves and turbulence: this is the objective of the Cluster STAFF measurements. Four point measurements allow, for the first time, a clear separation of spatial and temporal effects.
The purpose of the present paper is to give an overview of the very first observations and indications of how to use some of the specific STAFF data analysis tools to achieve the above objectives, namely how to determine the wave characteris-tics in the frequency range of the STAFF Spectrum Analyser (10 Hz–4 kHz) with the help of the dedicated PRASSADCO program and how to characterise a shock surface and its ve-locity using the reciprocal vector method. This is preceded by a short summary of the STAFF instrument characteristics.
2 Instrument characteristics
STAFF is one of the five experiments of the Wave Exper-iment Consortium (WEC) (Pedersen et al., 1997). To op-timise co-ordination within WEC, the STAFF investigator
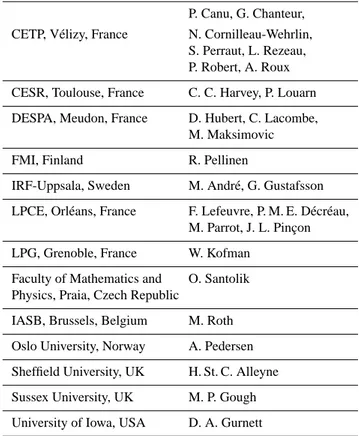
Table 1. STAFF investigator team
P. Canu, G. Chanteur,
CETP, V´elizy, France N. Cornilleau-Wehrlin,
S. Perraut, L. Rezeau, P. Robert, A. Roux
CESR, Toulouse, France C. C. Harvey, P. Louarn
DESPA, Meudon, France D. Hubert, C. Lacombe,
M. Maksimovic
FMI, Finland R. Pellinen
IRF-Uppsala, Sweden M. Andr´e, G. Gustafsson
LPCE, Orl´eans, France F. Lefeuvre, P. M. E. D´ecr´eau,
M. Parrot, J. L. Pinc¸on
LPG, Grenoble, France W. Kofman
Faculty of Mathematics and O. Santolik
Physics, Praia, Czech Republic
IASB, Brussels, Belgium M. Roth
Oslo University, Norway A. Pedersen
Sheffield University, UK H. St. C. Alleyne
Sussex University, UK M. P. Gough
University of Iowa, USA D. A. Gurnett
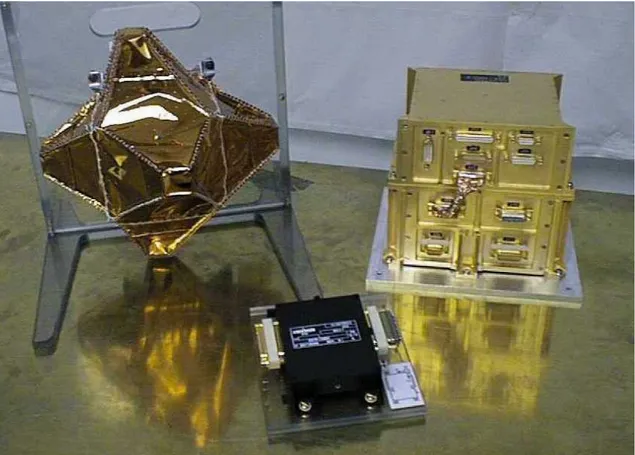
team includes all the WEC Principal Investigators (Table 1). The optimisation of the analysis of the 5 components of the electromagnetic waves is among the objectives of the WEC. The STAFF experiment comprises a boom-mounted three-axis search coil magnetometer, a preamplifier and an elec-tronics box that houses the two complementary data-analysis packages: a digital Spectrum Analyser and an on-board waveform unit. The experiment is briefly described below, with some emphasis on elements of interest for the further wave characteristic determination and the comparison be-tween the four spacecraft. For a detailed description of the experiment, see Cornilleau-Wehrlin et al. (1997). Figure 1 shows the three elements of the STAFF experiment in a clean room before mounting it on the spacecraft.
From ground measurements, the sensitivity of the three
mutually orthogonal sensors is 5 10−3nT Hz−1/2at 1 Hz and
4 10−5nT Hz−1/2 at 100 Hz and 4 kHz. The similarity of
the search coils mounted on the four spacecraft is good: the
phase is reproducible within ±1◦and the amplitude within
0.2 dB. The dynamic range of the associated preamplifiers is about 100 dB. Figure 2 gives an example of comparison of the sensitivities as measured on the ground and in-flight. The results are similar for the four spacecraft. The in-flight measurements have been obtained in the lobe region during the commissioning phase. The ground measurements (blue curve, in the quiet site of Chambon La Forˆet) correspond to the sensitivity at the output of the preamplifiers, whereas
the in-flight curves are obtained at the output of the two on-board analysers that are described below (red for the mag-netic waveform analyser and green for the Spectrum Anal-yser). Note that, roughly speaking, the in-flight sensitivity is equivalent or better than on the ground. This means that the analysers do not alter the sensitivity, despite the presence of small interferences visible at 70 Hz, 140 Hz and 900 Hz, the first two being internal and the third coming from the DWP internal clock. Their level is only a few dBs above the noise level and does not affect the wave measurements. When the sensitivity is better than on ground, it is due to the absence of the power lines 50 Hz signal in flight.
The magnetic waveform unit comprises low-pass filters of the fifth order, characterized by a 3 dB attenuation at either 10 Hz or 180 Hz, selected by telecommand in accordance with the telemetry rate. The sampling rate is 25 and 450 Hz respectively. The output signals are digitised in a real 16 bit analogue-to-digital converter. The 96 dB dynamic range al-lowed by the 16 bit digitalisation permits us to analyse
simul-taneous natural waves of a few 10−5nT Hz−1/2and the large
signal induced by the rotation of the spacecraft in the envi-ronmental DC field, up to some 100 nT at 0.25 Hz. With such a dynamic range we can get accurate measurements, even at the inversion of the DC magnetic field, e.g. at the magne-topause. In order to facilitate the combined data analysis of the magnetic and electric components of the waves – in par-ticular the phase determinations – the band pass filters of the Electric Fields and Waves experiment, EFW (Gustafsson et al., 1997), and STAFF ones are identical. Moreover the sam-pling of electric and magnetic waveforms is synchronised by DWP, the Digital Wave-Processing experiment (Woolliscroft et al., 1997). Owing to telemetry limitations, a reduction of the dynamic data range from 16 to 12 bits is performed inside DWP. The principle is to transmit the full 16-bit word at the beginning of each telemetry packet and, later, the difference between the successive samples, coded on 12 bits in such a way that the dynamics of the experiment is preserved even at boundary crossings. Conservative back-up solutions can be selected by telecommand, being either a more crude com-pression, or no compression at all. The back-up compression is used during three hours around perigee where the spin sig-nal can be above some 200 nT. The three modes have been successfully tested during the commissioning phase.
At higher frequencies, for which the telemetry does not permit us to get the waveform, an onboard Spectrum Anal-yser is part of the STAFF experiment. In addition to the three search coil output signals, the Spectrum Analyser receives the signals from the four electric field probes of the EFW experiment. These are used to form a pair of orthogonal electric field dipole sensors. All five inputs (2×E + 3×B) are used to compute in real time the 5×5 Hermitian cross-spectral matrix at 27 frequencies distributed logarithmically in the frequency range 8 Hz to 4 kHz. The components in the spin plane are despun onboard. All channels are sampled si-multaneously and the integration time for each channel is the same as the overall instrument time resolution which can be commanded to values between 125 ms and 4 s. The five
auto-Fig. 1. Picture of the STAFF experiment in a clean room at V´elizy. At the left are the three orthogonal search coils under their thermal blanket. In the middle the preamplifier and on the right-hand side is the electronics box which comprises two parts; at the bottom the Spectrum Analyser built by DESPA, Meudon, on top of which is the waveform analyser (CETP).
Fig. 2. STAFF search coils and analyser sensitivity. Comparison of ground measurements (blue curve) at the output of the preamplifier in the quiet site of Chambon la Forˆet and in-flight measurements performed in a quiet region, the lobes, at the output of the waveform analyser (red curve) and the Spectrum Analyser (green). The peaks on the green curve are small WEC internal interferences.
spectral power estimates are obtained with a dynamic range of approximately 100 dB and an average amplitude resolu-tion of 0.38 dB. The 10 cross-spectral power estimates are normalised to give the coherence. The precision of the phase depends upon the magnitude of the coherence: for a signal
with magnitude in the highest bin it is approximately 5◦close
to 0◦, 180◦and ±90◦, increasing to about 10◦midway
be-tween these angles.
STAFF also implements an onboard calibration that per-mits us to recalculate the transfer function in case of any vari-ation of the experiment response; this is crucial for compari-son between the four spacecraft. The calibration sequence is run once every three orbits.
The search coil signals at the output of the preamplifier are delivered to the Electron Drift Instrument (EDI) (Paschmann et al., 1997) and to two of the WEC experiments, Wide-Band Plasma Wave (WBD) (Gurnett et al., 1997) and EFW ex-periments. The internal memory of EFW allows us, among different possibilities, to get small snapshots of the five com-ponent waveform up to 4 kHz. This EFW mode can be trig-gered by the FGM magnetic field intensity. But in order to have this simultaneously on the four spacecraft it has to be time tagged.
In addition, it is possible to use electric field measurements from EDI. The combination of data from the EFW, EDI and STAFF allows the determination of the six components of the electromagnetic field. This will be the subject of a further study. The inter-experiment link between STAFF and EDI permits synchronising EDI and WEC data.
3 Overview of first STAFF measurements
Cluster spacecraft were launched by pair, on 16 July 2000 and 9 August 2000. The commissioning phase took about three months, each experiment being switched on and ver-ified independently on every spacecraft; this period was followed by an interference campaign in December during which all experiments were working together, in order to look at possible interference between instruments and to de-termine the best operational modes. STAFF data have been shown to be free of interference from other experiments. Only the foreseen perturbations inside WEC have been ev-idenced, related to some Whisper (D´ecr´eau et al., 1997) and EFW active modes. We get rid of these perturbations by the already defined operational WEC modes. During active Whisper modes, the electric components of the waves are not analysed by the Spectrum Analyser (4 s every 28 or 104 s) which moreover permits us to give more telemetry to Whis-per at those times (see the WEC modes in Pedersen et al., 1997). The nominal phase of operation started on the sec-ond of February 2001 allowing four simultaneous spacecraft measurements of all instruments together. However, since 7 December 2000 we were able to obtain some snapshots of the 4 spacecraft simultaneous operations.
In order to take full benefit of the four spacecraft measure-ments, specific tools have been prepared by the STAFF team
which are summarised in Cornilleau-Wehrlin et al. (2000) and can also be found in the book containing the results of the working group devoted to multi-spacecraft data analysis and held under the auspices of ISSI (Paschmann and Daly, 1998, http://www.issi.unibe.ch/). Among these tools are the adaptive correlation function method (Rezeau et al., 1998) for the study of very small scale structures (1 s or less), the Field Energy Distribution (FED) method (Pinc¸on and Lefeu-vre, 1991) that uses the waveform measurements from the four spacecraft to determine the k vector distribution of the waves and the wave distribution function (WDF) (Lefeuvre et al., 1981) that is determined from the auto- and cross-power spectra at a given spacecraft location. The latter method is used in a specific program, PRASSADCO (see Sect. 4 below), applied to data coming from the STAFF Spectrum Analyser. An application of the reciprocal vector method (Chanteur, 1998) is given in Sect. 5.
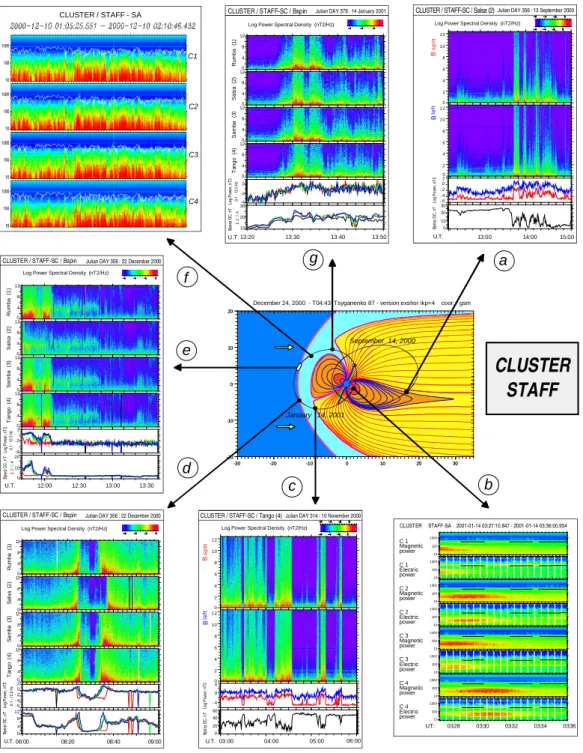
Before entering into details of two examples of use of spe-cific tools, Fig. 3 gives an overview of STAFF wave data taken in the main regions of interest of the Cluster mission. A projection of the magnetospheric magnetic field in the noon-midnight meridian plane, obtained by the Tsyganenko 1987 model, is shown at the centre of the figure, on top of which are plotted the projections of 2 Cluster orbits (14 September 2000 and 14 January 2001). Examples of wave measure-ments for the different regions are linked by arrows to the Cluster orbit in this magnetosphere representation. The small images are dynamic spectra obtained either from the low fre-quency waveform data (a, c, d, e, g) or from the Spectrum Analyser part (b, f). Below the dynamic spectra coming from the waveform are also plotted the power in the band 0.3– 12 Hz and, at the very bottom, the component of the mag-netic field in the spin plane as deduced from the STAFF spin signal, the curves corresponding to the different satellites be-ing plotted together or not, dependbe-ing on the availability of the data. When there are 4 spacecraft data, the colour code is the “standard” Cluster one: black for SC1, red for SC2, green for SC3 and blue for SC4.
3.1 Examples in the magnetosphere
At the top right of Fig. 3, image (a) represents the low frequency dynamic spectra of one of the first central plasmasheet crossings during the commissioning phase in September 2000. One can see the bursty nature of the mag-netic fluctuations as Cluster enters the plasmasheet. First 4 points measurements to study the plasmasheet boundary layer and the central plasmasheet, started during the summer of 2001 with particular attention to the link between waves, particle acceleration and transport, the key questions being linked to substorm onset and dynamics (see e.g. Le Contel et al., 2001a, b and references therein).
Panel 3(b) represents from top to bottom magnetic and
electric field powers (Bx2+ By2 + Bz2 and E2x + E2y
respec-tively) for spacecraft 1 to 4 as measured by the STAFF Spec-trum Analyser, while Cluster was close to perigee at about 03:00 local time, near the equatorial plane. This event will
0 4 8 12 R u m b a (1 ) 0 4 8 12 S a ls a (2 ) 0 4 8 12 S a m b a (3 ) 0 4 8 12 T a n g o (4 ) -4 -2 0 13:20 13:30 13:40 13:50 10 20 30 1 2 3 4 U.T.
Julian DAY 379 : 14 January 2001 CLUSTER / STAFF-SC / Bspin
Log Power Spectral Density (nT2/Hz)
0. 1 -1 2. 5 Hz Bp er p DC ,n T Lo g Po we r, nT 2 CLUSTER STAFF-SA 2001-01-14 03:27:10.847 - 2001-01-14 03:36:00.934 UT: 0328 0330 0332 0334 0336 C 1 Magnetic power 10 100 1000 C 1 Electric power 10 100 1000 C 2 Magnetic power 10 100 1000 C 2 Electric power 10 100 1000 C 3 Magnetic power 10 100 1000 C 3 Electric power 10 100 1000 C 4 Magnetic power 10 100 1000 C 4 Electric power 10 100 1000 CLUSTER / STAFF - SA C1 C2 C3 C4 13:00 14:00 15:00 U.T.
Julian DAY 356 : 13 September 2000 CLUSTER / STAFF-SC / Salsa (2)
Log Power Spectral Density (nT2/Hz)
0 2 4 6 8 10 12 0 2 4 6 8 10 12 - 4 0 4 03:00 04:00 05:00 06:00 0 20 40 60 U.T. B le ft B s p in
Julian DAY 314 : 10 November 2000 CLUSTER / STAFF-SC / Tango (4)
Log Power Spectral Density (nT2/Hz)
Bp er p DC ,n T Lo g Po we r, nT 2 0 4 8 12 R u m b a (1 ) 0 4 8 12 S a ls a (2 ) 0 4 8 12 S a m b a (3 ) 0 4 8 12 T a n g o (4 ) -6 - 4 - 2 0 2 08:00 08:20 08:40 0 4 8 12 U.T.
Julian DAY 356 : 22 December 2000 CLUSTER / STAFF-SC / Bspin
Log Power Spectral Density (nT2/Hz)
0. 1 -1 2. 5 Hz Bp er p DC ,n T Lo g Po we r, nT 2 09:00 0 4 8 12 R u m b a (1 ) 0 4 8 12 S a ls a (2 ) 0 4 8 12 S a m b a (3 ) 0 4 8 12 T a n g o (4 ) -6 -2 2 12:00 13:00 0 10 20 1 2 3 4 U.T.
Julian DAY 356 : 22 December 2000 CLUSTER / STAFF-SC / Bspin
Log Power Spectral Density (nT2/Hz)
0. 1 -1 2. 5 Hz 12:30 13:30 Bp er p DC ,n T Lo g Po we r, nT 2 -30 -20 -10 0 10 20 30 -20 -10 0 10 20 -30 -20 -10 0 10 20 30 -20 -10 0 10 20
December 24, 2000 - T04:43 Tsyganenko 87 - version exshor ikp=4 coor: gsm
b c d g a e f January 14, 2001 September 14, 2000 0 2 4 6 8 10 12 0 2 4 6 8 10 12 - 6 - 4 - 2 0 2 0 10 20 30 B le ft B s p in Bp er p DC ,n T Lo g Po we r, nT 2
CLUSTER
STAFF
Fig. 3. Overview of some STAFF observations. The middle panel is a magnetospheric representation in the noon-midnight meridian plane where the magnetic field lines come from the Tsyganenko 1987 model. The projection of 2 orbits of cluster in this plane are plotted, for 14 September 2000 and 14 January 2001. The arrows show where the data have been acquired. panels (a), (c), (d), (e), and (g) are dynamic spectra of the magnetic waveform data in the 0–12 Hz frequency range. Below is represented the integrated power in this frequency range and the bottom panel represents the DC component of the magnetic field in the spin plane as deduced from the STAFF spin signal. For panels (a) and (c), 2 components of a single spacecraft data are plotted. For panels (d), (e) and (g), one component of the 4 spacecraft are represented. For the curves, the colour code is the “standard” Cluster one: black for SC1, red for SC2, green for SC3 and blue for SC4. Panels (b) and (f) are dynamic spectra obtained from the Spectrum Analyser in the frequency range 10 Hz–4 kHz, spacecraft 1 to 4 being plotted from top to bottom. The different examples: (a) – plasmasheet crossing; (b) – successively B and E components close to perigee when Cluster crosses the equatorial plane at 03:00 LT; (c) – magnetopause crossings at about 18:00 LT; (d) – two successive bow shock crossings; (e) – shock crossing and upstream waves; (f) – waves in the magnetosheath, the white line being the electron gyrofrequency; (g) – the first cusp crossing observed by Cluster.
be discussed in some detail in Sect. 4, as an illustration of a 4 spacecraft study.
Panel (g) in Fig. 3 gives the dynamic spectra from 0.1 to 12 Hz during the first identified cusp crossing by Cluster on 14 January 2001. This event has been studied in the frame-work of ground-Cluster studies (Opgenoorth et al., 2001). The cusp is a region where magnetosheath plasma, of solar wind origin, enters the magnetosphere because of its singular magnetic field configuration. In spite of the key role it may play, the exterior cusp is one of the less explored regions of space and thus is one of the primary objectives for Cluster studies. It has been visited only by the HEOS spacecraft at al-titude as high as Cluster does, complemented recently by In-terball (see e.g. Savin et al., 1998) and Polar measurements, giving new plasma wave measurements in particular in the cusp turbulent boundary layer, showing the importance of very localised structures (Pickett et al., 2001). Since 14 Jan-uary, the four Cluster spacecraft have crossed the cusp at high altitude many times, opening a field of new results, especially on the localisation of the source region of waves and on the link with the particles. Another example of cusp crossing is shown in Sect. 4.
3.2 The magnetopause
Fig. 3, Panel (c), illustrates a series of magnetopause cross-ing on 10 November 2000. Cluster was nearly at apogee, the crossings were then at low latitude, at about 19:00 LT. The crossings are characterised by an abrupt increase in the wave activity and power. At the same time the amplitude of the magnetic field in the plane perpendicular to the spin de-creases. When Cluster is in the magnetosphere, there is no wave activity coming from the magnetosphere.
The investigation of the physical processes, by which mass and momentum are transferred through the magnetopause, from the solar wind to the magnetosphere, is one of the
prime goals of the mission. Different models have been
proposed, such as the reconnection model (Sonnerup, 1980) or the Kelvin-Helmholtz instability (Pu and Kivelson, 1983; Belmont and Chanteur, 1989). Also, there is evidence for localised flux tubes, known as Flux Transfer Events (FTEs), connecting the magnetosheath to the magnetosphere (Rus-sell and Elphic, 1979; Farrugia et al., 1987); but whether FTEs are the remnants of reconnection events or the non-linear consequence of tearing instability (Bhattacharjee et al., 1999) or Kelvin-Helmholtz instability is still an open ques-tion. Different experimental studies have given the indication that the small-scale electromagnetic fluctuations, the ampli-tude of which is maximum at the magnetopause (Perraut et al., 1979; Rezeau et al., 1989; Tsurutani et al., 1989), were likely to play a significant role in these transfers, taking the place of collisions which don’t exist in the medium. After some preliminary studies (Belmont et al., 1995; De Keyser et al., 1999), a recent theoretical model (Belmont and Rezeau, 2001) shows how the electromagnetic turbulence present in the magnetosheath can couple with the boundary. According to this paper, when incident waves, supposed to propagate
in the fast magnetosonic mode, impinge upon the magne-topause, they first convert to Alfv´en waves. In the presence of a magnetic field rotation, they can then be trapped in the boundary thus producing a local enhancement of the fluctua-tion level. The major consequence of this trapped small-scale turbulence should be to allow micro-reconnection through the magnetopause to be distributed all over the boundary. The role of the waves that are observed there is one of the prime objectives of STAFF.
A case study applied to the crossing of 10 December 2000 around 18:00 LT at high latitude, is presented in Rezeau et al. (2001); in summary thus shows that the boundary is far from being a regular surface that could be modelled by a parabolo¨ıd. On the contrary, the studied case shows that the magnetopause is the seat of surface waves, possibly due to Kelvin-Helmholtz instability. Superimposed upon this large-scale instability are ULF/ELF fluctuations (0.1− ∼100 Hz) that, as previously observed, maximise at the magnetopause crossing but are also present both in the boundary layer and the magnetosheath.
Further studies need to solve a number of pending ques-tions, such as the determination of the propagation mode of the fluctuations. The application of the Field Energy Distri-bution method to the four spacecraft data should give more precise answers than previous studies with a single spacecraft (Rezeau et al., 1989; Stasiewicz et al., 2001), since it will be possible to disentangle the presence of different modes at the same frequency.
3.3 The magnetosheath, the bow shock and the solar wind
Figure 3d is an example of multiple shock crossings on 22 December 2000 around 08:30 UT. This event is analysed in Sect. 5. Note that, with a 600 km separation, the four Clus-ter see significant differences in crossing time. Figure 3e shows multiple shocks crossings later the same day and up-stream waves in the Solar Wind. Spacecraft 2 which is fur-ther away from the Earth, remains in the Solar Wind. These waves at a few Hz called “upstream propagating whistlers” have been detected in front of the ion foreshock, in the elec-tron foreshock (Russell et al., 1971). The origin of these waves is still controversial: they could be anisotropy-driven instabilities amplified locally by electrons (Sentman et al., 1983) or they could be generated at the shock itself by the ions and then propagate upstream (Krauss-Varban et al., 1995). Data from the four STAFF experiments allow the source of the waves to be localised and, together with the measurements of the particle distribution function, to answer the question of the origin of these waves.
The study of the shock itself also constitutes a primary goal of Cluster. Among the unanswered question are e.g. the role of the waves in the particle energy dissipation or in the shock reformation (Burgess, 1989; Krasnosselskikh et al., 2002). The progress to be made, thanks to the four Clus-ter measurements in this region, by identifying the modes together with the study of the particle distribution functions, are discussed in Cornilleau-Wehrlin et al. (1997).
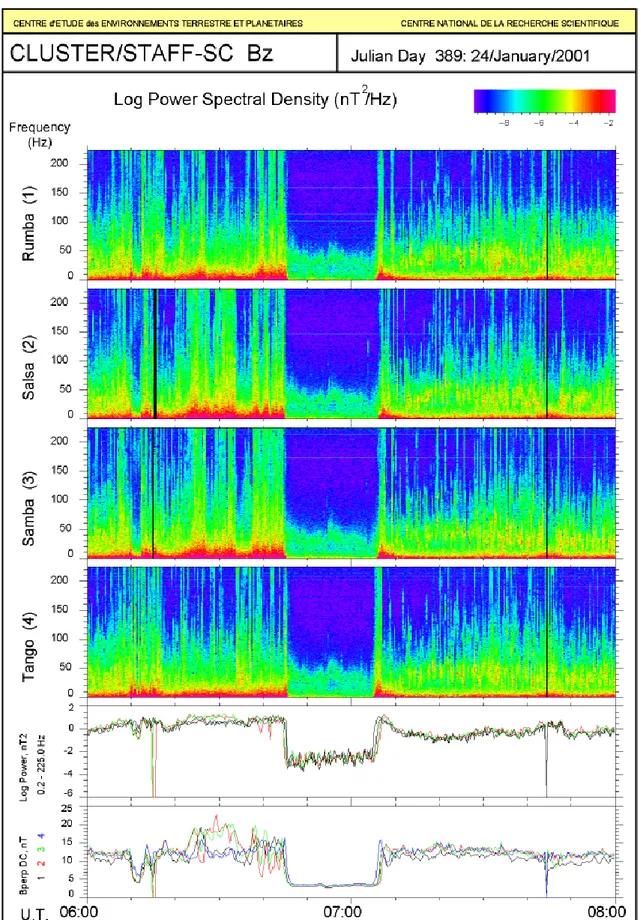
Fig. 4. An example of burst mode data, when the waveforms are sampled at 450 Hz. The spectrogram gives data for the four spacecraft. Cluster crosses the Earth bow shock twice. The presentation is as described for Fig. 3. While the crossings are approximately at the same time on the four spacecraft, differences are visible both in integrated power and B field in the spin plane in the two bottom panels.
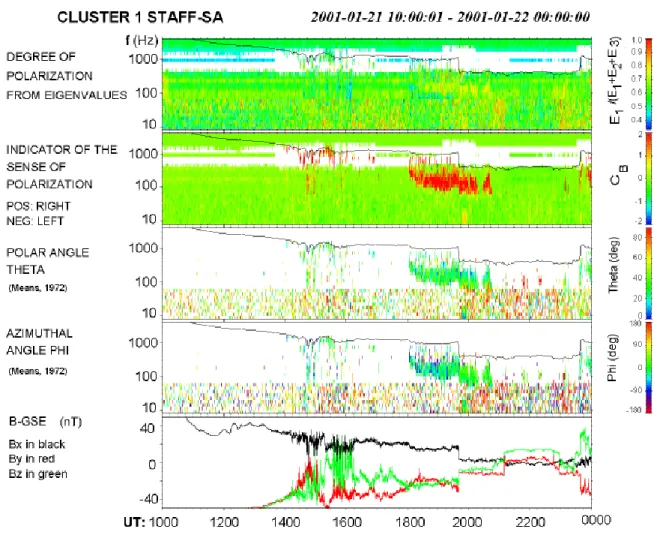
Fig. 5a. Overview of dynamic spectra from the Spectrum Analyser data (10 Hz–4 kHz) for 14 h of data on 21 January 2001. The white line superimposed on the dynamic spectra is the electron gyrofrequency computed from the FGM data. Between 14:00 and 16:00 UT Cluster probably first crosses the cusp, then the magnetopause, and stays in the magnetosheath until the bow shock is crossed at 19:40 UT, Cluster then being in the Solar Wind until 23:40 UT.
Fig. 5b. Characterisation of the waves for spacecraft 1 for the same time interval as in Fig. 5a. From top to bottom, the degree of polarisation, the sense of polarisation and the angles theta and phi values are colour coded, as indicated on the right hand side of the figure. The gyrofrequency is plotted in black. The bottom panel gives the 4 s averaged magnetic field components from the FGM Prime Parameter data. The waves above 100 Hz are clearly right handed.
Another series of shock crossings is given in Fig. 4. This is an example of burst mode data, when the waveforms are sampled at 450 Hz. The spectrogram shows data for the four spacecraft. Cluster crosses the Earth bow shock twice, while the four spacecraft were at about 600 km from each others. The presentation is the same as on Fig. 3. Whereas the spectrograms of the four spacecraft exhibit a great similar-ity when they cross the bow shock, the integrated power and the B field in the spin plane, shown in the two bottom panels, evidence a time delay. The wave modes can be characterised from the waveform data up to 200 Hz. For further studies it is worth noticing that at the same time EFW electric field waveform is acquired in the same frequency range. During this sequence, one can see that, in the magnetosheath side of the shock, two kinds of waves can be distinguished; one is turbulent-like and its frequency covers the whole range. A more structured type of wave is superimposed on the broad band waves, the frequency of which varies between 10 and 50 Hz. The frequency is not always the same on the four spacecraft. It is likely to be whistler mode waves, since
the electron gyrofrequency is about 400 Hz in the magne-tosheath.
Figure 3f represents dynamic spectra of the total magnetic power as measured by the Spectrum Analyser in the magne-tosheath. This region is rich in wave activity, as previously shown by ISEE (Anderson et al., 1982) and AMPTE results (Anderson et al., 1994). A case study of the so-called lion roars (Smith and Tsurutani, 1976) is done in Maksimovic et al. (2001), using the STAFF Spectrum Analyser data. The structured waves seen in Fig. 4 are probably of this kind, but further study is needed to confirm this. With Cluster, it is the first time that lion roars can be studied at high latitude; it will be possible to look at source repartition, location and size and to confirm or not whether the lion roars observed out-side B field minima come from mirror mode regions or not (Zhang et al., 1998; Baumjohann et al., 1999). As mentioned above, the broadband low frequency waves in the magne-tosheath, possibly magnetosonic waves, can be the source of the strong ULF waves observed at the magnetopause and in the boundary layer. To validate this idea, further study, based
on the identification of the mode of these magnetosheath waves using the four spacecraft, is necessary.
4 The Prassadco tool to analyse Spectrum Analyser data. Examples of applications
PRASSADCO (PRopagation Analysis of STAFF-SA Data with COherency tests) is a computer program designed to analyse multicomponent measurements of electromagnetic waves. It implements a number of methods used to estimate polarisation and propagation parameters, such as degree of polarisation, sense and axes of the polarisation ellipse, wave vector direction, Poynting vector and refractive index (San-tolik, 2001). The main purpose of PRASSADCO is to fa-cilitate scientific analysis of the spectral matrix obtained by the STAFF-SA (Spectrum Analyser) instruments onboard the four satellites. The inputs of this software are the Cluster data CD-ROMs provided by ESA, the CSDS Prime Parameters of FGM and the CSDS Summary Parameters of auxiliary data. The results can be represented in different visual and numer-ical formats. Tests have been made with simulated data and with ground test data of STAFF-SA. A similar program was used to analyse data of previous satellites (Santolik and Par-rot, 1998, 1999; Santolik et al., 2001).
4.1 A study from perigee to Solar Wind
In Fig. 5a, 14 hours of Spectrum Analyser data are plotted for 21 January 2001. From top to bottom, magnetic and elec-tric field power spectral densities for spacecraft 1 to 4 in the frequency range 8 Hz–4 kHz are plotted. The value of the gyrofrequency, obtained thanks to the FGM prime parameter data, is superimposed on the dynamic spectra (a white line), when in the frequency range of STAFF SA. During the 14 h,
the four Cluster fly from 6 REat 17:00 Local Time to 17 RE
at 14:00 LT. At the beginning of the period, Cluster is in the auroral zone. There are only electrostatic waves observed in the plotted frequency range at that time. The magnetic fluc-tuations start around 14:00 UT when Cluster is likely to enter the cusp turbulent region. The exact regions have to be de-termined by further comparison with particle measurements which is out of the scope of the present paper. At 15:30 UT, Cluster crosses the magnetopause maybe several times and then remains in the magnetosheath, until it enters the solar wind after a shock crossing at 19:40 UT, and stays in the solar wind until it crosses the bow shock again at 23:40 UT. Much wave activity is present during all of the time period, with an abrupt change for the electrostatic waves at shock cross-ings. In the magnetic spectra one can see two main com-ponents: a broad band noise at low frequency up to about 100 Hz and, on each side of the first shock crossing, a struc-tured noise above 100 Hz in the magnetosheath and below in the solar wind. In Fig. 5b one can see that the structured waves are polarised, right handed, down stream and upstream of the first shock crossing. Again, the downstream structured whistler mode waves are likely to be lion roar waves which
need to be studied with high-resolution magnetic field data. This data set gives an example of the possibilities of STAFF SA and PRASSADCO. To complete this overview, dynamic spectra of low frequency magnetic components of the waves, obtained from the waveform data, are given for the same time interval on Fig. 6. This shows the low frequency part of the broad band waves, observed by STAFF-SA above 10 Hz, i.e. mainly in the cusp/boundary layer region and in the magne-tosheath, the same kind of broad band noise as mentioned in Sect. 3.
4.2 An example of wave mode identification and
localisa-tion of equatorial noise
Figure 7a (same as panel (b) of Fig. 3) and Fig. 7b give another example of results obtained with the four Cluster by STAFF SA and the PRASSADCO program. These data come from a perigee pass. The presentation of the data in Fig. 7a is similar to Fig. 5a but here the time interval cor-responds to only 9 min of data. The electromagnetic noise observed in the frequency band 20–80 Hz is not observed at the same time on the four spacecraft, first on SC1, then SC3, SC2 and SC4. Figure 7b gives some wave characteristics for SC2 and SC4. The results are similar for the two other spacecraft. The degree of polarisation (panels 1 and 3 from top to bottom) is close to 1, meaning that there is at each fre-quency a unique plane wave. The analysis method is then valid for this event. Panels 2 and 4 give the angle between the principal axis of the polarisation of the magnetic com-ponents of the waves and the static magnetic field direction
B0. The direction is close to B0and the wave polarisation
is linear (not shown). The waves then propagate quasi
per-pendicularly to B0. As the waves are below the lower hybrid
frequency (300 Hz), this is consistent with previous observa-tions of the so called sub-lhr hiss (Russell et al., 1970) which has been shown with GEOS data to be magnetosonic waves at about the harmonics of the proton gyrofrequency (Perraut et al., 1982). The frequency resolution does not allow us to show the possible harmonic structure of the sub-lhr hiss. Cluster is around perigee and the spacecraft cross a given re-gion at different times, with a separation of about 700 km, as can be seen in Fig. 8. This figure gives the projections in the three GSE planes of the 4 spacecraft trajectories, from 03:25 UT to 03:34 UT. When no data is acquired, the trajec-tory is plotted in dotted lines, whereas the thickest lines rep-resent the time at which the signal is intense, i.e. above half maximum intensity. It is worth noticing that the waves are localised mainly in a narrow region just below the equator,
corresponding to 3◦of geomagnetic latitude, as determined
by the IGRF2000 model (Daly, 2002). Further studies will be devoted to the localisation of sources using the propagation characteristics of the waves from the 4 spacecraft.
Fig. 6. The low frequency (0.1–12 Hz) dynamic spectra for the same time interval as in Fig. 5 for the four spacecraft. For the presentation, see Fig. 3.
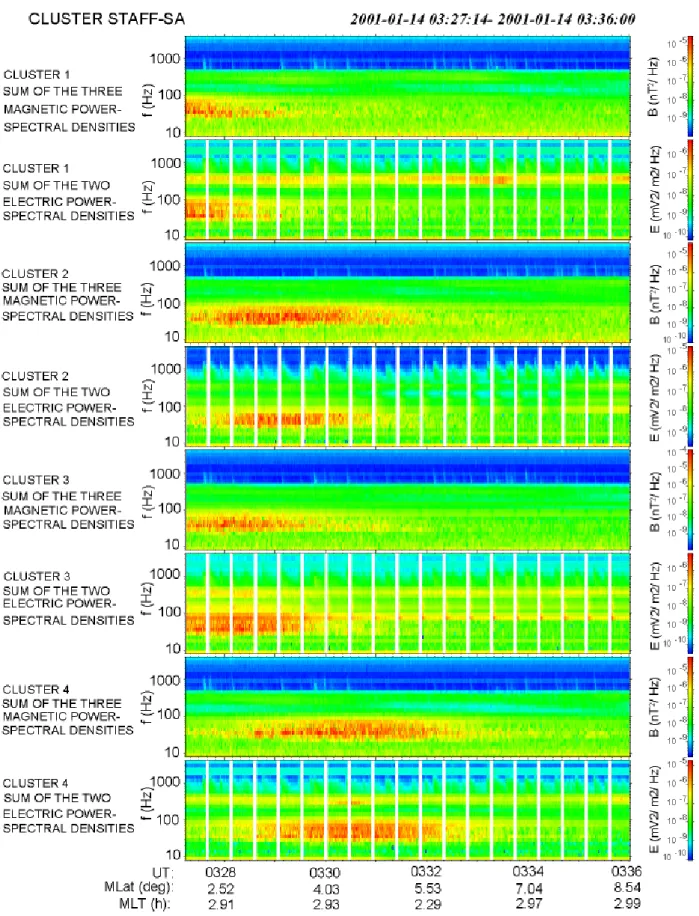
Fig. 7a. Spectrum Analyser dynamic spectra of total B- and E-power for the four spacecraft during a Cluster pass close to the perigee at 03 local time, and close to the magnetic equator. The magnetic latitude and the magnetic local time are given for spacecraft 3. The electromagnetic waves, identified as being sub-lhr hiss, are seen at different times by the four spacecraft, showing their strong localisation.
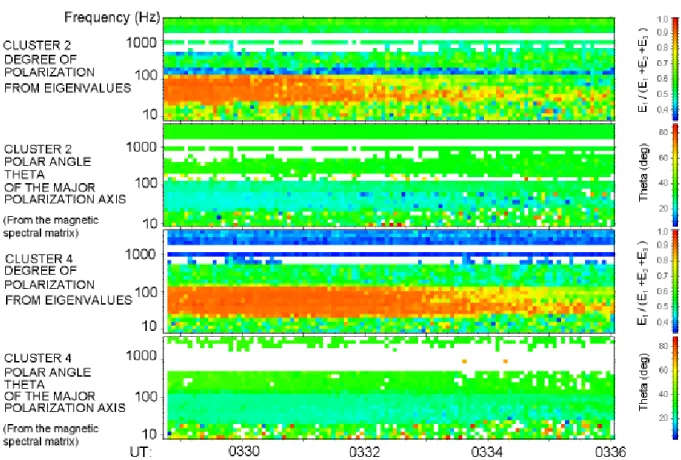
Fig. 7b. Results of the characterisation of the waves for two spacecraft (it is the same for the two others) for the event shown on Fig. 7a. Panels 1 and 3 from top to bottom give the degree of polarisation, whereas panels 2 and 4 give the angle between the principal axis of the
polarisation of the magnetic components of the waves and the main magnetic field which is about 10◦.
5 An example of bow shock crossing – Application of the reciprocal vector method to the normal direction and shock velocity determination
The wave signatures of two successive bow shock crossings by Cluster on 22 December 2000, during the interval 08:20– 08:40 UT, have been analysed in order to estimate the unit vector normal to the bow shock and the relative velocity of the bow shock with respect to Earth. Figure 9 which is simi-lar to Fig. 3d but ensimi-larged, shows this event.
The “low” frequency parts of the three STAFF waveforms for this interval of time have been obtained by applying a low pass Chebyshev filter of type II, i.e. with a flat pass-band, to the calibrated waveforms in the SR2 frame of each spacecraft. The SR2 reference system is linked to the space-craft: the Z-axis is the spin axis, X- and Y -axes have fixed directions in the spin plane, X being towards the Sun. The frequency response of the filter is defined by a cut-off
fre-quency equal to 0.5 Hz and a stop-band ripple equal to 10−4,
the high frequency parts being defined as the differences be-tween the original waveforms and the respective “low” fre-quency parts. The two upper frames of Fig. 10 display the “low” frequency parts of the waveforms of the magnetic components perpendicular to the spin axis for spacecraft 2
(red curves) and 3 (green curves): they include the DC mag-netic components perpendicular to the spin axes which are
parallel within less than 1◦. Horizontal axes are labelled by
the number of elapsed seconds since 08:20 UT and the verti-cal axes are labelled in nT. The bottom frame of the same fig-ure displays the magnetic energy of the high frequency parts of the three magnetic components, i.e. in the frequency range
0.5 to 12.5 Hz, and its vertical axis is labelled in nT2. Data
from the other two spacecraft have been similarly processed but are not overlaid to get clear plots. It is, of course, impos-sible to conclude from the sole STAFF waveform data that sudden variations around 200 and 1000 s corresponds to bow shock crossings; this is evidenced by the FGM experiment and it is worth mentioning that the FGM components per-pendicular to the spin axes of the four spacecraft closely fol-low the corresponding STAFF components. Figure 10 clearly demonstrates that bursts of magnetic energy at frequencies above 0.5 Hz are closely associated with the DC sudden vari-ations. Figure 11 illustrates the two sets of magnetic energy bursts observed by the four Cluster spacecraft around 200 and 1000 s after 08:20 UT. For each of these bursts we define (with some arbitrariness) the instants of crossing by consid-ering the interval of time during which the magnetic energy is greater than half its maximal value. A more subtle analysis
T i m e p e r i o d 0 3 : 2 5 : 0 0 - 0 3 : 3 4 : 5 4
SC 1
SC 2
SC 3
SC 4
14 / January / 2001
CLUSTER / GSE Positions
Fig. 8. Projection of the four Cluster trajectories in the 3 GSE planes. Dotted lines correspond to periods for which there was no wave data acquisition. Thick lines correspond to the periods where the amplitude of the waves is higher than half of the maximum amplitude. This
shows that the waves are confined to regions between −0.5 and −0.65 REin the Z-direction, at about 3◦of geomagnetic latitude.
is very likely worth undertaking by combining data analysis from different experiments in order to elucidate whether or not the fine structure of the different bursts could correspond or not to multiple partial crossings. Nevertheless the present analysis provides a hint about the mean orientation and mo-tion of the bow shock over the considered interval; it is based upon the hypothesis of a planar discontinuity in uniform mo-tion along its normal direcmo-tion (Chanteur, 1998; Dunlop and Woodward, 1998; Harvey, 1998, and references therein). It
is worth emphasizing that the assumption of uniform motion of the discontinuity is very crucial (Dunlop and Woodward, 1998) and that it should be validated by inspection of data from the other experiments, especially FGM and possibly the particle data when time delays between crossings are suffi-ciently large. The first analysis of this kind for characterising interplanetary shocks is due to Russell et al. (1983). Results presented in Fig. 12 have been obtained by making use of the reciprocal vectors (Chanteur, 1998); this method has the
Fig. 9. Low frequency dynamic spectra of the four Cluster for the 2 successive bow shock crossings around 08:30 on 22 December 2000. Same as Fig. 3d, enlarged. The difference in timing is quite clear.
Fig. 10. Details of the Fig. 9 event. The 2 top panels give the “low” frequency parts (f <0.5 Hz) of the waveforms of the magnetic components perpendicular to the spin axis for spacecraft 2 (red curves) and 3 (green curves): they include the DC magnetic components perpendicular to the spin axes. The bottom frame displays the magnetic energy of the high frequency part of the three magnetic components (i.e. in the
frequency range 0.5 to 12.5 Hz); its vertical axis is labelled in nT2. Horizontal axes are labelled by the number of elapsed seconds since
08:20 UT.
advantage of giving explicit formulas for the normal vector and the normal velocity of the discontinuity with respect to Earth. Moreover, the method also leads to explicit formulas for estimating the uncertainties affecting these estimations; a manuscript is in preparation which will present these new theoretical developments based on the statistical properties of the reciprocal vectors (Chanteur, 1998). Figure 12 shows
nominal results (Nx = −0.67, Ny = −0.70, Nz =0.25
and Vn =8.0 km s−1) together with projections of the
un-certainty cone centred on nominal values of the respective components of the normal vector N for the first bow shock crossing around 08:24 UT. Components of the normal vector are given in the GSE frame of reference; positive components are indicative of a sunward motion of the bow shock. All four
spacecraft have orbital velocities of the order of 1 km s−1
(differences between these velocities are less than 10 m s−1),
for example the orbital velocity of spacecraft 1 is in GSE
un-Fig. 11. Two sets of the magnetic energy of the high frequency part of the three magnetic components for the four spacecraft, in nT2as in the bottom panel of Fig. 10. Horizontal axes are labelled by the number of elapsed seconds since 08:20 UT.
certainty in the normal direction is in the X–Y plane with a
value of 0.15 which corresponds to about 9◦, the uncertainty
along the Z-direction is of the order of 6◦and the normal
velocity lies between 5 and 11 km s−1. It is worth noticing
that the shape of the Cluster tetrahedron and its relative ori-entation with respect to the crossed discontinuity give rise to an anisotropic cone of uncertainty. The second crossing around 08:36 UT leads to uncertainties that are twice as large.
Hence, in this framework, the uncertainties have two origins: the approximate knowledge of the spacecraft positions and the accuracy of the crossing times. Geometrical uncertain-ties are estimated from the covariance matrix of spacecraft positions provided by JSOC (Cluster Joint Science Opera-tions Centre); they are surprisingly small because, even in the vicinity of the apogee, the uncertainties on spacecraft po-sitions are of the order of 1 km. Hence the main source of
er-Fig. 12. GSE components of the nor-mal to the shock (first shock crossing on Fig. 9), projection of the error of deter-mination in the 3 GSE planes and the velocity of the shock along the normal. Results obtained by means of the recip-rocal vector method. The shock is going earthward.
ror lies in the difficulty of measuring the crossing times. It is apparent from Fig. 11 that magnetic energy bursts are much larger around 08:36 UT (panels on the right-side) than around 08:24 UT (panels on the left-side). For the second crossing,
around 08:36 UT the nominal results are (Nx =0.71, Ny =
0.66, Nz=0.26 and 5.0 < Vn<8.0 km s−1)which means a
sunward motion with respect to Cluster and to the Earth. For the time being we put the emphasis on the method of analy-sis and we have not tried to check whether or not this “mean” normal vector to the bow shock is compatible with models of the bow shock, nor have we compared it to local normals de-termined by standard shock analysis (Schwartz, 1998). Such detailed and geophysical analyses are left for future works.
6 Conclusions
The first results obtained by the STAFF experiment show its ability to fulfil the scientific objective of Cluster and of STAFF in particular. To achieve these objectives much more work has to be done both with the dedicated scientific data analysis programs and with comparison and combination of data coming from the other Cluster instruments. The full characterisation of the waves by means of the Field Energy Distribution function method (FED), for example, needs the use of the waveform of 5 or 6 components on the four space-craft (Pinc¸on and Lefeuvre, 1991). Then we need to combine STAFF and EFW waveform data, possibly complemented by
EDI data to get all three electric components. We have seen the ability of PRASSADCO to characterise the waves after the onboard treatment performed by the STAFF Spectrum Analyser (up to 4 kHz). In order to determine the location of the source of these waves, the addition of a ray-tracing pro-gram to PRASSADCO is in progress. The identification of the regions crossed by Cluster needs a combination of waves, DC magnetic field and particle measurements. For instance the shock normal and velocity determination presented in this paper with only STAFF data, has to be complemented by the use of DC magnetic field data. Generally speaking, to study the physical processes in the collisionless magnetospheric and solar wind plasmas encountered by Cluster one needs to compare waves and particles, knowing the characteristics of both the waves or turbulence, the particle distribution func-tions and the currents, etc. More detailed work has already been undertaken and is presented elsewhere (Rezeau et al., 2001; Maksimovic et al., 2001).
Acknowledgements. STAFF experiments have been realised thanks
to ESA and CNES grants. The data analysis is supported by a CNES grant. The ESA, Dornier, WEC and JSOC teams are thanked for strong and fruitful assistance in the integration, commissioning and operation phases. A. Meyer, B. de la Porte, J. M. Nappa, D. Al-ison, V. Bouzid, L. Casagrande (CETP), F. Wouters, R. Manning, N. Monge and P. Fedou (DESPA) have realised the hardware and the software of STAFF. Dr. A. Balogh is thanked for providing 4 s averaged magnetic field data. Both referees are thanked for their fruitful comments.
Topical Editor thanks D. Burgess and J. S. Pickett for their help in evaluating this paper.
References
Anderson, B. J., Fuselier, S. A., Gary, S. P., and Denton, R. E.: Magnetic Spectral Signatures in the Earth’s Magnetosheath and Plasma Depletion Layer, J. Geophys. Res., 99, 5877–5891, 1994. Anderson, R. R., Harvey, C. C., Hoppe, M. M., Tsurutani, B. T., Eastman, T. E., and Etcheto, J.: Plasma waves near the magne-topause, J. Geophys. Res., 87, 2087–2107, 1982.
Baumjohann, W., Treumann, R. A., Georgescu, E., Haerendel, G., Fornacon, K.-H., and Arister, V.: Waveform and packet structure of lion roars, Ann. Geophysicae, 17, 1528–1534, 1999. Belmont, G. and Chanteur, G.: Advances in magnetopause
Kelvin-Helmholtz instability studies, Physica Scripta, 40, 124–128, 1989.
Belmont, G. and Rezeau, L.: Magnetopause reconnection induced by magnetosheath Hall-MHD fluctuations, J. Geophys. Res., 106, 10 751–10 760, 2001.
Belmont, G., Rezeau, L., and Reberac, F.: Resonant amplification of magnetosheath MHD fluctuations at the magnetopause, Geo-phys. Res. Lett., 22, 295–298, 1995.
Bhattacharjee, A., Ma, Z. W., and Wang, X.: Impulsive reconnec-tion dynamics in collisionless laboratory and space plasmas, J. Geophys. Res., 104, 14 543–14 555, 1999.
Burgess, D.: Cyclic behaviour at quasi-parallel collisionless shocks, Geophys. Res. Lett., 16, 345, 1989.
Chanteur, G., in: Analysis Methods for Multi-Spacecraft Data, (Eds) Paschmann, G. and Daly, P. W., ISSI SR-001, chapter 14, 1998.
Cornilleau-Wehrlin, N., Chauveau, P., Louis, S., Meyer, A., Nappa, J. M., Perraut, S., Rezeau, L., Robert, P., Roux, A., de Villedary, C., de Conchy Y., Friel, L., Harvey, C. C., Hubert, D., Lacombe, C., Manning, R., Wouters, F., Lefeuvre, F., Parrot, M., Pinc¸on, J. L., Poirier, B., Kofman, W., and Louarn, Ph.: The CLUSTER Spatio-Temporal Analysis of Field Fluctuations (STAFF) Exper-iment, Space Sci. Rev., 79, 107–136, 1997.
Cornilleau-Wehrlin, N., Chanteur, G., Rezeau, L., Parrot, M., Pinc¸on J. L., and STAFF team, in: Proceedings of Cluster II workshop on Multiscale/Multipoint Plasma Measurements, Lon-don, 22–24 September 1999, ESA SP-449, 183—189, 2000. Daly, P. W.: Users Guide to the Cluster Science Data System,
DS-MPA-TN-0015, April 19, 2002. ftp://ftp.estec.esa.nl/pub/csds/ task for/users guide/csds guide.html
D´ecr´eau, P. M. E., Fergeau, P., Krasnosels’kikh, V., L´evˆeque, M., Martin, Ph., Randriamboarison, O., Sen´e, F. X., Trotignon, J. G., Canu, P., M¨ogensen, P. B., and Whisper experimenters: Whisper, a resonance sounder and wave analyser: performances and per-spectives for the Cluster mission, Space Sci. Rev., 79, 157–193, 1997.
De Keyser, J., Roth, M., Reberac, F., Rezeau, L., and Belmont, G.: Resonant amplification of MHD waves in realistic subso-lar magnetopause configurations, J. Geophys. Res., 104, 2399– 2409, 1999.
Dunlop, M. and Woodward, T. I., in: Analysis Methods for Multi-Spacecraft Data, (Eds) Paschmann, G. and Daly, P. W., ISSI SR-001, chapter 11, 1998.
Farrugia, C. J., Elphic, R. C., Southwood, D. J., and Cowley, S. W. H.: Field and flow perturbations outside the reconnection
field line region in flux transfer events: theory, Planet. Space. Sci., 35, 227–240, 1987.
Gurnett, D. A., Huff, R. L., and Kirchner, D. L.: The Wide-Band Plasma Wave Investigation, Space Sci. Rev., 79, 195–208, 1997. Gustafsson, G., Bostr¨om, R., Holback, B., Holmgren, G., Lundgren, A., Stasiewicz, K., Ahl´en, L., Mozer, F. S., Pankow, D., Harvey, P., Berg, P., Ulrich, R., Pedersen, A., Schmidt, R., Butler, A., Fransen, A. W. C., Klinge, D., Thomsen, M., F¨althammar, C. G., Lindqvist, P.-A., Christenson, S., Holtet, J., Lybekk, B., Sten, T. A., Tanskanen, P., Lappalainen, K., and Wygant, J.: The elec-tric field and wave experiment for the Cluster mission, Space Sci. Rev., 79, 137–156, 1997.
Harvey, C. C., in: Analysis Methods for Multi-Spacecraft Data, (Eds) Paschmann, G. and Daly, P. W., ISSI SR-001, chapter 12, 1998.
Krasnosselskikh, V. V., Lemb`ege, B., Savoini, P., and Lobzin, V. V.: Nonstationarity of strong collisionless quasiperpendicular shocks: Theory and full particle numerical simulations, Physics of Plasma, 9, 1192–1209, 2002.
Krauss-Varban, D., Pantellini, F. G. E., and Burgess, D.: Electron Dynamics and Whistler Waves at Quasi-perpendicular Shocks, Geophys. Res. Lett., 22, 2091–2094, 1995.
Le Contel, O., Perraut, S., Roux, A., and Pellat, R.: Plasma trans-port during substorm growth phase and relation to break up, Space Sci. Rev., 95, 415–426, 2001a.
Le Contel, O., Roux, A., Perraut, S., Pellat, R., Holter, O., Peder-sen, A., and Korth, A.: Possible control of the plasma transport in the near-Earth plasma sheet via current driven Alfv´en waves
(f∼fH+), J. Geophys. Res., 106, 10 817–10 827, 2001b.
Lefeuvre, F., Parrot, M., and Delannoy, C.: Wave Distribution Func-tions Estimation of VLF Electromagnetic Waves Observed on-board GEOS-1, J. Geophys. Res., 86, 2359–2375, 1981. Maksimovic, M., Harvey, C. C., Santolik, O., Lacombe, C.,
de Conchy, Y., Hubert, D., Pantellini, F., Cornilleau-Wehrlin, N., Dandouras, I., Lucek, E. A., and Balogh, A.: Polarisation and propagation of Lions Roars in the dusk side Magnetosheath, Ann. Geophysicae, 19, 1429–1438, 2001.
Opgenoorth, H. J., Lockwood, M., Alcayde, D., Donovan, E., Engebretson, M. J., van Eyken, A. P., Kauristie, K., Lester, M., Moen, J., Waterman, J., Alleyne, H., Andre, M., Dunlop, M. W., Cornilleau-Wehrlin, N., D´ecr´eau, P. M. E., Fazerkerley, A., Reme, H., Andre, R., Amm, O., Balogh, A., Behlke, R., Blelly, P. L., Boholm, H., Bor¨alv, E., Bosqued, J. M., Buchert, S., Candidi, M., Cerisier, J. C., Cully, Ch., Denig, W. F., Doe, R., Eglitis, P., Greenwald, R. A., Jackal, B., Kelly, J. D., Krauklis, Ian, Lu, G., Mann, I. R., Marcucci, M. F., McCrea, I. W., Mak-simovic, M., Massetti, S., Masson, A., Milling, D. K., Orsini, S., Pitout, F., Provan, G., Ruohoniemi, J. M., Samson, J. C., Schott, J. J., Sedgemore-Schulthess, F., Stamper, R., Stauning, P., Str¨omme, A., Taylor, M., Vaivads, A., Villain, J. P., Voronkov, I., Wild, J., and Wild, M.: Coordinated Ground-Based, Low Altitude Satellite and Cluster Observations on Global and Lo-cal SLo-cales During a Transient Postnoon Sector Excursion of the Magnetospheric Cusp, Ann. Geophysicae, 19, 1367–1398, 2001. Paschmann, G. and Daly, P. W. (Eds): Analysis Methods for
Multi-Spacecraft Data, ISSI SR-001, 1998.
Paschmann, G., Melzner, F., Frenzel, R., Vaith, H., Parigger, P., Pagel, U., Bauer, O. H., Haerendel, G., Baumjohann, W., Sck-opke, N., Torbert, R. B., Briggs, B., Chan, J., Lynch, K., Morey, K., Quinn, J. M., Simpson, D., Young, C., McIllwain, C. E., Fil-lius, W., Kerr, S. S., Mahieu, R., and Whipple, E. C.: The Elec-tron Drift Instrument for Cluster, Space Sci. Rev., 79, 233–269,
1997.
Pedersen, A., Cornilleau-Wehrlin, N., de la Porte, B., Roux, A., Bouabdellah, A., D´ecr´eau, P. M. E., Lefeuvre, F., Sen´e, F. X., Gurnett, D., Huff, R., Gustafsson, G., Holmgren, G., Woollis-croft, L. J. C., Thompson, J. A., and Davies, P. H. N.: The Wave Experiment Consortium (WEC), Space Sci. Rev., 79, 93–106, 1997.
Perraut, S., Gendrin, R., Robert, P., and Roux, A.: Magnetic pulsa-tions observed onboard GEOS 2 in the ULF range during mul-tiple magnetopause crossings, in Proceed. of Magnetospheric Boundary Layer Conference, Alpbach, June 1979, ESA/SP-148, 113–122, 1979.
Perraut, S., Roux, A., Robert, P., Gendrin, R., Sauvaud, J.-A., Bosqued, J.-M., Kremser, G., and Korth, A.: A systematic study of ULF waves above FH+ from GEOS 1 and 2 measurements and their relationships with proton ring distribution, J. Geophys. Res., 87, 6219–6236, 1982.
Pickett, J. S., Franz, J. R., Scudder, J. D., Menietti, J. D., Gurnett, D. A., Hospodarsky, G. B., Braunger, R. M., Kintner, P. M., and Kurth, W. S.: Plasma waves observed in the cusp turbulent layer: An analysis of high time resolution wave and particle measure-ments from the Polar spacecraft, J. Geophys. Res., 106, 19 081– 19 099, 2001.
Pinc¸on, J. L. and Lefeuvre, F.: Local characterization of homoge-neous turbulence in a space plasma from simultahomoge-neous measure-ments of field components at several points in space, J. Geophys. Res., 96, 1789–1802, 1991.
Pu, Z. Y. and Kivelson, M. G.: Kelvin-Helmholtz instability at the magnetopause: solution for compressible plasmas, J. Geophys. Res., 88, 841–852, 1983.
Rezeau, L., Morane, A., Perraut, S., Roux, A., and Schmidt, R.: Characterization of Alfvenic fluctuations in the magnetopause boundary layer, J. Geophys. Res., 94, 101–110, 1989.
Rezeau, L., Belmont, G., and Reberac, F.: Detection of local-ized structures from multispacecraft data: Adaptative correlation function, J. Geophys. Res., 103, 2319–2325, 1998.
Rezeau, L., Sahraoui, F., d’Humi`eres, E., Belmont, G., Cornilleau-Wehrlin, N., Mellul, L., Lucek, E., Robert, P., D´ecr´eau, P., and Canu, P.: A case study of low-frequency waves at the magne-topause, Ann. Geophysicae, 19, 1463–1470, 2001.
Russell, C. T. and Elphic, R. C.: ISEE observations of flux transfer events at the dayside magnetopause, Geophys. Res. Lett., 6, 33– 36, 1979.
Russell, C. T., Holzer, R. E., and Smith, E. J.: OGO 3 observations of ELF noise in the magnetosphere, 2 The nature of the equatorial noise, J. Geophys. Res., 75, 755–768, 1970.
Russell, C. T., Childers, D. D., and Coleman, Jr., P. J.: OGO-5 Observations of Upstream Waves in the Interplanetary Medium: Discrete Wave Packets, J. Geophys. Res., 76, 845–861, 1971.
Russell, C. T., Mellott, M. M., Smith, E. J., and King, J. H.: Multiple spacecraft observations of interplanetary shocks: Four spacecraft determination of shock normals, J. Geophys. Res., 88, 4739–4748, 1983.
Santolik, O.: Propagation Analysis of STAFF-SA Data with Co-herency Tests, LPCE/NTS/073.C, Lab. Phys. Chimie Envi-ron./CNRS, Orl´eans, France, 2001.
Santolik, O. and Parrot, M.: Propagation analysis of electromag-netic waves between the helium and proton gyro-frequencies in the low-altitude auroral zone, J. Geophys. Res., 103, 20 469– 20 480, 1998.
Santolik, O. and Parrot, M.: Case studies on wave propagation and polarization of ELF emissions observed by Freja around the local proton gyro-frequency, J. Geophys. Res., 104, 2459–2476, 1999. Santolik, O., Lefeuvre, F., Parrot, M., and Rauch, J. L.: Complete wave-vector directions of electromagnetic emissions: Applica-tions to INTERBALL-2 measurements in the night-side auroral zone, J. Geophys. Res., 106, 13 191–13 201, 2001.
Savin, S. P., Cordova, N. L., Budnik, E. Yu., et al.: Interball tail Probe measurements in outer cusp and boundary layer, in: Geospace Mass and energy Flow: Results from the International Solar-Terrestrial Physics Program, (Eds) Horwits, J. L., Gal-lagher, D. L., and Peterson, W. K., Geophysical Monograph 104, 25, American Geophysical Union, Washington, D.C., 1998. Schwartz, S. J., in: Analysis Methods for Multi-Spacecraft Data,
(Eds) Paschmann, G. and Daly, P. W., ISSI SR-001, chapter 10, 1998.
Sentman, D. D., Thomsen, M. F., Gary, S. P., Feldman, W. C., and Hoppe, M. M.: The Oblique Whistler Instability in the Earth’s Foreshock, J. Geophys. Res. 88, 2048–2055, 1983.
Smith, E. J. and Tsurutani, B. T.: Magnetosheath lion roars, J. Geo-phys. Res., 81, 2261–2266, 1976.
Sonnerup, B. U. ¨O.: Theory of low latitude boundary layer, J.
Geo-phys. Res., 85, 2017–2026, 1980.
Stasiewicz, K., Seyler, C. E., Mozer, F. S., Gustafsson, G., Pickett, J., and Popielawska, B.: Magnetic bubbles and kinetic Alfv´en waves in the high-latitude magnetopause boundary, J. Geophys. Res., 106, 29 503–29 514, 2001.
Tsurutani B. T., Brinca, A. L., Smith, E. J., Okida, R. T., Anderson, R. R., and Eastman, T. E.: A statistical study of ELF/VLF plasma waves at the magnetopause, J. Geophys. Res., 94, 1270–1280, 1989.
Woolliscroft, L. J. C., Alleyne, H. St. C., Dunford, C. M., Sumner, A., Thompson, J. A., Walker, S. N., Yearby, K. H., Buckley, A., Chapman, S., Gough, M. P., and the DWP Co-investigators: The digital wave processing experiment on Cluster, Space Sci. Rev., 79, 209–231, 1997.
Zhang, Y., Matsumoto, H., and Kojima, H.: Lion roars in the mag-netosheath: the Geotail observations, J. Geophys. Res., 103, 4615–4626, 1998.