This content has been downloaded from IOPscience. Please scroll down to see the full text.
Download details:
IP Address: 139.165.32.56
This content was downloaded on 19/05/2016 at 15:08
Please note that terms and conditions apply.
Volatile organic compounds discriminate between eosinophilic and neutrophilic inflammation
in vitro
View the table of contents for this issue, or go to the journal homepage for more 2016 J. Breath Res. 10 016006
(http://iopscience.iop.org/1752-7163/10/1/016006)
© 2016 IOP Publishing Ltd
Introduction
Asthma is a chronic inflammatory disease of the airways. There is increasing evidence that phenotyping asthma according to airway inflammation allows the identification of subgroups of patients that are more likely to respond to targeted therapy. The importance of these inflammatory phenotypes is that the underlying molecular mechanisms are different. While the eosinophilic phenotype is likely to reflect ongoing adaptive immunity in response to allergen with Th2
cytokine IL-4, IL-5 and IL-13 playing a key role, the neutrophilic is thought to reflect innate immune system activation in response to pollutants or infectious agents [1, 2]. Those phenotypes actually require different therapeutic treatments. Importantly, studies have confirmed that eosinophilic airway inflammation most reliably predicts the response to anti-inflammatory treatment such as inhaled corticosteroid [3, 4] and anti-IL5 [5, 6]. Studies have demonstrated the usefulness of induced sputum to guide asthma treatment [7, 8]. These studies showed that normalizing airway F N Schleich et al Printed in the UK 016006 JBROBW © 2016 IOP Publishing Ltd 2016 10 J. Breath Res. JBR 1752-7155 10.1088/1752-7155/10/1/016006 1
1
6
Journal of Breath Research
2
February
Volatile organic compounds discriminate between eosinophilic and
neutrophilic inflammation in vitro
Florence N Schleich1, Jan W Dallinga2, Monique Henket1, Emiel F M Wouters3, Renaud Louis1 and Frederik J Van Schooten2
1 Department of Pulmonary Medicine, CHU Sart-Tilman, Liege. GIGA I3 research Group. University of Liege, Belgium
2 Department of Pharmacology and Toxicology, School for Nutrition and Translational Research in Metabolism (NUTRIM), Maastricht
University, The Netherlands
3 Department of Pulmonary Medicine, Maastricht University Medical Center (MUMC+), The Netherlands
E-mail: [email protected]
Keywords: volatile organic compounds, neutrophils, eosinophils, GC-tof-MS
Abstract
Inflammation associated oxidative stress leads to peroxidation of polyunsaturated fatty acids thereby generating volatile organic compounds (VOCs). The integrative analysis of the total amount of VOCs released by eosinophils and neutrophils in vitro enables the search for those compounds that discriminates between various inflammatory conditions.
The approach comprises isolating eosinophils and neutrophils from 30 ml of blood of healthy non-smoking volunteers by gradient centrifugation, using lymphoprep. Eosinophils are separated from neutrophils by immunomagnetic cell separation using anti-CD16. Cells are activated with phorbol 12-myristate 13-acetate and VOCs from the headspace are collected at time 0′, 30′, 60′ and 90′ by introduction of ultra-pure nitrogen in the closed flasks at a flow rate of 200 ml min−1 during 10 min. The gases are trapped onto a sorption tube and analyzed by gas chromatography —time-of-flight—mass spectometry (GC-TOF-MS) in order to identify VOCs released in the headspace by activated neutrophils and eosinophils.
Eosinophils and neutrophils were isolated from 26 healthy non-smoking volunteers. The average absolute number of eosinophils and neutrophils upon isolation was 3.5 × 10⁶ and 19.4 × 10⁶, respectively. The volatome in headspace consisted of 2116 compounds and those compounds present in at least 8% of the samples (1123 compounds) were used for further discriminant analysis. Discriminant analysis showed that two VOCs were able to distinguish between eosinophilic and neutrophilic cultures in the unactivated state with 100% correct classification of the entire data set and upon cross validation while five VOCs were able to discriminate between activated eosinophils and neutrophils with 96% correct classification in the original set and upon cross-validation.
Analysis of VOCs seems to be a very promising approach in identifying eosinophilic and neutrophilic inflammation but it needs further development and in vivo confirmation.
PAPER
Original content from this work may be used under the terms of the Creative Commons Attribution 3.0 licence. Any further distribution of this work must maintain attribution to the author(s) and the title of the work, journal citation and DOI.
OPEN ACCESS
REcEivEd 5 November 2015 REvisEd 18 December 2015 AccEPtEd foR PublicAtion 29 December 2015 PublishEd 2 February 2016 doi:10.1088/1752-7155/10/1/016006 J. Breath Res. 10 (2016) 016006
F N Schleich et al
eosinophilic inflammation allowed better control of asthma with reduced exacerbations and hospital admissions. There is, however, no evidence that inhaled corticosteroids may improve asthma control in the absence of uncontrolled eosinophilic inflammation as encountered in pauci-granulocytic asthma [9] and data suggest that severe neutrophilic asthma could be best targeted by using clarithromycin [10, 11].
The technique of induced sputum that allows collection of airway cells is considered as the gold stand-ard to identify asthma inflammatory phenotypes [12]. It is, however, technically demanding and time consum-ing. Alternative biomarkers such as FENO have already been identified [13, 14] but thresholds predicting eosinophilic inflammation varies according to inhaled corticosteroids (ICS) and smoking habit. Inflamma-tion associated oxidative stress leads to peroxidaInflamma-tion of polyunsaturated fatty acids thereby generating volatile organic compounds (VOCs). VOC profiles have been shown to be able to discriminate between various pul-monary diseases conditions [15–17]. Analysis of VOCs derived from influxed eosinophils and neutrophils may offer the possibility of noninvasive monitoring of the associated type of inflammation. Therefore we meas-ured VOCs released by eosinophils and neutrophils
in vitro, either activated or non-activated and cultured
in closed flasks and then searched for VOC profiles that could discriminate between eosinophilic and neutro-philic inflammation. The integrative analysis of the total amount of volatiles released by eosinophils and neutrophils in vitro enables identification of com-pounds that should be further tested in vivo to discrimi-nate between inflammatory phenotypes in asthmatics and have therapeutic implications.
Methods
In vitro experiments
The approach used comprises freshly isolating eosinophils and neutrophils from 30 ml of blood of healthy non-smoking volunteers. Non atopic untreated blood donors having no respiratory symptoms were recruited from the University Hospital of Liege by advertisement. Eosinophils and neutrophils were isolated by gradient centrifugation, using lymphoprep (Axis-Shields, Oslo, Norway). Lymphocytes were removed and the remaining erythrocytes were lysed using cold (4 °C) lysis buffer (155 mM NH4Cl, 10 mM KHCO3 and 10 mM EDTA, pH 7.4). Polymorphonuclear leukocytes (PMNs) were then washed and resuspended in Hanks balanced salt solution (HBSS; Life technologies, Invitrogen, Breda, The Netherlands). Eosinophils were separated from neutrophils by immunomagnetic cell separation (MACS; Miltenyi Biotec; Bergisch Gladbach, Germany) using anti-CD16. Three million cells were incubated in an RPMI culture medium supplemented with 2% fetal calf serum (FCS) and cultivated under standard conditions in 75 cm2 closed culture flasks at 37 °C with a 5% CO2 atmosphere. Activation of cells
was realised with phorbol 12-myristate 13-acetate (100 ng ml−1, PMA, Sigma). The viability of the cells evaluated using trypan blue exclusion at the end of the incubation period (90 min) was 95% ± 4%. VOCs from the headspace were collected at time 0′, 30′ and 60′ by introduction of ultra-pure nitrogen (99.999% N2) in closed flasks at a flow rate of 200 ml min−1 during 10 min using a recently developed system [18]. To trap VOCs, the headspace was pushed out onto a stainless steel two-bed sorption tube, filled with carbograph 1TD/Carbopack X (Markes International Limited, Llantrisant, UK).
VOC analysis by GC-TOF-MS
The analytical procedure to measure VOCs by gas chromatography—time-of-flight—mass spectrometry (GC-TOF-MS) was described in detail earlier [19]. Analysis of the samples started with the release of the VOC trapped on the sorption tubes using thermal desorption by heating the tubes to 270 °C. The gaseous mixture of released compounds was then divided; 90% of the sample was recollected on a second identical sample tube and stored for an optional second analysis. 10% of the sample was loaded onto a cold (5 °C) sorption trap, from which it was injected onto the gas chromatography capillary column (RTX-5 ms, 30 m × 0.25 mm 5% diphenyl, 95% dimethylsiloxane capillary, film thickness 1 μm). VOC are separated by
GC (Thermo Fisher Scientific., Austin, Texas, USA) and subsequently detected by a time-of-flight mass spectrometer (TOF-MS) (Thermo Electron Tempus Plus time-of-flight mass spectrometer, ThermoFisher Scientific, Austin, Texas, USA). The temperature of the gas chromatograph was programmed as follows: 40 °C during 5 min, then raised with 10 °C/min until the final temperature of 270 °C, this temperature was maintained for 5 min. The mass spectrometer was set at a scan range of 35–350 amu and scan rate of 5 times/s. The complete analytical procedure, including sampling, storage and instrumental analysis, was tested for reproducibility [15].
Data-acquisition and mining
Analysis of the data output files from the GC-TOF-MS was performed in successive steps as previously described in detail [20, 21]. In summary, the first step was to perform peak detection and baseline corrections on all output files. Parts of the chromatograms that occurred at a retention index <0.15 and>2.8 were removed, because of unreliable data from these parts. Retention times were normalized by calculating retention indices, relative to toluene and lining up easily recognizable component peaks, to correct for chromatographic drifting. The remaining data were carefully transformed to excel files. Compounds detected in less than 8% of the samples were discarded [21]. All components represent chromatographic peaks and the components received the same number as the corresponding peak.
Component selection
To determine which compounds in the database were of interest regarding the classification of eosinophilic versus neutrophilic inflammation, we applied a stepwise discriminant analysis using SPSS (SPSS 19 for Windows, SPSS Inc. Chicago, IL, USA). The discriminant analyses were performed using a 20-fold cross-over approach. In this method, all but 5% of the chromatograms are used to construct the discriminant function, which is subsequently used to predict to which group the ones left out belong. This is repeated 20 times, until all samples have been classified once. The discriminant functions obtained in this way are based on many components and are optimal in terms of differentiation between subgroups, but are not necessary the best predictors for unknown samples, because of potential overfitting. Therefore, the number of VOCs is gradually diminished, one by one, until a low number of components remains with sufficient discriminating power. The reduction in components is accomplished by starting with the original large set of components from the first discriminant analysis and then repeating the analysis with the least informative component of the results left out.
The chemical identification of the VOCs was done by means of spectrum recognition using the The National Institute of Standards and Technology (NIST) library in combination with spectrum interpretation by an experienced mass-spectrometrist and identification based on retention times of compounds.
To estimate VOC abundance, chromatograms were normalized to total intensity of all peaks, so for every peak there is a relative abundance. Comparisons of VOC abundance between subgroups were performed with a Kruskal–Wallis test. The results were considered to be significant at the 5% critical level (p < 0.05).
This study was conducted with the approval of the ethics committee of CHU Liege (2005/181).
Results
Eosinophils and neutrophils were isolated from 26 healthy non-smoking volunteers. The average number of eosinophils and neutrophils upon isolation was 3.5 × 10⁶ and 19.4 × 10⁶, respectively. For both groups, 16 samples of 3 million cells were activated with PMA while 10 samples were not activated.
The resulting analysis of the headspace air demon-strated that the collected air was rich in a wide variety of VOC. For all samples, a total of 2116 compounds were found. Compounds detected in less than 8% of the samples were discarded resulting in a dataset of 1123 compounds.
For the discriminant analysis, seven groups were defined, as shown in table 1. As we anticipate that VOCs may be released from the sampling system and from medium and PMA, we used three additional con-trol groups to limit the risk that discriminant VOCs
originate from a non-cellular source. Results of the dis-criminant analyses are shown in table 2.
We looked at VOCs released after 30, 60 and 90 min of incubation. No significant differences between the results per time point were detected. We used samples collected after 60 min for further analysis. The discriminant analy-sis for unactivated eosinophils versus unactivated neu-trophils resulted in a discriminant function comprising 8 components that classified all samples correctly (100% sensitivity and 100% specificity). We gradually dimin-ished the number of components to build the model, and registered the sensitivity and specificity of the analyses as a function of the number of components involved. In this way, using three components (component 858, 854 and 843), a 100% correct classification was still obtained. With two components (peak 843 and 854) a 100% cor-rect classification was still achieved whereas one comp-onent (peak 843) gave 85% correct classification. Within this data set, validation was performed using 20-fold cross validation with 100% of correctly classified data in cross-validated set using 3 components, 100% using two components and 85% using one component. Both peak 843 and 854 displayed higher relative abundance in the unactivated neutrophilic when compared to unactivated eosinophilic culture (p < 0.01) and were not detected in the flasks not containing inflammatory cells (group 5, 6 and 7). Looking at the NIST library, we identified peak 843 as benzylalcohol and peak 854 as 3-methylfuran. VOC 858 was found in higher abundance in the unac-tivated eosinophilic culture as compared to unacunac-tivated neutrophils and was absent in flasks containing medium without cells.
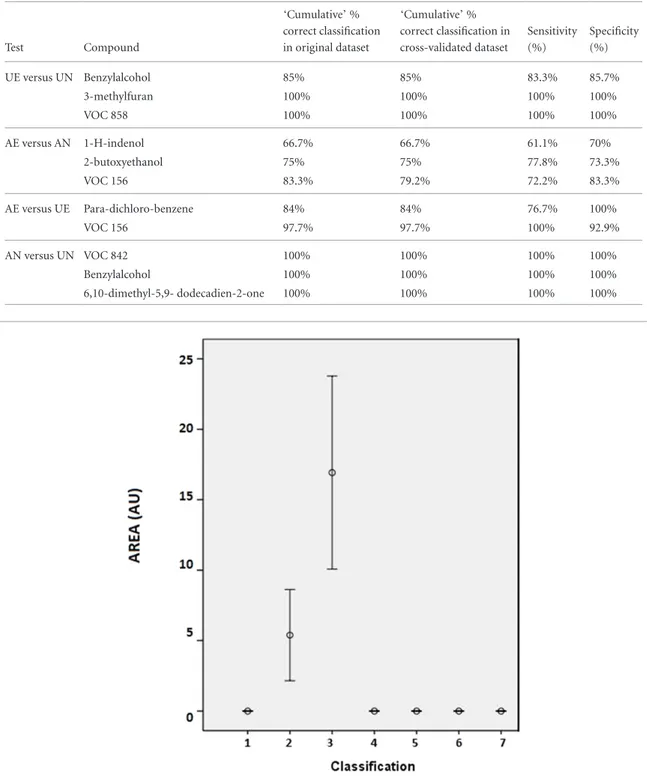
The same approach was used to discriminate between activated cell types. Five VOCs distinguish between activated eosinophils versus activated neu-trophils with 96% correct classification in original and cross-validated set. With three components (VOC 528, 486 and 156), we kept 83.3% correctly classified data in original dataset and 79.2% in cross-validated set. Chem-ical identification of peak 528 and 486 gave 1-H-inde-nol and 2-butoxyetha1-H-inde-nol. Peak 156 could not be identi-fied. 1-H-indenol and 2-butoxyethanol were found in higher amounts in the neutrophilic culture (p = 0.0029 (figure 1) and p = 0.012 respectively). Moreover, the relative abundance of those VOCs was higher in activated neutrophils as compared to unactivated neutrophils and both VOCs were not detected in the
Table 1. Description of the 7 groups.
Number
of flasks VOC source
Group 1 10 Unactivated eosinophils
Group 2 16 Activated eosinophils
Group 3 16 Activated neutrophils
Group 4 10 Unactivated neutrophils
Group 5 15 Medium
Group 6 15 Medium + PMA
F N Schleich et al
absence of inflammatory cells in the flask. Higher levels of VOC 156 were found in eosinophilic cultures, with the highest amount of this VOC in unactivated eosin-ophils (p = 0.0055). VOC 156 was not present in the headspace of flasks not containing inflammatory cells.
We also looked at VOCs released by activated versus unactivated eosinophils and activated versus unacti-vated neutrophils. Peak 254 was able to discriminate between activated and unactivated eosinophils and was found in higher concentration in the activated state (p <0.0001). This VOC was also found in lower amount
tion of this compound was para-dichloro-benzene. As VOC 634 was also detected in empty flask, this com-pound was considered not linked to inflammatory cells metabolism. VOC 156 was found in higher amounts in the unactivated cell cultures (p = 0.0001 respectively). Three peaks (peak 842, 839 and 784) were able to discriminate between activated versus unactivated neu-trophils with 100% accuracy. VOC 842, VOC 839 and VOC 784 were detected in higher amounts in unacti-vated neutrophils as compared to actiunacti-vated neutrophils (p < 0.0001). These VOCs were also found in lower
Table 2. Percentage of correct classification in the original and in cross-validated dataset.
Test Compound ‘Cumulative’ % correct classification in original dataset ‘Cumulative’ % correct classification in cross-validated dataset Sensitivity (%) Specificity (%) UE versus UN Benzylalcohol 85% 85% 83.3% 85.7% 3-methylfuran 100% 100% 100% 100% VOC 858 100% 100% 100% 100% AE versus AN 1-H-indenol 66.7% 66.7% 61.1% 70% 2-butoxyethanol 75% 75% 77.8% 73.3% VOC 156 83.3% 79.2% 72.2% 83.3% AE versus UE Para-dichloro-benzene 84% 84% 76.7% 100% VOC 156 97.7% 97.7% 100% 92.9% AN versus UN VOC 842 100% 100% 100% 100% Benzylalcohol 100% 100% 100% 100% 6,10-dimethyl-5,9- dodecadien-2-one 100% 100% 100% 100%
Figure 1. Example of error bars for 1-H-indenol showing the higher concentration of this VOC in the activated neutrophilic culture
(3) as compared to activated eosinophils (2), unactivated eosinophils (1), unactivated neutrophils (4), medium (5), medium and PMA (6), empty flask (7). Results are expressed as mean +/− SEM. Flasks from group 1, 2, 3 and 4 contained approximately 3 millions of cells.
phils but not detected in the absence of inflammatory cells. The chemical identification of these compounds was benzylalcohol (peak 839) and 6,10-dimethyl-5,9 dodecadien-2-one (peak 784). We were not able to identify the nature of peak 842.
Percentages are presented for the compounds clas-sified according to their importance. The percentages are cumulative so for the most important compound, % are presenting for the use of the sole compound 1 (first listed). For the second compound of the list, % are calculated for the use of both first and second com-pound. For third compound, the three compounds are used together for the prediction. Results are presented with sensitivity and specificity. Unactivated eosino-phils (UEs), unactivated neutroeosino-phils (UNs), activated eosinophils (AEs) and unactivated neutrophils (ANs).
Discussion
VOCs are carbon-based compounds that are volatile at ambient temperature and may result from endogenous biochemical pathways including inflammatory processes [22]. We were able to identify in vitro VOCs discriminating between eosinophil and neutrophil cultures, whatever the activation status. When taking into account three VOCs or even less to discriminate between both cellular types, we observed correct classification in the original set and upon cross-validation with a high accuracy.
A combination of two VOCs was able to discrimi-nate between unactivated eosinophils and neutrophils cell cultures. These VOCs were identified as benzylalco-hol and 3-methylfuran and seem to reflect neutrophilic inflammation. Benzylalcohol was previously identi-fied in vivo by Ibrahim et al [23] in a model predict-ing asthma and in this study, a higher concentration of this compound in the breath of asthmatic patients was found so this could be a good marker in asthmat-ics exhaled breath to discriminate between eosinophilic versus neutrophilic asthma phenotype. Rudnicka previously found significantly different concentrations of 3-methylfuran between healthy controls and patients with lung cancer [24]. It is interesting as it was previ-ously shown in the literature that patients with lung cancer exhibit higher levels of neutrophils in induced sputum [25]. Moreover, 3-methylfuran was also found in higher amounts in the breath of smoking and pas-sive smoking healthy volunteers [26], and smokers have been shown to exhibit higher bronchial neutrophilic inflammation. VOC 858 remained unidentified and seems to be a marker of eosinophils.
Concerning the activated cell cultures, 1-H-inde-nol and 2-butoxyetha1-H-inde-nol were found to be able to discriminate between eosinophils and neutrophils. 1-H-indenol and 2-butoxyethanol were found in higher amounts in the neutrophilic culture and the abundance of those VOC was higher in activated neutrophils as compared to unactivated neutrophils. This suggests that both VOCs could be products of the
neutrophilic metabolism while VOC156 seems to be a marker of eosinophils.
We also looked at activated versus unactivated eosinophils to try to identify markers released by acti-vated eosinophils. A potential source for generation of microbicidal superoxide is the NADPH oxidase found in neutrophils and eosinophils. Most of superoxide generated in vivo undergoes a nonenzymatic or SOD catalysed reaction resulting in its dismutation into hydrogen peroxide (H2O2). Once formed, the oxidiz-ing potential of H2O2 may be amplified by eosinophil peroxidase (EPO) and myeloperoxidase (MPO) that cat-alyze conversion of reduced oxygen species (superoxide) into the more reactive OH.. When activated, eosinophils release eosinophil peroxidase which is responsible for brominated or chlorinated agents production. Indeed, para-dichloro-benzene was found in higher concen-trations in activated than in unactivated eosinophil culture and thus showed to be a promising biomarker able to discriminate the activated from the unactivated state. The two VOCs able to discriminate between acti-vated and unactiacti-vated neutrophils with 100% accuracy were identified as Benzylalcohol and 6,10-dimethyl-5,9 dodecadien-2-one. It seems that both VOC are products of neutrophilic metabolism as they were not detected in unactivated neutrophilic culture.
The identification of VOCs related to eosinophilic and neutrophilic inflammation give the possibil-ity to develop a device such as eNose that could non- invasively and potentially quickly identify bronchial inflammation. This is important as eosinophilic inflam-mation is more reflect of allergens exposure while neu-trophils may reflect underlying infectious process. Patients presenting with respiratory symptoms in whom the clinician identify exhaled markers of eosino-philic inflammation could benefit from corticosteroids while those with markers of neutrophilic inflammation would be better improved with antibiotics.
In conclusion, analysis of VOCs seems very prom-ising in identifying eosinophilic and neutrophilic inflammation but needs further development and
in vivo confirmation.
Acknowledgments
This work was supported by a European Respiratory Society Short-Term Training Fellowship application 2011. Ref Number STRTF 80-2011.
References
[1] Anderson G P 2008 Endotyping asthma: new insights into key pathogenic mechanisms in a complex, heterogeneous disease
Lancet 3721107–19
[2] Douwes J, Gibson P, Pekkanen J and Pearce N 2002 Non-eosinophilic asthma: importance and possible mechanisms
Thorax 57643–8
[3] Green R H, Brightling C E, Woltmann G, Parker D, Wardlaw A J and Pavord I D 2002 Analysis of induced sputum in adults with asthma: identification of subgroup with isolated sputum neutrophilia and poor response to inhaled corticosteroids
F N Schleich et al [4] Pavord I D, Brightling C E, Woltmann G and Wardlaw A J 1999
Non-eosinophilic corticosteroid unresponsive asthma Lancet
3532213–4
[5] Haldar P et al 2009 Mepolizumab and exacerbations of refractory eosinophilic asthma N. Engl. J. Med.
360973–84
[6] Nair P et al 2002 Mepolizumab for prednisone-dependent asthma with sputum eosinophilia N. Engl. J. Med.
360985–93
[7] Green R H et al 2002 Asthma exacerbations and sputum eosinophil counts: a randomised controlled trial Lancet
3601715–21
[8] Jayaram L et al 2006 Determining asthma treatment by monitoring sputum cell counts: effect on exacerbations
Eur. Respir. J. 27483–94
[9] Haldar P and Pavord I D 2007 Noneosinophilic asthma: a distinct clinical and pathologic phenotype J. Allergy Clin.
Immunol. 1191043–52
[10] Brusselle G G et al 2013 Azithromycin for prevention of exacerbations in severe asthma (AZISAST): a multicentre randomised double-blind placebo-controlled trial Thorax
68322–9
[11] Simpson J L, Powell H, Boyle M J, Scott R J and Gibson P G 2008 Clarithromycin targets neutrophilic airway inflammation in refractory asthma Am. J. Respir. Crit. Care
Med. 177148–55
[12] Bakakos P, Schleich F, Alchanatis M and Louis R 2011 Induced sputum in asthma: from bench to bedside Curr. Med. Chem.
181415–22
[13] Berry M A, Shaw D E, Green R H, Brightling C E, Wardlaw A J and Pavord I D 2005 The use of exhaled nitric oxide concentration to identify eosinophilic airway inflammation: an observational study in adults with asthma Clin. Exp. Allergy
351175–9
[14] Schleich F N et al 2010 Exhaled nitric oxide thresholds associated with a sputum eosinophil count >/= 3% in a cohort of unselected patients with asthma Thorax
651039–44
[15] Dallinga J W et al 2010 Volatile organic compounds in exhaled breath as a diagnostic tool for asthma in children Clin. Exp.
Allergy 40 68–76
[16] Robroeks C M et al 2010 Metabolomics of volatile organic compounds in cystic fibrosis patients and controls Pediatr. Res.
6875–80
[17] van Berkel J J et al 2010 A profile of volatile organic compounds in breath discriminates COPD patients from controls Respir. Med. 104557–63
[18] Baranska A, Smolinska A, Boots A W, Dallinga J W and van Schooten F J 2015 Dynamic collection and analysis of volatile organic compounds from the headspace of cell cultures
J. Breath Res. 9047102
[19] Dallinga J W, Smolinska A and van Schooten F J 2014 Analysis of volatile organic compounds in exhaled breath by gas chromatography-mass spectrometry combined with chemometric analysis Methods Mol. Biol. 1198 251–63 [20] Smolinska A, Hauschild A C, Fijten R R, Dallinga J W,
Baumbach J and van Schooten F J 2014 Current breathomics--a review on data pre-processing techniques and machine learning in metabolomics breath analysis J Breath Res 8027105
[21] van Berkel J J et al 2008 Development of accurate classification method based on the analysis of volatile organic compounds from human exhaled air J. Chromatogr. B Analyt. Technol.
Biomed. Life Sci. 861101–7
[22] Boots A W, van Berkel J J, Dallinga J W, Smolinska A, Wouters E F and van Schooten F J 2012 The versatile use of exhaled volatile organic compounds in human health and disease J. Breath Res. 6027108
[23] Ibrahim B et al 2011 Non-invasive phenotyping using exhaled volatile organic compounds in asthma Thorax 66804–9
[24] Rudnicka J, Kowalkowski T, Ligor T and Buszewski B 2011 Determination of volatile organic compounds as biomarkers of lung cancer by SPME-GC-TOF/MS and chemometrics
J. Chromatogr. B Analyt. Technol. Biomed. Life Sci. 8793360–6
[25] Carpagnano G E, Palladino G P, Lacedonia D, Koutelou A, Orlando S and Foschino-Barbaro M P 2011 Neutrophilic airways inflammation in lung cancer: the role of exhaled LTB-4 and IL-8 BMC Cancer 11226
[26] Buszewski B, Ulanowska A, Ligor T, Denderz N and Amann A 2009 Analysis of exhaled breath from smokers, passive smokers and non-smokers by solid-phase microextraction gas chromatography/mass spectrometry Biomed. Chromatogr.
23551–6 J. Breath Res. 10 (2016) 016006