Detection of Explosives via Photolytic
Cleavage of Nitroesters and Nitramines
The MIT Faculty has made this article openly available. Please share
how this access benefits you. Your story matters.
Citation Andrew, Trisha L., and Timothy M. Swager. “Detection of Explosives via Photolytic Cleavage of Nitroesters and Nitramines.” The Journal of Organic Chemistry 76.9 (2011): 2976–2993.
As Published http://dx.doi.org/ 10.1021/jo200280c Publisher American Chemical Society (ACS)
Version Author's final manuscript
Citable link http://hdl.handle.net/1721.1/74230
Terms of Use Article is made available in accordance with the publisher's policy and may be subject to US copyright law. Please refer to the publisher's site for terms of use.
Detection of Explosives via Photolytic Cleavage of Nitroesters and Nitramines
Journal: The Journal of Organic Chemistry Manuscript ID: jo-2011-00280c.R1
Manuscript Type: Featured Article Date Submitted by the
Author: n/a
Complete List of Authors: Andrew, Trisha; Massachusetts Institute of Technology
Swager, Timothy; Mass. Inst. of Tech., Chemistry; Massachusetts Institute of Technology, Department of Chemistry 18-597
1
Detection of Explosives via Photolytic Cleavage of
Nitroesters and Nitramines
Trisha L. Andrew, Timothy M. Swager*
Department of Chemistry, Massachusetts Institute of Technology, 77 Massachusetts Avenue, Cambridge, MA 02139
tswager@mit.edu
RECEIVED DATE (to be automatically inserted)
ABSTRACT. The nitramine-containing explosive RDX and the nitroester-containing explosive PETN are shown to be susceptible to photofragmentation upon exposure to sunlight. Model compounds containing nitroester and nitramine moieties are also shown to fragment upon exposure to UV irradiation. The products of this photofragmentation are reactive, electrophilic NOx species, such as nitrous and nitric acid, nitric oxide, and nitrogen dioxide. N,N-Dimethylaniline is capable of being nitrated by the reactive, electrophilic NOx photofragmentation products of RDX and PETN. A series of 9,9-disubstituted 9,10-dihydroacridines (DHAs) are synthesized from either N-phenylanthranilic acid methyl ester or a diphenylamine derivative and are similarly shown to be rapidly nitrated by the photofragmentation products of RDX and PETN. A new (turn-on) emission signal at 550 nm is observed upon nitration of DHAs due to the generation of fluorescent donor-acceptor chromophores. Using fluorescence spectroscopy, the presence of ca. 1.2 ng of RDX and 320 pg of PETN can be detected by DHA indicators in the solid state upon exposure to sunlight. The nitration of aromatic amines by the photofragmentation products of RDX and PETN is presented as a unique, highly selective detection mechanism for nitroester- and nitramine-containing explosives and DHAs are presented as inexpensive
ACS Paragon Plus Environment
1 2 3 4 5 6 7 8 9 10 11 12 13 14 15 16 17 18 19 20 21 22 23 24 25 26 27 28 29 30 31 32 33 34 35 36 37 38 39 40 41 42 43 44 45 46 47 48 49 50 51 52 53 54 55 56 57 58 59 60
2 and impermanent fluorogenic indicators for the selective, standoff/remote identification of RDX and PETN.
Introduction
Detecting hidden explosive devices in war zones and transportation hubs is an important pursuit. The three most commonly used highly energetic compounds in explosive formulations are: 2,4,6-trinitrotoluene (TNT), 1,3,5-trinitrotriazinane (RDX), and pentaerythritol tetranitrate (PETN) (Figure 1). Numerous technologies are currently capable of detecting the energetic chemical components of explosive devices, including: analytical spot tests;1 fluorescent sensors using either small-molecule fluorophores2 or fluorescent conjugated polymers;3 chemiresistive sensors;4 portable mass spectrometers;5 and X-ray systems.6 Each example listed has unique advantages and limitations. For instance, while X-ray systems are capable of detecting bulk hidden explosive devices and portable mass spectrometers are capable of identifying the exact chemical structures of suspect chemicals, the practical deployment and/or longevity of these hardware-intensive technologies in complex environments is non-trivial.5 Fluorescent sensors are comparatively technology-unintensive, have desirably low detection limits, and are also capable of identifying (responding to) entire classes of molecules (such as nitroaromatics) or particular functional groups (vide infra).3 Chemical spot tests can be more specific than fluorescent sensors but are not as sensitive and do not have the analytical advantages of an emissive signal, such as remote line-of-sight (stand-off) detection or prospects for complex signal processing (i.e., fluorescence lifetimes, depolarization).
Figure 1. Structures of common high explosives.
We previously reported a turn-on fluorescence chemosensing scheme based on the photoreaction between a hydride donor and either RDX or PETN, wherein the nitramine or nitroester component was
ACS Paragon Plus Environment
1 2 3 4 5 6 7 8 9 10 11 12 13 14 15 16 17 18 19 20 21 22 23 24 25 26 27 28 29 30 31 32 33 34 35 36 37 38 39 40 41 42 43 44 45 46 47 48 49 50 51 52 53 54 55 56 57 58 59 60
3 photoreduced by 9,10-dihydroacridine (AcrH2, Figure 2) or its metalated analogues.7 The acridinium
products (AcrH+) of this photoreaction had a high fluorescence quantum yield and resulted in a significant fluorescence turn-on signal in the presence of RDX and PETN.
Figure 2. Structures of the hydride donor AcrH2, its oxidation product AcrH+, and the 9,9-disubstituted
9,10-dihydroacridines, DHAs, studied herein.
While studying this photoreaction, we became interested in the photochemical stability of nitramine and nitroester compounds under ultraviolet (UV) irradiation. Nitroesters and nitramines have been known to degrade under highly acidic or basic conditions and established spot tests for PETN and RDX detect these chemical degradation products as opposed to directly detecting intact PETN or RDX.1 The base-promoted digestion of nitroglycerin (NG) has also been studied and is thought to evolve a mixture of nitrate and nitrite anions, among other degradation products (Scheme 1A).8 Similarly, RDX is also known to decompose in basic media and produce nitrite ions (Scheme 1A).9 The Greiss test10 for nitrite ions can, therefore, be employed to confirm the evolution of nitrite upon base-promoted degradation of RDX and PETN. The chemistry behind the commercially-available Greiss test (Scheme 1B) involves the reaction of sulfanilamide (4) with nitrite to form diazonium salt 6, which then reacts with an arylamine (5) to form a brightly-colored azo dye (7).11 As seen in Scheme 1C, when nitrite test strips impregnated with the modified Greiss reagent were dipped into solutions of either RDX or PETN in 2:1 acetonitrile:1 M NaOH, a bright pink color evolved, indicating the presence of nitrite anions.
ACS Paragon Plus Environment
1 2 3 4 5 6 7 8 9 10 11 12 13 14 15 16 17 18 19 20 21 22 23 24 25 26 27 28 29 30 31 32 33 34 35 36 37 38 39 40 41 42 43 44 45 46 47 48 49 50 51 52 53 54 55 56 57 58 59 60
4 Scheme 1. (A) Degradation mechanisms of nitroesters and nitramines in basic media. (B) Active components and detection mechanism of the Zeller-Greiss test for nitrite ions. (C) Nitrite ion test on base-degraded RDX and PETN. Test strips were dipped into blank 2:1 MeCN: 1M NaOH (i), or 17 mg PETN (ii) or 10 mg RDX (iii) in 3 mL 2:1 MeCN: 1M NaOH. (D) Nitrite ion test on photolyzed RDX and PETN. Test strips were dipped into (i) 10 mg RDX or (ii) 15 mg PETN in 3 mL MeCN, or (iii) neat MeCN and irradiated at 254 nm for one minute. (E) Nitrite ion test on RDX and PETN exposed to sunlight. Test strips were dipped into (i) 10 mg RDX or (ii) 15 mg PETN in 3 mL MeCN, or (iii) neat MeCN and irradiated with polychromatic light from a solar simulator for 30 minutes. (F) Proposed photolytic cleavage pathway of nitroesters and nitramines and select photofragmentation products.
Interestingly, when the same nitrite test strips were dipped into base-free acetonitrile solutions of RDX or PETN, dried and irradiated (λ = 254 nm), formation of the pink azo dye was also observed (Scheme
1D), suggesting the evolution of nitrite ions upon the photolysis of RDX and PETN. Photolysis at 313 nm, 334 nm and 365 nm similarly resulted in a positive Greiss test; however, non-UV controls did not
ACS Paragon Plus Environment
1 2 3 4 5 6 7 8 9 10 11 12 13 14 15 16 17 18 19 20 21 22 23 24 25 26 27 28 29 30 31 32 33 34 35 36 37 38 39 40 41 42 43 44 45 46 47 48 49 50 51 52 53 54 55 56 57 58 59 60
5 yield a pink color. Moreover, extended exposure (30 minutes) to polychromatic light from a solar simulator was also observed to photolyze RDX and PETN and yield a positive Greiss test (Scheme 1E).
The photolysis of nitroester and nitramine-based energetic compounds under various conditions has been studied and found to produce a number of small-molecule degradation products, including nitrous and nitric acid, nitric oxide, nitrogen dioxide, formaldehyde and ammonia.12 The proposed photolytic degradation mechanisms for PETN and RDX are shown in Scheme 1F. In the case of PETN, it is hypothesized that heterolytic cleavage of the O-NO2 bond initially produces an alkoxide (8) and a highly reactive nitronium ion (9) that rapidly forms nitric acid under ambient conditions.13 For RDX, evidence of both the homolytic and heterolytic scission of the N-NO2 bond of RDX (to produce nitrogen dioxide (12) or nitrite, respectively) exists and the exact nature of the initial photoreaction is ambiguous.14,12d Nevertheless, it can be agreed that the proposed initial products of RDX and PETN photolysis are highly reactive, electrophilic NOx species, which can conceivably convert sulfanilamide 4 to the diazonium cation 6 necessary to produce a positive result in the Zeller-Greiss test.
Unfortunately, the Greiss test or variations thereof cannot meet the detection requirements for RDX and PETN. First, simple standoff detection (detection at a distance) with colorimetric spot tests is not a viable possibility because of the difficulty in getting a clear optical signal returned from a purely absorptive process. Moreover, even with optimized reagent systems, the detection limit of the Greiss test is in the microgram regime,15 which is not competitive with existing methods to detect RDX and PETN. Herein, we propose instead a sensing scheme that is uniquely selective to the photolytic cleavage of nitroester and nitramine compounds through the formation of nitroaromatic products that provide a new fluorescence signal. The pro-fluorescent, or fluorogenic, indicators described herein are capable of efficiently reacting with the photofragments of RDX and PETN and constitute a new, highly selective and sensitive detection scheme for these explosives.
ACS Paragon Plus Environment
1 2 3 4 5 6 7 8 9 10 11 12 13 14 15 16 17 18 19 20 21 22 23 24 25 26 27 28 29 30 31 32 33 34 35 36 37 38 39 40 41 42 43 44 45 46 47 48 49 50 51 52 53 54 55 56 57 58 59 60
6 Results and Discussion
Indicator Design. Considering the electrophilic nature of the NOx species generated by the photofragmentation of RDX and PETN and their resemblance to the active electrophiles in aromatic nitration reactions, we targeted reactions between electron-rich tertiary aromatic amines and the photofragments of RDX and PETN. It was found that photolysis (λ = 313 nm) of a mixture of
N,N-dimethylaniline (DMA) and 2 equivalents of either RDX or PETN for 10 minutes in acetonitrile under anaerobic conditions afforded the formation of N,N-dimethyl-4-nitroaniline (DMNA) in 14% yield (GC yield). Higher yields of DMNA were obtained with longer photolysis times and DMNA was formed in ca. 80% yield after 1 hour. The photoreaction between DMA and either RDX or PETN under anaerobic conditions was observed to produce only a single, yellow-colored product (DMNA) and other side products were not evident by TLC or GC-MS analyses. The 1H-NMR, IR and high-resolution mass spectra of the isolated yellow product exactly matched those obtained for an authentic commercial sample of DMNA. Conducting the photolysis under aerobic conditions resulted in partial demethylation of DMA16 and yielded a mixture of DMNA and its demethylated analog, N-methyl-4-nitroaniline (13) (see Scheme 2). Photolysis of DMA with ammonium nitrate was also found to produce DMNA, although longer photolysis times (>30 minutes) were required and greater amounts of demethylated side products were observed (most likely due to the presence of water or other nucleophiles in the solutions).
Scheme 2. Nitration of N,N-dimethylaniline with the photofragmentation products of RDX and PETN.
ACS Paragon Plus Environment
1 2 3 4 5 6 7 8 9 10 11 12 13 14 15 16 17 18 19 20 21 22 23 24 25 26 27 28 29 30 31 32 33 34 35 36 37 38 39 40 41 42 43 44 45 46 47 48 49 50 51 52 53 54 55 56 57 58 59 60
7 A distinct absorbance band centered at 400 nm was found to accompany the formation of the nitrated products under both aerobic and anaerobic conditions, which also matched the low-energy charge-transfer band displayed by commercial DMNA. However, DMNA has a very low fluorescence quantum yield17 and, therefore, a significant turn-on fluorescence signal is not generated upon reaction of DMA with the photofragmentation products of RDX and PETN.
To probe the scope of the photonitration reaction, we investigated whether 9,9-dioctylfluorene, anisole and 1,2-dimethoxybenzene could be nitrated by RDX and PETN. Extended photolysis (5 h) of a mixture of 9,9-dioctylfluorene and either RDX or PETN in 1:1 acetonitrile:THF at either 254, 313, 334, or 356 nm failed to generate any observable products and 9,9-dioctylfluorene was recovered in ca. 90% yield. Photolysis of anisole with RDX or PETN yielded only trace amounts of 4-nitroanisole (<1% GC yield) after 4 hours. Photolysis of 1,2-dimethoxybenzene with either RDX or PETN yielded 1,2-dimethoxy-4-nitrobenzene in only ca. 8% yield after 2 hours; moreover this reaction did not proceed cleanly and numerous polar photoproducts were observed. Therefore, we concluded that anilines were the best candidates for a potential indicator.
To create fluorogenic indicators based on the facile nitration reaction between aromatic amines and the photofragmentation products of RDX and PETN, 9,9-disubstituted 9,10-dihydroacridines (DHAs, Figure 2) were targeted as chemosensors. We hypothesized that, upon nitration, the comparatively rigid DHAs would generate donor-acceptor chromophores possessing high fluorescence quantum yields.18
Synthesis. As shown in Schemes 3-5, a series of 9,9-disubstituted DHAs were synthesized, starting from either N-phenylanthranilic acid methyl ester (Routes A and C) or a diphenylamine derivative19 (Route B). DHAs were accessed by an acid-catalyzed cyclization of a tertiary alcohol intermediate (for example, structure 16). In Route A (Scheme 3), intermediate 16 is accessed by a double 1,2-addition of an alkyl or aryl Grignard reagent to either N-phenylanthranilic acid methyl ester (14) or its N-methyl derivative (15); this strategy to synthesize DHAs has previously been reported.20 In Route B (Scheme 4), tertiary alcohol intermediates 19-21 are accessed from 1,2-addition of the aryl lithium species derived from 18 to an appropriate ketone. This strategy was adopted to synthesize unsymmetric DHAs
(DHA10-ACS Paragon Plus Environment
1 2 3 4 5 6 7 8 9 10 11 12 13 14 15 16 17 18 19 20 21 22 23 24 25 26 27 28 29 30 31 32 33 34 35 36 37 38 39 40 41 42 43 44 45 46 47 48 49 50 51 52 53 54 55 56 57 58 59 60
8 13) that have two different substituents at the 9-position, a spiro-DHA (DHA14), and a CF3-containing DHA (DHA15).
Scheme 3. Route A for the synthesis of 9,9-disubstituted 9,10-dihydroacridines.
Scheme 4. Route B for the synthesis of 9,9-disubstituted DHAs.
In all cases except one, adding a catalytic amount of concentrated sulfuric acid resulted in Friedel-Crafts reaction/cyclization of the respective tertiary alcohol intermediates to yield 9,9-disubstituted
ACS Paragon Plus Environment
1 2 3 4 5 6 7 8 9 10 11 12 13 14 15 16 17 18 19 20 21 22 23 24 25 26 27 28 29 30 31 32 33 34 35 36 37 38 39 40 41 42 43 44 45 46 47 48 49 50 51 52 53 54 55 56 57 58 59 60
9 DHAs. As shown in Scheme 3, we posit that this transformation proceeds via formation of a carbocation. The X-ray crystal structure of DHA8 thus obtained is shown in Figure 3. The cyclization of compound 21 was uniquely challenging, as neither the use of strong acids, Lewis acids, nor thionyl chloride yielded DHA15.21 However, it was found that refluxing a solution of 21 in POCl3 produced DHA15 in high yield.
Figure 3. X-ray crystal structure of DHA8.
Lastly, Route C was followed to synthesize N-aryl DHAs (Scheme 5). Copper-catalyzed N-arylation of 14 with 4-bromotoulene initially furnished 22, which was then reacted with 2.5 equivalents of methylmagnesium bromide and catalytic concentrated sulfuric acid. Unfortunately, the Friedel-Crafts cyclization of intermediate 23 yielded a nearly-statistical mixture of DHA16 and DHA17 (1:1.3 DHA16:DHA17), which could not be acceptably separated by either column chromatography or recrystallization. Therefore, compound 24 was synthesized by copper-catalyzed N-arylation of 14 with 2-bromomesitylene and subsequently reacted with methylmagnesium bromide and sulfuric acid to access DHA18.
ACS Paragon Plus Environment
1 2 3 4 5 6 7 8 9 10 11 12 13 14 15 16 17 18 19 20 21 22 23 24 25 26 27 28 29 30 31 32 33 34 35 36 37 38 39 40 41 42 43 44 45 46 47 48 49 50 51 52 53 54 55 56 57 58 59 60
10 Scheme 5. Route C for the synthesis of N-aryl DHAs.
Photophysics. The optical properties of DHA1-18 are summarized in the supporting information (Table S1). The DHAs reported herein displayed similar UV-vis absorption spectra, with absorption maxima around 290 nm. Additionally, DHA1-18 generally displayed a single emission band centered at ca. 350 nm and were found to have similar fluorescence quantum yields and excited-state lifetimes.
ACS Paragon Plus Environment
1 2 3 4 5 6 7 8 9 10 11 12 13 14 15 16 17 18 19 20 21 22 23 24 25 26 27 28 29 30 31 32 33 34 35 36 37 38 39 40 41 42 43 44 45 46 47 48 49 50 51 52 53 54 55 56 57 58 59 60
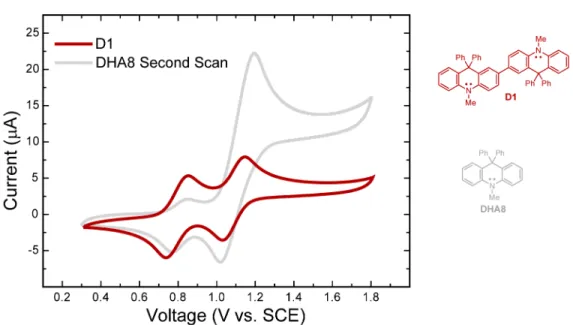
11 Figure 4. Cyclic voltammogram of DHA8 (Pt button electrode, 0.1 M TBAPF6 in CH2Cl2, 100 mV/s). The redox reactions giving rise to each anodic (A, B and C) and cathodic (D and E) peak are shown, and the first anodic peak potential (Epa) and onset potential (Eonset) for the first scan are labeled.
Electrochemistry. Cyclic voltammograms (CVs) of select DHAs were recorded in CH2Cl2 with tetrabutylammonium hexafluorophosphate (TBAPF6) as a supporting electrolyte and were found to reveal behavior suggestive of irreversible chemical transformations. The CV of DHA8 is shown in Figure 4 as a representative example. The first anodic sweep resulted in a single oxidation peak at ca. 1.20 V vs SCE, which can be ascribed to the formation of the radical cation of DHA8. However, the corresponding cathodic sweep revealed two cathodic peaks, arising from the reduction of two different species in solution. Furthermore, a subsequent anodic sweep displayed two oxidation peaks. Such behavior has been previously observed for triphenylamine (TPA),22 and is attributed to the rapid dimerization of TPA radical cations following oxidation; the electroactive TPA dimer thus formed leads
ACS Paragon Plus Environment
1 2 3 4 5 6 7 8 9 10 11 12 13 14 15 16 17 18 19 20 21 22 23 24 25 26 27 28 29 30 31 32 33 34 35 36 37 38 39 40 41 42 43 44 45 46 47 48 49 50 51 52 53 54 55 56 57 58 59 60
12 to the growth of an additional anodic and cathodic peak after an initial anodic sweep. Based upon assignments made for the CV of TPA,22 the redox reactions responsible for the individual anodic and cathodic peaks observed in the CV of DHA8 were identified and are shown in Figure 3.
The dimerization of radical cations of DHA8 in the electrochemical cell to form D1 was confirmed by independently synthesizing D1. Oxidation of DHA8 with FeCl3 or [Et3O+SbCl6-]23 afforded D1 in 30-40% yield (Scheme 6). This oxidation reaction was found to selectively yield the dimeric product (by TLC and crude 1H NMR analyses); moreover, we were able to recover the remaining, unreacted DHA8 upon reaction workup. The use of hydrogen peroxide and tert-butyl-hydrogen peroxide was also investigated; however, surprisingly, D1 was only formed in less than 5% yield with these reagents and DHA8 was recovered in ca. 90% yield after reaction workup. Attempts to affect an oxidative polymerization of DHA8 were not successful and only D1 was isolated. This observation can be explained by the fact that D1, once formed, can be oxidized to a stable, closed-shell dication (D12+, see
Figure 4) that cannot participate in subsequent radical coupling reactions to form polymers. Dimer D1 is a faint-yellow compound that displays an absorption band centered at 457 nm and an emission band centered at 478 nm (Φ 0.20). The CV of D1 (see Supporting Information, Figure S1) was found to match the second scan of the CV of DHA8 (see Figure 4), thus confirming the aforementioned assignments for the anodic and cathodic peaks observed in the CV of DHA8.
Scheme 6. Oxidative dimerization of DHA8 to form D1.
ACS Paragon Plus Environment
1 2 3 4 5 6 7 8 9 10 11 12 13 14 15 16 17 18 19 20 21 22 23 24 25 26 27 28 29 30 31 32 33 34 35 36 37 38 39 40 41 42 43 44 45 46 47 48 49 50 51 52 53 54 55 56 57 58 59 60
13 The electrochemical behavior of DHA8 was similar to that of the rest of the reported DHAs and also similar to the electrochemical behavior of DMA–i.e., the respective radical cations dimerized in the electrochemical cell after the first anodic sweep. The values for the first anodic peak potential (Epa) and onset potential (Eonset) for the first scan of the CVs of select DHAs, DMA and TPA are summarized in the supporting information (Table S2). In general, similar values of Epa and Eonset were observed for most DHAs; however, the electron-deficient, CF3-containing DHA15 was an outlier and displayed significantly higher Epa and Eonset values.
Reaction with RDX/PETN Photofragmentation Products. The photoreactions between DHA1-18 and either RDX or PETN were initially investigated in acetonitrile solutions. In general, irradiating solutions containing DHA1-18 and either RDX or PETN (which were initially colorless) at 313 nm under aerobic conditions lead to the evolution of a bright yellow/orange color after approximately 30 seconds to 5 minutes. Irradiating solutions of DHA1-18 in the absence of either RDX or PETN did not result in the same bright yellow/orange color, although faint yellowing of the DHA solutions was noticed after greatly extended exposure (> 60 minutes) to UV light under aerobic conditions.
The photolyses (λ = 313 nm) of select DHAs with a stoichiometric amount of either RDX or PETN were conducted on a preparative scale in order to isolate and characterize the reaction products formed. In these studies, long irradiation times (generally 60 minutes) were employed to ensure complete reactant conversion. TLC and GC-MS analyses of crude reaction mixtures indicated that only a single, highly-colored product was formed in all cases. The yellow-orange products from the reactions of DHA1, DHA4, and DHA18 with either RDX or PETN were isolated by flash column chromatography and identified to be the mono-nitrated structures (26, 28, and 30, respectively) shown in Scheme 7 by their 1H NMR, FT-IR and high resolution mass spectra (see Supporting Information). Compounds 26, 28 and 30 were isolated in 70-80% yield after column chromatography, along with ca. 10-15% of unreacted DHA1, DHA4, or DHA18. Similarly, DHA5 and DHA8 were confirmed to produce 27 and 29,
ACS Paragon Plus Environment
1 2 3 4 5 6 7 8 9 10 11 12 13 14 15 16 17 18 19 20 21 22 23 24 25 26 27 28 29 30 31 32 33 34 35 36 37 38 39 40 41 42 43 44 45 46 47 48 49 50 51 52 53 54 55 56 57 58 59 60
14 respectively, in approximately 70% yield (GC yield) upon photolysis with RDX or PETN (30 minutes). Additionally, DHA1 and DHA4 were independently nitrated under mild conditions using SiO2:HNO324 and the products thus obtained were found to match those isolated from the photoreactions of DHA1 and DHA4 with RDX/PETN.
Scheme 7. Photoreactions of various 9,10-dihydroacridines with RDX and PETN. The photoreduction of RDX/PETN by AcrH2 has been previously reported.7
The photoreaction of DHA2 with either RDX or PETN yielded the nitrated product 31; however, compound 33 was also isolated from the reaction mixture (Scheme 7). The yield of 33 was found to be somewhat dependent on the concentration of DHA2, with a higher amount of 33 over 31 observed in dilute solutions. The yield of 33 was also higher relative to that of 31 when the photolysis of DHA2 and RDX/PETN was conducted in slightly wet acetonitrile. Compounds 31 and 33 were generally isolated in 80% combined yield after flash column chromatography of the photoreactions between DHA2 and either RDX or PETN. Furthermore, DHA6 was confirmed to produce 32 and 34 (by GC-MS analysis) upon photolysis in the presence of RDX/PETN. We hypothesize that 33 and 34 are formed as a result of either H· or hydride abstraction reactions between DHA2 or DHA6 and the photodegradation products
ACS Paragon Plus Environment
1 2 3 4 5 6 7 8 9 10 11 12 13 14 15 16 17 18 19 20 21 22 23 24 25 26 27 28 29 30 31 32 33 34 35 36 37 38 39 40 41 42 43 44 45 46 47 48 49 50 51 52 53 54 55 56 57 58 59 60
15 of RDX and PETN. However, we are currently unsure as to the origins of the concentration dependence of the yield of 33.
GC-MS analyses of the photoreactions between the remaining DHAs (DHA3, DHA7, DHA9, DHA10-17) and either RDX or PETN similarly revealed the formation of mono-nitrated derivatives of the respective DHAs.
Figure 5. Structures of a model nitramine, N,N-diisopropylnitramine (NA), and a model nitroester, amylnitrate (AN).
Other Nitroesters and Nitramines. The photoreactions between DHA1-18 and either a model nitramine or nitroester compound—N,N-diisopropylnitramine (NA) and amyl nitrate (AN), respectively (Figure 5)—were also investigated. The reaction products observed upon photolysis (λ = 313 nm) of mixtures of DHA1-18 and either NA or AN were identical (as established by TLC and GC-MS analyses) to the aforementioned nitrated products observed with RDX and PETN. However, the observed yields (GC yields) of nitrated DHAs were significantly lower with NA/AN, as compared to RDX/PETN. For example, whereas 26 was formed in 75% yield upon photolysis with either RDX or PETN for 30 minutes, the photolysis of DHA1 with NA or AN afforded 26 in only 30% yield under identical reaction conditions. Therefore, it can be tentatively inferred that RDX and PETN are more susceptible to photolytic cleavage than their respective model compounds.
Differences in DHA Reaction Mechanisms. As shown in Scheme 7, it is interesting to note the difference in photochemical reaction mechanisms between various 9,10-dihydroacridines. As previously reported,7 N-methyl-9,10-dihydroacridine (AcrH2) participates in a hydride transfer reaction with either
ACS Paragon Plus Environment
1 2 3 4 5 6 7 8 9 10 11 12 13 14 15 16 17 18 19 20 21 22 23 24 25 26 27 28 29 30 31 32 33 34 35 36 37 38 39 40 41 42 43 44 45 46 47 48 49 50 51 52 53 54 55 56 57 58 59 60
16 RDX, PETN, NA or AN. Dialkylation or diarylation of the 9-position of AcrH2 effectively nullifies its
ability to donate a hydride ion and promotes the photonitration reaction detailed herein.
Light Sources. Importantly, precise timing and sophisticated, high-intensity light sources were not found to be necessary to effect the reaction between DHA1-18 and the degradation products of either RDX or PETN. Simply exposing a mixture of DHA1-18 and RDX/PETN to polychromatic light from a solar simulator effected the photolytic cleavage of RDX/PETN and subsequent formation of mono-nitrated DHAs. For example, compounds 26 and 28 could both be isolated in 75% yield (after flash column chromatography) after a mixture of RDX or PETN and DHA1 or DHA4, respectively, in acetonitrile were exposed to simulated sunlight for 45 minutes. The yields of compounds 26 and 28 thus obtained are similar to those reported earlier for photolysis at 313 nm.
Other NOx Sources. The (photo)reactions of DHA1-18 with sodium nitrite, potassium nitrate, and
NO were also investigated to judge the limitations of using DHA1-18 as stand-off indicators for RDX/PETN. Exposing a mixture of either DHA1, DHA5, DHA4 or DHA8 and excess sodium nitrite in 2:1 acetonitrile:water to simulated sunlight for 2 hours did not result in significant nitration of these DHAs (<1% GC yields of 26-29 were generally observed). However, upon addition of 100 µL acetic acid to the same reaction mixtures, compounds 26-29 were formed in approximately 8% yield in the
absence of light. Protonating nitrite salts generates nitrous acid, which is known to decompose and form
HNO3 (among other species), which most likely nitrated the DHAs in this case.
The addition of a large excess of monomeric NO gas to dry, oxygen-free solutions of the aforementioned DHAs failed to generate the characteristic yellow-orange color of 26-29; however, upon introduction of oxygen to these solutions, the nitrated DHAs were observed to be formed by eye (in the absence of light). Subsequent GC-MS analyses confirmed that 26-29 were formed in ca. 20% yield. Once again, NO is known to form nitrogen dioxide upon exposure to oxygen, which most likely resulted in nitration of the DHAs.
ACS Paragon Plus Environment
1 2 3 4 5 6 7 8 9 10 11 12 13 14 15 16 17 18 19 20 21 22 23 24 25 26 27 28 29 30 31 32 33 34 35 36 37 38 39 40 41 42 43 44 45 46 47 48 49 50 51 52 53 54 55 56 57 58 59 60
17 Mixtures of DHA1, DHA5, DHA4 or DHA8 and a large excess of potassium nitrate in 2:1 acetonitrile:water did not immediately result in nitration. If left standing for 24 h, 26-29, along with multiply-nitrated derivatives of the aforementioned DHAs, were formed in less than 5% combined yield (GC yield). Adding acetic acid to DHA/KNO3 mixtures resulted in the formation of multiply nitrated DHAs, with 2,7-dinitro DHAs being the major products. Exposing mixtures of either DHA1, DHA5, DHA4 or DHA8 and a large excess of potassium nitrate in 2:1 acetonitrile:water to simulated sunlight for 60 minutes similarly yielded multiply-nitrated derivatives of these DHAs in approximately 20% combined yield. Stoichiometric or sub-stoichiometric amounts of potassium nitrate, or shorter irradiation times failed to generate observable quantities of nitrated DHAs.
Optical Properties of Nitrated DHAs. The photophysical properties of select nitrated DHAs, which were either isolated from the photolysis reactions between DHAs and RDX/PETN or synthesized by nitrating an appropriate DHA, are listed in Table 1. In general, the nitrated DHAs displayed similar absorbance bands as DMNA, with the lowest energy bands centered at ca. 400 nm. Additionally, emission bands centered at ca. 540 nm were observed for all isolated mono-nitrated DHAs. The fluorescence quantum yields of the compounds listed in Table 1 were found to be solvent dependent, with the lowest quantum yields observed in acetonitrile.25 Moreover, compounds 26, 28, 30 and 31 were found to display significant emission in the solid state (in cellulose acetate films containing 10 wt% of the appropriate compound).
Table 1. Optical properties of select mono-nitrated DHAs.
cmpd λmaxa λema Φ
ACS Paragon Plus Environment
1 2 3 4 5 6 7 8 9 10 11 12 13 14 15 16 17 18 19 20 21 22 23 24 25 26 27 28 29 30 31 32 33 34 35 36 37 38 39 40 41 42 43 44 45 46 47 48 49 50 51 52 53 54 55 56 57 58 59 60
18 (log ε) DMNA 395 (3.9) 530 <0.01 (MeCN)b 0.09 (CHCl3)b 0.17 (film)c,d 26 408 (4.1) 535 0.09 (MeCN)b 0.27 (CHCl3)b 0.35 (film)c,d 28 410 (4.1) 540 0.10 (MeCN)b 0.30 (CHCl3)b 0.42 (film)c,d 30 413 (4.2) 548 0.14 (MeCN)b 0.37 (CHCl3)b 0.45 (film)c,d 31 409 (4.1) 539 0.05 (MeCN)b 0.22 (CHCl3)b 0.33 (film)c,d
a in MeCN b Measured against perylene in EtOH (Φ 0.94) c 10 wt% in cellulose acetate d Measured against 10 wt% perylene in PMMA (Φ 0.78)
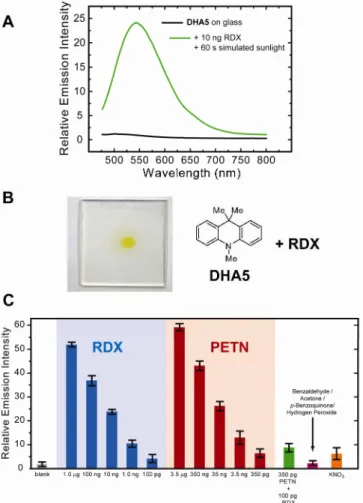
Optical Characterization of Indicator Response. The absorption and emission profiles for the reaction between DHA5 and RDX under aerobic conditions are shown in Figure 6. An absorption band centered at ca. 408 nm was observed to evolve when DHA5 is photolyzed (λ 313 nm) with RDX, which corresponds to the formation of 27. An emission band at approximately 540 nm concomitantly evolved, which can be assigned to emission from 27 based on the emission profile recorded for its N-H analog 26. A ca. 27-fold increase in the emission intensity at 540 nm was generated after 2 minutes of UV irradiation. Exactly similar absorption and emission profiles were obtained for the photoreaction between DHA5 and PETN. Moreover, the presence or absence of oxygen did not noticeably change the observed optical response.
ACS Paragon Plus Environment
1 2 3 4 5 6 7 8 9 10 11 12 13 14 15 16 17 18 19 20 21 22 23 24 25 26 27 28 29 30 31 32 33 34 35 36 37 38 39 40 41 42 43 44 45 46 47 48 49 50 51 52 53 54 55 56 57 58 59 60
19 Figure 6. Absorption (A) and emission (B, λex = 415 nm) profiles of the photoreaction of DHA5 with RDX in acetonitrile upon irradiation at 313 nm. [DHA5] = 1.3×10⁻⁴ M. [RDX] = 5.4×10⁻⁵ M. Identical profiles are observed for the photoreactions of DHA5 with PETN. The presence or absence of oxygen similarly does not affect the observed absorption and emission profiles. The absorption profile for the extended irradiation of a blank, aerated solution of DHA5 is also shown (C).
Photolysis of DHA5 under aerobic conditions in the absence of RDX/PETN failed to generate a distinct absorbance band at 408 nm. Surprisingly, electron-rich DHA5 was found to be relatively photostable: 30 minutes of continuous UV irradiation did not result in a noticeable change in the absorption spectrum of DHA5 (Figure 6C), and its emission peak at 355 nm was found to be bleached by only 10%. Further UV irradiation eventually lead to slight yellowing of DHA5 solutions, and poorly-defined absorbance peaks at 356 nm and ca 440 nm appeared in the absorption spectrum after 2 hours of continuous UV irradiation under air (Figure 6C). These new absorption peaks most likely correspond to the formation of radical cations, N-demethylated species, and/or N-oxide derivatives of DHA5. Notably, though, a significant portion of this photolyzed DHA5 solution remained unoxidized after 2 hours, and, therefore, the subsequent addition of RDX or PETN nonetheless lead to evolution of a 408 absorbance peak and 540 nm emission peak (5-fold emission turn-on) after a 20 second exposure to 313 nm light.
ACS Paragon Plus Environment
1 2 3 4 5 6 7 8 9 10 11 12 13 14 15 16 17 18 19 20 21 22 23 24 25 26 27 28 29 30 31 32 33 34 35 36 37 38 39 40 41 42 43 44 45 46 47 48 49 50 51 52 53 54 55 56 57 58 59 60
20 As seen in Figure 7, exposing a mixture of DHA5 and RDX to broad-band light from a solar simulator lead to the evolution of the same 408 nm peak observed with irradiation at 313 nm. The rate of formation of the 408 nm peak upon exposure to simulated sunlight also matched that observed upon exposure to monochromatic 313 nm light from a xenon arc lamp (Figure 7B). Therefore, simulated sunlight was preferentially used as the light source in subsequent studies to prove that the DHAs can function as technology-unintensive, fluorogenic indicators for RDX/PETN under ambient sunlight.
Figure 7. (A) Absorption profile of the photoreaction of DHA5 and RDX in acetonitrile upon exposure to broad-band light from a solar simulator. [DHA5] = 1.3×10⁻⁴ M. [RDX] = 5.4×10⁻⁵ M. (B) The rate of formation of the 408 nm absorbance peak in the presence of RDX upon exposure to either simulated sunlight (120 mW/cm2) or monochromatic 313 nm light (10 mW/cm2).
DHA6 behaved similar to DHA5 in terms of its optical response (the absorption and emission profiles for the reaction between DHA6 and PETN upon exposure to simulated sunlight are shown in the supporting information, Figure S2). Specifically, an absorbance peak at 409 nm evolved in the presence of either RDX or PETN, accompanied with evolution of an emission band at 540 nm. The presence or absence of oxygen did not affect the observed optical response to RDX/PETN. DHA6 was also found to be relatively photostable, with no change in its absorption spectrum and a 5% bleaching of its emission band at 382 nm observed after 30 minutes of continuous exposure to sunlight. The only significant difference between DHA5 and DHA6 was the rate of formation of the 409 nm /540 nm absorption/emission peaks. DHA5 was found to yield a turn-on signal approximately three times faster than DHA6. We hypothesize that this comparatively slow response is because DHA6 forms a mixture of 32 and 34 upon reacting with RDX/PETN (see Scheme 7).
ACS Paragon Plus Environment
1 2 3 4 5 6 7 8 9 10 11 12 13 14 15 16 17 18 19 20 21 22 23 24 25 26 27 28 29 30 31 32 33 34 35 36 37 38 39 40 41 42 43 44 45 46 47 48 49 50 51 52 53 54 55 56 57 58 59 60
21 The optical response of DHA18 to either RDX or PETN was also similar to that of DHA5 (see supporting information, Figure S3). An absorbance band at 413 nm and an emission peak at 550 nm evolved upon exposure to simulated sunlight in the presence of either RDX or PETN. DHA18 was also relatively photostable, with no change in its absorption spectrum and a 5% bleach of its emission band at 371 nm observed after continuous exposure to simulated sunlight for 30 minutes. The rate of photoreaction of DHA18 with RDX/PETN was slower than that of DHA5 but faster than that of DHA6.
9,9-Diphenyl-substituted DHA8 differed slightly from the other DHAs explored in this work, as an absorbance band centered at 470 nm, as opposed to ca. 410 nm, evolved during its photoreaction with either RDX or PETN (Figure 8). Based on accompanying GC-MS analyses, this absorbance band could be assigned to the formation of 29. An emission band at 550 nm was also observed to evolve concomitantly. An approximately 25-fold increase in the emission intensity at 550 nm was generated in the presence of either RDX or PETN upon exposure to simulated sunlight for 40 seconds. The rates of reaction of DHA5 and DHA8 with RDX/PETN were approximately similar.
ACS Paragon Plus Environment
1 2 3 4 5 6 7 8 9 10 11 12 13 14 15 16 17 18 19 20 21 22 23 24 25 26 27 28 29 30 31 32 33 34 35 36 37 38 39 40 41 42 43 44 45 46 47 48 49 50 51 52 53 54 55 56 57 58 59 60
22 Figure 8. Absorption (A) and emission (B, λex = 470 nm) profiles of the photoreaction of DHA8 with RDX in acetonitrile upon exposure to simulated sunlight. [DHA8] = 1.3×10⁻⁴ M. [RDX] = 5.4×10⁻⁵ M. The dashed green line depicts the emission spectrum obtained for a blank solution of DHA8 after irradiation under either aerobic or anaerobic conditions for 60 minutes. The absorption profile for the irradiation of a blank, aerated solution of DHA8 is also shown (C); the same profile is also obtained for oxygen-free solutions of DHA8.
Unlike DHA5, DHA6 and DHA18, exposing solutions of DHA8 to sunlight (or monochromatic UV light) in either the presence or absence of oxygen lead to the formation of a distinct absorbance band at 380 nm, with an accompanying emission band centered at 478 nm. The same photoreactivity was also observed for other DHAs that contained at least one phenyl substituent in the 9-position (DHA4, DHA11 and DHA13). Since these absorption/emission bands were observed to evolve even in the absence of oxygen, they are most likely not generated by simple photooxidation products of DHA8. Moreover, the evolution of the absorbance band at 380 nm cannot be ascribed to a photodimerization event, as the product of such a reaction, D1 (Scheme 6), has an absorption maximum of 457 nm. We are currently unsure as to the origin of the photoproduct responsible for the 380 nm/478 nm absorption/emission peak but suspect that a photocyclization reaction occurs in DHAs with at least one phenyl substituent in the 9-position. Nevertheless, for the purposes of this work, it can be seen in Figure 8 that the competing photoreaction in blank solutions of DHA8 (dashed green line) is slower than the photonitration of DHA8 in the presence of RDX/PETN and an emission peak at 550 nm is cleanly generated by these explosives in under 10 seconds.
Reaction Kinetics. The most significant difference between the DHAs reported in this work involved the rate of formation of the nitrated photoproducts upon reaction with RDX or PETN. By following the evolution of the characteristic low-energy charge transfer band (centered at ca. 400 nm) of the nitrated
ACS Paragon Plus Environment
1 2 3 4 5 6 7 8 9 10 11 12 13 14 15 16 17 18 19 20 21 22 23 24 25 26 27 28 29 30 31 32 33 34 35 36 37 38 39 40 41 42 43 44 45 46 47 48 49 50 51 52 53 54 55 56 57 58 59 60
23 DHAs with irradiation time, we were able to identify differences in the reactivities of DHA1-18 (Figures 9 and 10). As can be seen in Figure 9, the substituents at the 9-position of DHAs significantly affected their reactivities. DHAs with at least one methyl or phenyl substituent at the 9-position were rapidly nitrated in the presence of RDX or PETN. DHAs with alkyl (other than methyl) substituents at the 9-position displayed relatively slower rates of nitration, with isopropyl substituents leading to the slowest reaction rates. Replacing the 9-methyl substituents with trifluoromethyl moieties also retarded the reaction rate. Nominally faster reaction rates were generally observed with PETN over RDX for all DHAs. 9,9-Dioctylfluorene was used as a negative control for these studies and, in all cases, the DHAs reported in this work yielded a significant absorption signal at 400 nm over background.
The nature of the N-substituent was also found to affect the rate of photonitration in the presence of RDX/PETN. As seen in Figure 10, for DHAs with ethyl or isopropyl substituents at the 9-position, the
N-H analogues reacted faster the N-Me analogues. For DHAs with phenyl or methyl substituents in the
9-position, this trend was reversed and N-Me analogues displayed the fastest reaction rates. Moreover,
N-arylation was found to significantly retard the rate of photonitration.
ACS Paragon Plus Environment
1 2 3 4 5 6 7 8 9 10 11 12 13 14 15 16 17 18 19 20 21 22 23 24 25 26 27 28 29 30 31 32 33 34 35 36 37 38 39 40 41 42 43 44 45 46 47 48 49 50 51 52 53 54 55 56 57 58 59 60
24 Figure 9. The effect of the substituents at the 9-position of DHAs on their photoreactions with RDX and PETN. Shown are the rates of evolution of the absorbance peak at 410 nm (470 nm for DHA8) for the photoreactions between DHA5-15 and (A) RDX or (B) PETN. DOF is 9,9-dioctylfluorene, which was used as a negative control.
ACS Paragon Plus Environment
1 2 3 4 5 6 7 8 9 10 11 12 13 14 15 16 17 18 19 20 21 22 23 24 25 26 27 28 29 30 31 32 33 34 35 36 37 38 39 40 41 42 43 44 45 46 47 48 49 50 51 52 53 54 55 56 57 58 59 60
25 Figure 10. The effect of the N-substituent of DHAs on their photoreactions with RDX. Shown are the rates of evolution of the absorbance peak at 410 nm (470 nm for DHA8) for the photoreactions between various DHAs and RDX.
Lastly, the rate of formation of nitrated DHAs was compared to the formation of DMNA from DMA. As seen in Figure 11, the reactivity of DHA5, which displayed the fastest rate of nitration among DHA1-18, is comparable to that of DMA.
ACS Paragon Plus Environment
1 2 3 4 5 6 7 8 9 10 11 12 13 14 15 16 17 18 19 20 21 22 23 24 25 26 27 28 29 30 31 32 33 34 35 36 37 38 39 40 41 42 43 44 45 46 47 48 49 50 51 52 53 54 55 56 57 58 59 60
26 Figure 11. Comparison of the rates of nitration of DHA5 vs DMA in the presence of (A) RDX or (B) PETN.
Solid State RDX/PETN Detection. Based on the previously-detailed rates of nitration of DHA1-18 by the photofragmentation products of RDX and PETN, we initially chose to focus on DHA5, DHA8, DHA11 and DHA13 as potential indicators for RDX and PETN, as they displayed the fastest rates of reaction. Between these four DHAs, DHA5 and DHA8 were favored because their nitrated products displayed high fluorescence quantum yields. We chose to use DHA5 to demonstrate detection of RDX/PETN in the solid state; however, similar results and detection limits were also obtained with DHA8.
In order to evaluate the utility of DHA5 as a fluorescent indicator for RDX and PETN, the solid-state response of DHA5 to RDX and PETN was investigated. For this study, glass slides coated with DHA5
ACS Paragon Plus Environment
1 2 3 4 5 6 7 8 9 10 11 12 13 14 15 16 17 18 19 20 21 22 23 24 25 26 27 28 29 30 31 32 33 34 35 36 37 38 39 40 41 42 43 44 45 46 47 48 49 50 51 52 53 54 55 56 57 58 59 60
27 were prepared by dipcoating into 8×10⁻³ M solutions of the indicator in acetonitrile and air drying. RDX and PETN solutions of varying concentration were spotted onto the surface and the slides then irradiated with a solar simulator for no longer than 120 seconds.
Figure 12. (A) Emission profile (λex 420 nm) of a glass slide coated with DHA5 (black line) and the same slide after spotting with ca. 10 ng of RDX and irradiating with a solar simulator for 60 seconds (green line). (B) Picture of a glass slide coated with DHA5, spotted with ca. 10 ng RDX and exposed to simulated sunlight for 120 s. (C) Limits of solid-state detection of RDX and PETN as measured by monitoring the change in emission intensity at 540 nm upon exposure (60 s) to simulated sunlight. In the case of potassium nitrate, a concentrated solution (30 mM) in acetonitrile and long exposure times (600 s) were necessary to obtain the 8-fold increase shown.
As shown in Figure 12A, an acceptable turn-on emission signal at 540 nm was generated by 10 ng of RDX after 60 seconds of irradiation with a solar simulator. In addition to a fluorescence signal, the
ACS Paragon Plus Environment
1 2 3 4 5 6 7 8 9 10 11 12 13 14 15 16 17 18 19 20 21 22 23 24 25 26 27 28 29 30 31 32 33 34 35 36 37 38 39 40 41 42 43 44 45 46 47 48 49 50 51 52 53 54 55 56 57 58 59 60
28 distinct yellow color of 27 could also be observed by eye, as shown in Figure 12B. The limits of detection of the DHA5 chemosensor were estimated by spotting RDX or PETN solutions of varying concentrations onto the DHA5-coated slides and are shown in Figure 12C. In general, a greater emission signal at 540 nm was generated by PETN over RDX, possibly because PETN is more susceptible to photodegradation than RDX.
Select interferents, such as ketones and aldehydes, did not produce a significant emission signal at 540 nm. Moreover, consistent with observations made during the synthesis of D1, hydrogen peroxide did not react readily with DHA5 and most likely only formed a small quantity of the radical cation of DHA5, which is non-emissive and therefore did not produce any emission at 540 nm.
Aqueous potassium nitrate solutions of varying concentrations were also spotted onto the DHA5-coated glass slides in order to gauge the response of the DHA5 indicator to nitrate contaminants. Consistent with previous observations, sub-micromolar solutions of potassium nitrate did not generate a significant emission signal at 540 nm after one hour in either the absence of presence of simulated solar irradiation. Using a 30 mM solution of potassium nitrate, an approximately 8-fold increase in the emission intensity at 540 nm was observed after a 10 minute exposure to simulated sunlight. However, given the high nitrate concentration and relatively long irradiation time necessary to effect this emission signal, interference from nitrates during RDX/PETN detection can, in theory, be surmounted.
Within experimental error, approximately 100 pg of RDX and PETN can be detected by the DHA5 indicator under aerobic conditions by monitoring the emission intensity at 540 nm. In the presence of nitrate interferents, this detection limit is conservatively estimated as ca. 1 ng. These detection limits, although not low enough for the detection of equilibrium vapor, are competitive with present transportation security systems that make use of swipes to collect particles.
Conclusions
We have found that the nitramine-containing explosive RDX and the nitroester-containing explosive PETN are susceptible to photofragmentation upon exposure to sunlight to produce reactive NOx species,
ACS Paragon Plus Environment
1 2 3 4 5 6 7 8 9 10 11 12 13 14 15 16 17 18 19 20 21 22 23 24 25 26 27 28 29 30 31 32 33 34 35 36 37 38 39 40 41 42 43 44 45 46 47 48 49 50 51 52 53 54 55 56 57 58 59 60
29 such as nitrogen dioxide and nitric acid. N,N-Dimethylaniline and 9,9-disubstituted 9,10-dihydroacridines (DHAs) are capable of being selectively nitrated by the reactive, electrophilic NOx photofragmentation products of RDX and PETN. This nitration reaction proceeds rapidly and yields only one major, singly-nitrated product. A roughly 25-fold increase in the emission signal at 550 nm is observed upon nitration of DHAs due to the generation of fluorescent donor-acceptor chromophores. By monitoring the emission intensity at ca. 550 nm, the presence of approximately 100 pg of RDX or PETN can be detected within one minute by these indicators in the solid state upon exposure to sunlight. The photonitration reaction presented herein is a unique and selective detection mechanism for nitroester and nitramine explosives that is distinct from a previously-reported photoreduction reaction to detect explosives. The rapid nitration of 9,9-diphenyl or -dimethyl substituted DHA chemosensors in the presence of RDX or PETN and the resulting strong, turn-on emission signal qualifies these DHAs as cheap, impermanent indicators for the selective, standoff identification of nitroester and nitramine explosives.
ACS Paragon Plus Environment
1 2 3 4 5 6 7 8 9 10 11 12 13 14 15 16 17 18 19 20 21 22 23 24 25 26 27 28 29 30 31 32 33 34 35 36 37 38 39 40 41 42 43 44 45 46 47 48 49 50 51 52 53 54 55 56 57 58 59 60
30 Experimental Section
Materials, Instrumentation and General Experimental Methods. Synthetic manipulations that required an inert atmosphere (where noted) were carried out under argon using standard Schlenk techniques. All solvents were of reagent grade or better unless otherwise noted. All solvents used for photophysical experiments were of spectroscopic grade. Anhydrous tetrahydrofuran, diethyl ether, toluene and dichloromethane were obtained from a dry solvent system. Spectroscopic-grade acetonitrile was degassed and stored over 4Å sieves. 1H and 13C NMR spectra for all compounds were acquired in CHCl3 at 400 and 100 MHz, respectively. The chemical shift data are reported in units of δ (ppm) relative to tetramethylsilane (TMS) and referenced with residual CHCl3. 19F NMR spectra were recorded at 380 MHz. Trichlorofluoromethane was used as an external standard (0 ppm) and upfield shifts are reported as negative values. In some cases, signals associated with the CF3 groups and proximal quaternary centers were not reported in the 13C-NMR spectra due to C-F coupling and low signal-to-noise ratios. High-resolution mass spectra (HRMS) were obtained using a peak-matching protocol to determine the mass and error range of the molecular ion, employing either electron impact or electrospray as the ionization technique. GC-MS (electron impact mass spectrometer) data were recorded in the temperature range of 100-350 oC under a vacuum of at least 10-5 torr. GC retention times are reported in minutes. X-ray crystal structures were determined with graphite-monochromated Mo Kα radiation (λ = 0.71073 Å). All structures were solved by direct methods using SHELXS26 and refined against F on all data by full-matrix least squares with SHELXL-97. All non-hydrogen atoms were refined anisotropically. All electrochemical measurements were made using a quasi-internal Ag wire reference electrode submerged in 0.01 M AgNO3/0.1 M n-Bu4NPF6 in anhydrous MeCN. Typical CVs were recorded using a platinum button electrode as the working electrode and a platinum coil counter electrode. The ferrocene/ferrocenium (Fc/Fc+) redox couple was used as an external reference. Ultraviolet-visible absorption spectra were corrected for background signal with either a solvent-filled cuvette (solutions) or a blank microscope slide (films). Fluorescence spectra were measured using either right-angle (solutions) or front-face (22.5°) detection (thin films). Fluorescence quantum yields were
ACS Paragon Plus Environment
1 2 3 4 5 6 7 8 9 10 11 12 13 14 15 16 17 18 19 20 21 22 23 24 25 26 27 28 29 30 31 32 33 34 35 36 37 38 39 40 41 42 43 44 45 46 47 48 49 50 51 52 53 54 55 56 57 58 59 60
31 determined by the optically dilute method27 using quinine sulfate in 0.1M H2SO4 as a standard (Φ=0.53) and were corrected for solvent refractive index and absorption differences at the excitation wavelength. Fluorescence lifetimes were measured via frequency modulation using a 365 nm laser diode as the light source and the modulation of POPOP as a calibration reference. For photolysis experiments,28 solutions were irradiated under air at 313 nm using either: (1) the Xenon lamp (450 W) from a fluorimeter, with the excitation slit set to 29.4 nm (the maximum value); (2) a 500 W Mercury Arc Lamp fitted with a 313 nm interference filter (or a 334 nm or 365 nm interference filter) and varying neutral density filters (0.5, 1.0 or 2.0 OD); or (3) a solar simulator equipped with a 450 W Xenon arc lamp, with a spectral output of 1.3 suns under AM 1.5 conditions. The first two light sources were calibrated with a potassium ferric oxalate actinometer.29 For each measurement, reaction progress was also monitored in the dark to ensure that there was no thermal contribution to the nitration of aromatic amines by RDX and PETN. Each photolysis experiment was performed in triplicate. N-Phenylanthranilic acid was esterified following a literature procedure.30 RDX and PETN were obtained from K-9 training units, which consisted of RDX/PETN adsorbed onto sand. RDX and PETN were extracted from the sand with spectral grade acetonitrile and precipitated by the addition of DI water. The solids thus isolated were recrystallized three times from chloroform / acetonitrile and stored in the dark at -4 oC.
N,N-Dimethyl-4-nitroaniline (DMNA). A mixture of 0.4 mL DMA and 0.1g of either RDX or PETN were dissolved in 3.0 mL dry, degassed acetonitrile and the solution photolyzed with a xenon arc lamp at 313 nm for 60 minutes. The reaction mixture was sampled every 10 minutes to determine the GC yield of the DMNA product. Approximately 80% of DMNA (GC yield) was formed after 60 minutes of photolysis. The yellow DMNA was isolated by flash column chromatography using 50/50 hexanes/dichloromethane as an eluent. 1H NMR (400 MHz, CHCl3) δ 3.11 (s, 6H), 6.59 (d, J = 8.2 Hz, 2H), 8.09 (d, J = 8.2 Hz, 2H). 13C NMR (100 MHz, CHCl3) δ 40.2, 110.2, 126.0, 136.9, 154.3. HRMS (ESI) calc for C8H11N2O2 [M+H]+ 167.0815, found 167.0819. IR (KBr plate) 695 (s), 750 (s), 820 (s), 1067 (m), 1118 (m), 1232 (m), 1347 (m), 1383 (w), 1456 (s), 1483 (s), 1582 (s), 1615 (w), 2924 (m) cm -1.
ACS Paragon Plus Environment
1 2 3 4 5 6 7 8 9 10 11 12 13 14 15 16 17 18 19 20 21 22 23 24 25 26 27 28 29 30 31 32 33 34 35 36 37 38 39 40 41 42 43 44 45 46 47 48 49 50 51 52 53 54 55 56 57 58 59 60
32 General procedure for the synthesis of 9,9-disubstituted-9,10-dihydroacridines (DHA1-4). A flame-dried Schlenk flask was charged with 1.0 g methyl N-phenylanthranilate (14, 4.4 mmol) and 45 mL dry, degassed Et2O under argon and cooled to 0 oC in an ice bath. 3.5 Equivalents of the appropriate Grignard reagent in Et2O were added dropwise and the reaction allowed to stir at room temperature under argon for 3 d. After quenching with saturated ammonium chloride, the organic layer was separated, washed with brine and water and dried over MgSO4, and the solvent evaporated under reduced pressure. The crude tertiary alcohol thus formed was carried on to the next step without purification. To the neat oil isolated from the previous step was added 1-2 mL of concentrated H2SO4 under argon and the reaction stirred at room temperature for 1 h under argon. After dilution with 30 mL DI H2O the reaction was poured into a 10% (v/v) aqueous ammoniacal solution and extracted with ether (5 x 50 mL). The combined organic layers were washed with saturated sodium bicarbonate, brine and water and dried over MgSO4, and the solvent evaporated under reduced pressure. The residue was purified by flash column chromatography to yield the desired compound.
9,9-Dimethyl-9,10-dihydroacridine (DHA1). Synthesized using 3.0 M methyl magnesium bromide in Et2O and purified by flash column chromatography using gradient elution, starting with 10% dichloromethane in hexanes and progressing to 50% dichloromethane in hexanes. 0.41 g (45%) of a white solid was isolated. m.p. 120 oC. 1H NMR (400 MHz, CHCl
3) δ 1.54 (s, 6H), 6.11 (s, 1H), 6.67 (dd, J = 0.8 Hz, 7.6 Hz, 2H), 6.90 (m, 2H), 7.09 (m, 2H), 7.37 (d, J = 7.6 Hz, 2H). 13C NMR (100 MHz, CHCl3) δ 30.7, 36.4, 113.6, 120.8, 125.7, 126.9, 129.3, 138.6. HRMS (ESI) calc for C15H15N [M+H]+ 210.1277, found 210.1284. IR(KBr plate) 745 (s), 886 (m), 1037 (m), 1318 (m), 1452 (m), 1479 (s), 1507 (m), 1580 (m), 1606 (m), 2966 (m), 3359 (m) cm-1.
9,9-Diethyl-9,10-dihydroacridine (DHA2). Synthesized using 3.0 M ethyl magnesium bromide in Et2O and purified by flash column chromatography using hexanes as the eluent. 0.36 g (35%) of a clear oil was isolated. 1H NMR (400 MHz, CHCl3) δ 0.91 (t, J = 7.6 Hz, 3H), 0.97 (t, J = 7.6 Hz, 3H), 2.24 (q,
J = 7.6 Hz, 2H), 2.35 (q, J = 7.6 Hz, 2H), 5.74 (s, 1H), 6.90 (m, 3H), 7.06 (m, 5H). 13C NMR (100 MHz,
CHCl3) δ 13.0, 13.1, 13.9, 14.8, 24.3, 31.7, 115.9, 116.8, 118.2, 118.5, 120.3, 120.5, 121.0, 121.2,
ACS Paragon Plus Environment
1 2 3 4 5 6 7 8 9 10 11 12 13 14 15 16 17 18 19 20 21 22 23 24 25 26 27 28 29 30 31 32 33 34 35 36 37 38 39 40 41 42 43 44 45 46 47 48 49 50 51 52 53 54 55 56 57 58 59 60
33 123.0, 124.9, 127.4, 127.5, 129.5, 129.7, 130.1, 130.2, 134.3, 140.1, 140.3, 141.2, 143.5, 143.7. HRMS (ESI) calc for C17H19N [M+H]+ 238.1590, found 238.1591. IR (KBr plate) 692 (m), 745 (s), 1309 (m), 1451 (m), 1507 (s), 1575 (m), 1593 (s), 2871 (m), 2930 (m), 2965 (m), 3041 (m), 3403 (m) cm-1.
9,9-Diisopropyl-9,10-dihydroacridine (DHA3). Synthesized using 2.0 M isopropyl magnesium chloride in Et2O and purified by flash column chromatography using hexanes as the eluent. 0.19 g (17%) of a clear oil was isolated. 1H NMR (400 MHz, CHCl3) δ 0.77 (d, J = 6.8 Hz, 3H), 1.02 (d, J = 6.8 Hz, 3H), 1.46 (s, 3H), 1.87 (s, 3H), 3.06 (septet, J = 6.8 Hz, 1H), 5.75 (s, 1H), 6.88 (m, 5H), 7.20 (m, 4H). 13C NMR (100 MHz, CHCl
3) δ 19.7, 20.9, 22.4, 22.2, 30.6, 115.5, 118.6, 119.8, 121.2, 127.1, 129.5, 129.8, 130.0, 130.7, 136.8, 141.0, 143.5. HRMS (ESI) calc for C19H24N [M+H]+ 266.1903, found 266.1904. IR (KBr plate) 693 (s), 745 (s), 1079 (m), 1309 (s), 1450 (s), 1508 (s), 1576 (s), 1594 (s), 2961 (m), 3399 (s) cm-1.
9,9-Diphenyl-9,10-dihydroacridine (DHA4). Synthesized using 3.0 M phenyl magnesium bromide in Et2O and purified by flash column chromatography using gradient elution, starting with 10% dichloromethane in hexanes and progressing to 50% dichloromethane in hexanes. 0.83 g (57%) of a white solid was isolated. m.p. 230 oC. 1H NMR (400 MHz, CHCl3) δ 6.25 (s, 1H), 6.86 (m, 9H), 7.16 (m, 8H). 13C NMR (100 MHz, CHCl3) δ 30.1, 56.7, 113.5, 120.2, 125.6, 126.1, 126.2, 127.1, 127.4, 127.6, 127.6, 127.9, 128.5, 130.0, 130.2, 130.2, 139.7, 146.0, 149.3. HRMS (ESI) calc for C25H19N [M+H]+ 334.1590, found 334.1584. IR (KBr plate) 699 (m), 734 (m), 753 (m), 907 (m), 1315 (m), 1474 (s), 1604 (m), 3057 (w), 3393 (m) cm-1.
Methyl N-methyl-N-phenylanthranilate (15). A flame-dried two-neck round bottom flask was charged with 8 g N-phenylanthranilic acid (37.5 mmol), 0.3 mL 15-crown-5, 300 mL dry THF and 100 mL dimethoxyethane under argon. The solution was cooled to 0 oC in an ice bath, 5 g of a 60 wt% dispersion of NaH in mineral oil (3 g NaH, 125 mmol) was added to the reaction mixture in small portions under argon and 15 mL dimethyl sulfate (19.99 g, 158 mmol) was added via syringe. After stirring at room temperature for 5 d under argon the reaction was poured carefully onto 800 g ice and extracted with Et2O (5 x 50 mL). The organic layers were combined, washed thoroughly with saturated
ACS Paragon Plus Environment
1 2 3 4 5 6 7 8 9 10 11 12 13 14 15 16 17 18 19 20 21 22 23 24 25 26 27 28 29 30 31 32 33 34 35 36 37 38 39 40 41 42 43 44 45 46 47 48 49 50 51 52 53 54 55 56 57 58 59 60
34 sodium bicarbonate (3x 25 mL), brine and water, dried over MgSO4 and the solvent evaporated under reduced pressure. The resulting oil was purified by flash column chromatography using gradient elution, starting with 100% hexanes and progressing to 30% dichloromethane in hexanes to yield 7.2 g (80%) of a yellow oil. 1H NMR (400 MHz, CHCl3) δ 3.28 (s, 3H), 3.58 (s, 3H), 6.63 (dd, J = 8.8 Hz, J = 1.2 Hz, 2H), 6.73 (td, , J = 6 Hz, J = 1.2 Hz, 1H), 7.16 (td, J = 7.2 Hz, J = 1.6 Hz, 2H), 7.27 (m, 2H), 7.53 (td, J = 8 Hz, J = 1.6 Hz, 1H), 7.79 (dd, J = 7.6 Hz, J = 1.6 Hz, 1H). 13C NMR (100 MHz, CHCl3) δ 40.5, 52.3, 114.4, 118.1, 125.4, 129.1, 129.2, 129.4, 131.6, 133.4, 148.3, 129.4, 167.7. HRMS (ESI) calc for C15H15NO2 [M+H]+ 242.1176, found 242.1170. IR (KBr plate) 2924 (s), 2853 (s), 1728 (m), 1594 (m), 1500 (m), 1454 (m), 1391 (w), 1253 (s), 1214 (s), 1062 (m), 1005 (m), 758 (m), 575 (m) cm-1.
General procedure for the synthesis of 9,9-disubstituted-10-methyl-9,10-dihydroacridines (DHA5-9). A flame-dried Schlenk flask was charged with 1.0 g methyl N-methyl-N-phenylanthranilate (15, 4.1 mmol) and 45 mL dry, degassed Et2O under argon and cooled to 0 oC in an ice bath. 2.5 Equivalents of the appropriate Grignard reagent in Et2O was added dropwise and the reaction allowed to stir at room temperature under argon for 3 d. After quenching with saturated ammonium chloride, the organic layer was separated, washed with brine and water and dried over MgSO4, and the solvent evaporated under reduced pressure. The crude tertiary alcohol thus formed was carried on to the next step without purification. To the neat oil isolated from the previous step was added 1-2 mL of concentrated H2SO4 under argon and the reaction stirred at room temperature for 1 h under argon. After dilution with 30 mL DI H2O the reaction was poured into a 10% (v/v) aqueous ammoniacal solution and extracted with ether (5 x 50 mL). The combined organic layers were washed with saturated sodium bicarbonate, brine and water and dried over MgSO4, and the solvent evaporated under reduced pressure. The residue was purified by flash column chromatography to yield the desired compound.
9,9-Dimethyl-10-methyl-9,10-dihydroacridine (DHA5). Synthesized using 3.0 M methyl magnesium bromide in Et2O and purified by flash column chromatography using gradient elution, starting with 10% dichloromethane in hexanes and progressing to 50% dichloromethane in hexanes. 0.39 g (42%) of a light yellow solid was isolated. m.p. 93 oC. 1H NMR (400 MHz, CHCl3) δ 1.52 (s,
ACS Paragon Plus Environment
1 2 3 4 5 6 7 8 9 10 11 12 13 14 15 16 17 18 19 20 21 22 23 24 25 26 27 28 29 30 31 32 33 34 35 36 37 38 39 40 41 42 43 44 45 46 47 48 49 50 51 52 53 54 55 56 57 58 59 60
35 6H), 3.43 (s, 3H), 6.96 (m, 4H), 7.21 (m, 2H), 7.38 (d, J = 1.6 Hz, 2H). 13C NMR (100 MHz, CHCl3) δ 27.4, 33.5, 36.7, 112.3, 120.8, 123.8, 126.8, 132.8, 142.4. HRMS (ESI) calc for C16H17N [M+H]+ 224.1434, found 224.1429. IR (KBr plate) 751 (s), 1046 (m), 1268 (s), 1340 (s), 1450 (s), 1470 (s), 1590 (s), 2900 (m), 2950 (s), 2980 (s), 3050 (m) cm-1.
9,9-Diethyl-10-methyl-9,10-dihydroacridine (DHA6). Synthesized using 3.0 M ethyl magnesium bromide in Et2O and purified by flash column chromatography using hexanes as the eluent. 0.31 g (30%) of a clear oil was isolated. 1H NMR (400 MHz, CHCl3) δ 0.81 (t, J = 7.6 Hz, 3H), 0.84 (t, J = 7.6 Hz, 3H), 2.14 (q, J = 7.6 Hz, 2H), 2.27 (q, J = 7.6 Hz, 2H), 3.06 (s, 3H), 6.65 (m, 3H), 7.17 (m, 5H). 13C NMR (100 MHz, CHCl3) δ 14.2 (2), 14.3, 22.5, 22.8, 23.2, 23.4, 29.6, 30.4, 31.0, 31.2, 31.7, 37.1, 39.4, 39.6, 114.0, 114.1, 117.2, 117.3, 125.5, 125.9, 127.8, 128.1, 128.2, 128.4, 128.7, 128.9, 130.5, 132.0, 132.5, 140.0, 140.1, 141.5, 143.4, 146.1, 147.0, 149.3, 149.5. HRMS (ESI) calc for C18H21N [M+H]+ 252.1747, found 252.1742. IR (KBr plate) 692 (s), (748 (s), 1342 (m), 1444 (m), 1487 (s), 1500 (s), 1568 (m), 1592 (s), 1602 (s), 2810 (m), 2870 (m), 2963 (m), 3024 (m) cm-1.
9,9-Diisopropyl-10-methyl-9,10-dihydroacridine (DHA7). Synthesized using 2.0 M isopropyl magnesium chloride in Et2O and purified by flash column chromatography using hexanes as the eluent. 0.19 g (17%) of a clear oil was isolated. 1H NMR (400 MHz, CHCl3) δ 0.85 (d, J = 7.2 Hz, 3H), 0.89 (d, J = 7.6 Hz, 3H), 1.46 (s, 3H), 1.80 (s, 3H), 2.84 (septet, J = 7.2 Hz, 1H), 3.03 (s, 3H), 6.74 (m, 3H), 6.98 (m, 1H), 7.13 (m, 5H). 13C NMR (100 MHz, CHCl3) δ 21.6, 22.3, 23.8, 31.8, 39.0, 114.6, 117.4, 120.6, 121.4, 125.2, 127.4, 127.8, 128.0, 128.7, 129.4, 133.6, 140.0, 141.2, 147.2, 149.6. HRMS (ESI) calc for C20H25N [M+H]+ 280.2060, found 280.2058. IR (KBr plate) 748 (m), 1499 (m), 1601 (m), 2820 (m), 2910 (m) 3040 (m) cm-1.
9,9-Diphenyl-10-methyl-9,10-dihydroacridine (DHA8). Synthesized using 3.0 M phenyl magnesium bromide in Et2O and purified by flash column chromatography using gradient elution, starting with 10% dichloromethane in hexanes and progressing to 50% dichloromethane in hexanes. 0.79 g (55%) of a light yellow solid was isolated. m.p. 165 – 166 oC. 1H NMR (400 MHz, CHCl3) δ 3.29 (s, 3H), 6.84 (m, 2H), 6.91 (m, 8H), 7.18 (m, 6H), 7.26 (m, 2H). 13C NMR (100 MHz, CHCl3) δ 33.6,
ACS Paragon Plus Environment
1 2 3 4 5 6 7 8 9 10 11 12 13 14 15 16 17 18 19 20 21 22 23 24 25 26 27 28 29 30 31 32 33 34 35 36 37 38 39 40 41 42 43 44 45 46 47 48 49 50 51 52 53 54 55 56 57 58 59 60