HAL Id: hal-02061724
https://hal.laas.fr/hal-02061724
Submitted on 8 Mar 2019
HAL is a multi-disciplinary open access
archive for the deposit and dissemination of
sci-entific research documents, whether they are
pub-lished or not. The documents may come from
teaching and research institutions in France or
abroad, or from public or private research centers.
L’archive ouverte pluridisciplinaire HAL, est
destinée au dépôt et à la diffusion de documents
scientifiques de niveau recherche, publiés ou non,
émanant des établissements d’enseignement et de
recherche français ou étrangers, des laboratoires
publics ou privés.
3D Stationary and Temporal Electro-Thermal
Simulations of Metal Oxide Gas Sensor based on a High
Temperature and Low Power Consumption
Micro-Heater Structure using COMSOL TM
N. Dufour, C. Wartelle, Philippe Menini
To cite this version:
N. Dufour, C. Wartelle, Philippe Menini. 3D Stationary and Temporal Electro-Thermal Simulations
of Metal Oxide Gas Sensor based on a High Temperature and Low Power Consumption Micro-Heater
Structure using COMSOL TM. International COMSOL Conference 2012, Oct 2012, Milan, Italy.
�hal-02061724�
3D Stationary and Temporal Electro-Thermal Simulations of Metal
Oxide Gas Sensor based on a High Temperature and Low Power
Consumption Micro-Heater Structure using COMSOL
TMN. Dufour
1,2, C. Wartelle
2, P. Menini
1,31
CNRS, LAAS, 7 avenue du colonel Roche, F-31400 Toulouse, France
2
Renault S.A.S., Technocentre, 1, avenue du Golf, F-78288 Guyancourt, France
3Univ de Toulouse, UPS, F-31400 Toulouse, France
ndufour@laas.fr, menini@laas.fr
Abstract: We have developed a metal oxide gas sensor based on a micro-heater structure on a membrane able to work until 550°C, with a power consumption equal to 60mW at this temperature. In this paper, we have presented the electro-thermal simulation of this structure with COMSOLTM, in order to check the temperature
distribution on the surface, compare the maximum temperature between simulation and measurement for different power consumption, find the time necessary to obtain a stabilized temperature. The results obtained are: a good distribution of the temperature at the surface of the structure, the simulated and measured temperature curves in function of the power consumption are very close, the time required to stabilize the temperature of the membrane is about 60ms.
Keywords: Gas sensor, micro-heater, metal oxide, membrane
1. Introduction
The basic principle of gas detection with metal oxide sensors is based on the variation of conductivity of a semi-conductor material, in function of the nature and the concentration of gases in contact with this material. The main advantages of this kind of sensors are: a low cost, very sensitive and fast responses to gases, easily miniaturized. These sensors may be used to detect poisonous gases (CO, NO2) [1], odorous gases
(SO2, H2S) [2], flammable gases (CH4, C3H8) [3],
…
The main role of the heater resistance is, with a high temperature, to easily desorb the gas molecule in contact with the sensitive layer. This temperature must be at least 400K [4]. The higher the temperature is, the easier the desorption is [5]. But a higher temperature implies a higher power consumption. And in the case of gas sensor, the
the power consumption must remain low enough. There is a compromise to find between high temperature and low power consumption [6].
1.1 Micro-heater technological process
For this purpose, we have developed a micro-heater structure with these characteristics. The substrate is silicon. On this substrate, we did grow a bi-layer membrane SiO2/SiNx. On the
membrane, we have deposited the two electrodes (heater and sensitive) by evaporation; the deposited metal is platinum with a bonding layer of titanium. On the metallization layer, we did grow a SiO2 passivation layer. After that, we have
realized the open contact with a chemical etching. To liberate the membrane, we realize a backside RIE (Reactive Ion Etching) to etch the backside membrane deposition, and a DRIE (Deep RIE) to etch the silicon substrate. To finish, we have deposited the sensitive layer by inkjet. In this paper, we will use zinc oxide (ZnO) as sensitive layer. The finished component has dimensions of 2mm*2mm.
2. COMSOL
TMParameters
The results presented in this paper are from COMSOLTM 4.2 version.
2.1 Physics
The physics model used to simulate our work is the Joule Effect model. A first equation defines to electric potential.
With: - V the electric potential
Equation 1. Electric potential equation
With: - Q the heat source - ρ the density - Cp the heat capacity - k the thermal conductivity
Equation 2. Heat transfer equation
These two equations are linked by a third equation, the Joule Effect equation.
With: - σ the electrical conductivity
Equation 3. Joule Effect equation
To realize the studies and solve the equations, we have used a MUMPS solver.
To respect the test conditions in our gas system, we have added at the surface of the sensor an inward heat flux equal to 125W/m².
2.2 Electrodes material
The heater and sensitive electrodes are in platinum. The characteristics of the material used are described in the following table.
Parameter Unit Value Thermal Conductivity (k) W/(m*K) 73 Electrical Conductivity (σ) S/m 2.94e6 Density (ρ) kg/m^3 21440 Heat Capacity at Constant Pressure (Cp) J/(kg*K) 132 Thermal Expansion Coefficient (α) 1/K 8.8e-6
Young Modulus (E) Pa 150e9 Poisson’s Ratio (ν) 1 0.35
Table 1. Material properties of platinum
2.3 Mesh
To mesh correctly the structure, we have tried several possibilities and the best choice was: a free tetrahedral geometry with a geometric scale of 1/1/1 (x/y/z) for the wafer, and a free tetrahedral geometry with a geometric scale of 0.01/0.01/1 (x/y/z) for the rest of the structure.
The selected mesh size is “normal”, because the results obtained with this configuration is better than with “coarse” and similar with “fine”. The complete mesh consists of 27440 elements.
3. Results
The objective of these simulations is to design a model faithful to our real micro-heater structure to be able to simulate the future evolutions before designing it.
3.1 Temperature distribution
In this first simulation, we have observed the temperature distribution on the surface of the passivation layer without sensitive layer. We have applied a voltage of 5V across the heater resistance, which corresponds to a power consumption of 57mW, deduced from the following equation.
With: - P the power consumption - R the resistance
Equation 4. Power consumption equation
The results obtained have been presented in 3D (Figure 1) and in 2D (Figure 2), in degrees Celsius.
Figure 1. 3D temperature distribution in the gas sensor without sensitive layer – Heater voltage = 5V
Figure 2. 2D temperature distribution at the surface of the passivation layer – Heater voltage = 5V
The maximum temperature with 5V is 533°C at the center of the surface. The temperature gradient between the center and a circle of diameter 500µm, which corresponds to the limit of our sensitive layer deposition, is around 100°C. Moreover, the maximum size of the open contact is a circle of diameter 340µm, and the temperature gradient with the center is 70°C
3.2 Power consumption
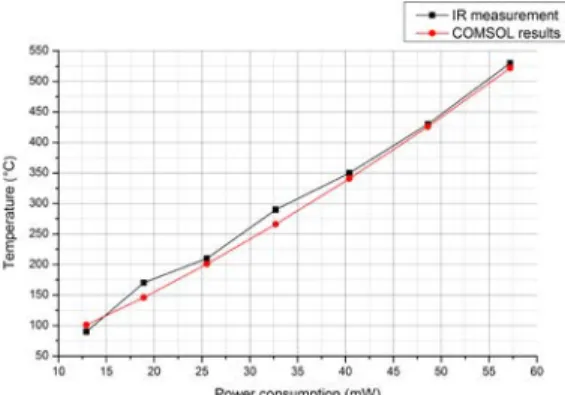
In order to validate the results obtained in the previous section, we have compared the
maximum temperature obtained by simulations for different voltages applied across the heater, to infrared measurements with a real sensor (without sensitive layer).
Figure 3. Temperature versus power consumption at the surface of the passivation layer with COMSOLTM
simulations and infrared measurement
The two plotted curves are very close and the maximum deviation is below 25°C. This graph is used to validate the modeling of our sensor. 3.3 Influence of the thickness of the sensitive layer on the surface temperature
We have added at the previous design simulated a sensitive layer modeled by a cylinder of 500µm of diameter. The thickness of sensitive layers deposited by our inkjet system is between 0.5µm and 1μm. The material used is ZnO from the library materials. The voltage applied across the sensitive resistance is 0.1mV.
Figure 4. Temperature versus power consumption for different ZnO sensitive layer thickness
For a power consumption between 35mW and 60mW, the difference of the maximum temperature between a structure without sensitive layer and with a 0.5µm layer of ZnO is around 25°C. At the same power consumption range, the difference of the maximum temperature between a structure without sensitive layer and with a 1µm layer of ZnO is around 50°C.
3.4 Temporal temperature stabilization
To simulate the transient voltage, we have replaced the continuous voltage applied across the heater resistance by a transient step between 0 and 5V in 100ns.
Figure 5. Temporal variations of temperature at the surface of the passivation layer for a heater power from 0 to 5V
We have obtained curves that converge toward the same temperature as in stationary study (533°C) and we can consider that the temperature is stabilized after around 60ms.
4. Conclusions
The purpose of this work was to create a model faithful to our real micro-heater. The simulated results are really close to the measurement. We have successfully modeled our low power and high temperature structure.
In addition, we have observed that the temperature uniformity is suitable for our application, the influence of a sensible layer on
the maximal temperature which decreases of 25°C for a 0.5µm ZnO layer at high temperature, and the transient time equal to 60ms when we apply a voltage step from 0 to 5V.
These results are promising and the model created will be helpful for the next optimizations of our structure.
5. References
[1] J. Courbat, D. Briand, L. Yue, S. Raible, N.F. de Rooij, Drop-coated metal-oxide gas sensor on polyimide foil with reduced power consumption for wireless applications, Sensors and Actuators B, 161,862– 868 (2012)
[2] K. Wetchakun, T. Samerjai, N. Tamaekong, C. Liewhiran, C. Siriwong, V. Kruefu, A. Wisitsoraat, A. Tuantranont, S. Phanichphant, Semiconducting metal oxides as sensors for environmentally hazardous gases,
Sensors and Actuators B, 160, 580– 591 (2011)
[3] S.N. Oliaee, A. Khodadadi, Y. Mortazavi, S. Alipour, Highly selective Pt/SnO2 sensor to propane or methane in presence of CO and ethanol, using gold nanoparticles on Fe2O3 catalytic filter, Sensors and Actuators B, 156, 527– 538 (2011)
[4] S. Capone, A. Forleo, L. Francioso, R. Rella, P. Siciliano, J. Spadavecchia, D. S. Presicce, A. M. Taurino, Solid State Gas Sensors : State of the Art and Future Activities, Journal of
Optoelectronics and Advanced Materials, 5,
1335-1348 (2003)
[5] David E. Williams, Geoff S. Henshaw and Keith F. E. Pratt, Detection of Sensor Poisoning using Self-diagnostic Gas Sensors, Chem. Soc.
Faraday Trans., 91, 3307-3308 (1995)
[6] Alois Friedberger, P. Kreisl, E. Rose, G. Muller, G. Kuhner, J. Wollenstein, H. Bottner, Micromechanical fabrication of robust low-power metal oxide gas sensors, Sensors and Actuators B, 93, 345-349 (2003)