HAL Id: hal-02873900
https://hal.archives-ouvertes.fr/hal-02873900
Submitted on 18 Jun 2020
HAL is a multi-disciplinary open access archive for the deposit and dissemination of sci-entific research documents, whether they are pub-lished or not. The documents may come from teaching and research institutions in France or abroad, or from public or private research centers.
L’archive ouverte pluridisciplinaire HAL, est destinée au dépôt et à la diffusion de documents scientifiques de niveau recherche, publiés ou non, émanant des établissements d’enseignement et de recherche français ou étrangers, des laboratoires publics ou privés.
Comparison of different biomarkers
Margaux Mathieu-Resuge, Edouard Kraffe, Fabienne Le Grand, Andy Boens,
Antoine Bideau, Salvador E. Lluch-Cota, Ilie S. Racotta, Gauthier Schaal
To cite this version:
Margaux Mathieu-Resuge, Edouard Kraffe, Fabienne Le Grand, Andy Boens, Antoine Bideau, et al.. Trophic ecology of suspension-feeding bivalves inhabiting a north-eastern Pacific coastal lagoon: Comparison of different biomarkers. Marine Environmental Research, Elsevier, 2019, 145, pp.155-163. �10.1016/j.marenvres.2019.02.016�. �hal-02873900�
Please note that this is an author-produced PDF of an article accepted for publication following peer review. The definitive publisher-authenticated version is available on the publisher Web site.
March 2019, Volume 145, Pages 155-163
https://doi.org/10.1016/j.marenvres.2019.02.016 https://archimer.ifremer.fr/doc/00484/59521/
https://archimer.ifremer.fr
Trophic ecology of suspension-feeding bivalves inhabiting a
north-eastern Pacific coastal lagoon: Comparison of
different biomarkers
Mathieu-Resuge Margaux 1, *, Kraffe Edouard 1, Le Grand Fabienne 3, Boens Andy 1, Bideau Antoine 1, Lluch-Cota Salvador E. 2, Racotta Ilie S. 2, Schaal Gauthier 1
1
Univ Brest, CNRS, IRD, Ifremer, LEMAR, IUEM, F-29280, Plouzane, France
2
Centro de Investigaciones Biológicas Del Noroeste (CIBNOR), La Paz, BCS, Mexico
* Corresponding author : Margaux Mathieu-Resuge, email address : m.mathieuresuge@hotmail.fr
Abstract :
Understanding the nature and origins of food sources supporting coastal lagoon-inhabiting organisms is necessary to evaluate the ecological status of such ecosystems. The trophic ecology of a bivalve specie
Spondylus crassisquama was studied in the Ojo de Liebre lagoon (Baja California, Mexico), combining
stable isotope (SI), fatty acid (FA) and sterols analyses along a transect under oceanic influences. The second objective of the study was to investigate if sterols compositions give complementary information to those obtained from FA and SI. Temporal and spatial patterns of the three biomarkers in bivalve tissues suggest oceanic inputs at the mouth of the lagoon, while the inner station was characterized by a contribution of local sources including an important role of micro heterotrophs. This study revealed that the association of lipid biomarkers provide higher taxonomic resolution of the spatiotemporal heterogeneity in nutrient sources influencing the trophic functioning of a large coastal lagoons.
Highlights
► Stable isotopes fatty acids and sterols were used to characterize the diet of bivalves. ► A transect was sampled in a Pacific lagoon with increasing distance from the mouth. ► Bivalves at the entrance of the lagoon relied on oceanic phytoplankton inputs. ► Bivalves in the inner lagoon relied on local microbial food web. ► Lipid biomarkers and SI were complementary to distinguish the food sources origins.
Keywords : coastal zone, Ojo de Liebre, suspension-feeders, multi-tracer analyses, fatty acids, stables
M
AN
US
CR
IP
T
AC
CE
PT
ED
3 1. Introduction 30Coastal areas are highly productive marine ecosystems (Clavier et al., 2014; Nixon, 1982) that 31
provide a variety of ecosystem services, such as nutrient recycling, biogeochemical cycles 32
regulation, or food supply (Gattuso et al., 1998; Martínez et al., 2007). Among coastal 33
ecosystems, lagoons play key ecological and economic roles, providing habitat to many resident 34
and migratory species and hosting commercial, artisanal and subsistence fisheries that support 35
local populations. Their high productivity originates from nutrients inputs of both terrestrial and 36
marine origins (Carlier et al., 2007; Mann, 1982), as well as from local primary productivity, 37
enhanced by the shallow and enclosed nature of these areas. Understanding the relative 38
contribution of autochthonous processes versus allochthonous inputs (lagoon vs oceanic 39
primary production, respectively) for the functioning of coastal lagoons is therefore critical to 40
understand the dynamics of these ecosystems, and how they are likely to react when facing 41
anthropogenic disturbances. 42
Suspension-feeding bivalves are major components of coastal lagoons, where they can 43
dominate benthic communities and play a key role in the regulation of benthic and pelagic 44
biogeochemical fluxes (Dame, 1993). Because these organisms are primary consumers, they 45
directly reflect processes occurring at the lowest level of food webs (Marchais et al., 2013). 46
Furthermore, suspension-feeders can feed on a wide variety of sestonic particles, hence can be 47
integrative indicators of coastal oceanic versus lagoon autochthonous inputs into coastal 48
ecosystems (Coma et al., 2001; Kraak et al., 1991; Lefebvre et al., 2009). 49
M
AN
US
CR
IP
T
AC
CE
PT
ED
4 Since a few decades, trophic studies have evolved from field or laboratory observational 50approaches (i.e. stomach contents, food choice experiments) to biomarker-based approaches 51
(BBA). BBA have been applied to a variety of organisms, from primary consumers (Desvilettes et 52
al., 1997) to marine mammals (Kelly, 2000), as well as at the community level (Alfaro et al., 53
2006; Vander Zanden and Rasmussen, 2001). Every BBA is based on several prerequisites, which 54
need to be met in order to produce robust trophic information. Uncertainties concerning these 55
prerequisites are common (i.e. concerning turnover, metabolic fate of biomarker compounds) 56
and result in less reliable data, and stress the need to couple different BBA to fully understand 57
to trophic dynamics of natural environments. Among the most commonly used BBA, stable 58
isotopes (SI) (δ13C, δ15N, δ34S) have been widely and successfully used to characterize the origin 59
of food sources and the trophic level of consumers (Peterson and Fry, 1987; Post, 2002). 60
However, SI analysis requires potential food sources to be discriminated in the two or three 61
dimensional isotopic space, which is not always the case in high diversity systems. Moreover, SI 62
analysis provides a limited taxonomic resolution of the food sources assimilated concerning 63
heterogeneous pools of organic matter (e.g. suspended particulate organic matter, sedimentary 64
organic matter). In this context, the combination with others biomarkers can give useful 65
information to complement identifications of food sources. Fatty acids allow the identification 66
of some taxa in the diet of consumers due to the existence of specific FA (Dalsgaard et al., 2003; 67
Parrish et al., 2000). Although primary producers have characteristic FA compositions, most do 68
not possess unique FAs which can cause limitations for identifications of food sources (Bec et 69
al., 2010). In addition, in the specific case of coastal benthic food webs, the important number 70
M
AN
US
CR
IP
T
AC
CE
PT
ED
5 of potential food sources is a problem for distinguishing their contributions to diets (Kelly and 71Scheibling, 2012). 72
Sterols are lipid compounds common in all primary producers. Some of them have been 73
reported to allow the characterization of classes, genus and in some cases, species of primary 74
producers that contribute to the diet of filter feeders (Napolitano et al., 1993; Soudant et al., 75
1998; Volkman, 1986). As for FAs, the different primary producers may display distinct sterols 76
composition, which a necessary condition for using these compounds as trophic biomarkers. 77
Moreover, since the capacity to synthesize de novo or modify dietary sterols is absent or 78
considered very low in marine invertebrates (Holden and Patterson, 1991; Kanazawa, 2001), 79
sterols have to be acquired from their diet. The role of sterols is still poorly understood, even if 80
they are recognized as important structural components of cell membranes (Giner et al., 2016) 81
and necessary for growth and larval development (Soudant et al., 1998). Primary producers that 82
constitute the major part of the diet of bivalves contain an important diversity of sterols, named 83
phytosterols (Wasowicz and Rudzinska, 2011), and their presence in consumers could be a 84
reliable complementary biomarkers to identify and distinguish contribution of specific food 85
sources to their diet. 86
The present study aims to characterize the trophic ecology of a suspension-feeding bivalve, 87
Spondylus crassisquama (Lamarck, 1819) within the Northeastern Pacific coastal lagoon of Ojo
88
de Liebre (Baja California, Mexico). By sampling this species at two sites, varying in their 89
distance to the open ocean, and at two seasons, characterized by different environmental 90
conditions, we test the hypothesis that oceanic inputs induce a spatial structure in the trophic 91
M
AN
US
CR
IP
T
AC
CE
PT
ED
6 ecology of suspension-feeding bivalves within the lagoon, including a higher reliance towards 92oceanic production in individuals living close to the lagoon mouth. For this purpose, a multi-93
tracers approach was chosen, combining stable isotopes, fatty acids and sterols composition in 94
bivalve digestive glands as well as in their potential food sources (particulate organic matter, 95
sedimentary organic matter, and seagrass detritus). The potential complementarity among 96
those different biomarkers is also discussed. 97
M
AN
US
CR
IP
T
AC
CE
PT
ED
7 2. Material and methods99
2.1 Sampling 100
The lagoon of Ojo de Liebre (Baja California, Mexico) is one of the largest coastal lagoons in the 101
north-east Pacific (≈ 40 km long, ≈ 10 km wide, 446 km2). Its topography is characterized by 102
deep and narrow channels surrounded by large intertidal flats. The tidal range is about 1 to 2.5 103
meters and currents are more turbulent in channels (maximum 2.5 knots) than intertidal flats 104
(0.35 to 1.5 knots) (Phleger and Ewing, 1962). Two stations, located on historically fished banks, 105
characterized by a depth around 7 to 10 m, were studied into the Ojo de Liebre lagoon (Figure 106
1). Station 1 (Chocolatero) is a bank located close to the mouth of the lagoon (at 6.1 km from 107
the entrance), while station 2 (Datil) represented the most inner station (15.5 km from the 108
M
AN
US
CR
IP
T
AC
CE
PT
ED
8 mouth) and the southern distribution limit of Spondylus crassisquama in this bay.109
Samples were collected in February and August 2016. For each station, 10 similarly sized 110
individuals were sampled by divers. Potential food sources available for filters feeders were also 111
sampled. One sedimentary core was sampled at each station. The upper centimeter, the most 112
likely to be resuspended by currents and therefore available to suspension-feeders, was 113
collected. Due to the absence of water column vertical stratification into the lagoon (Phleger 114
and Ewing, 1962), one surface water sample (3L) was collected for each site and each date. 115
Because of logistical limitations associated to sampling in the lagoon, we could not replicate our 116
source sampling within each site. Ojo de Liebre contains one of the largest seagrass bed of 117
Zostera marina in the Pacific (Cabello-Pasini et al., 2003) which represents one of the dominant
118
primary producer at the bay scale. Because seagrass detritus could contribute to the 119
composition of particulate organic matter (POM) and potentially as a food source for bivalves, 120
stranded Z. marina detritus were collected from the shore at the eastern part of the sampling 121
area, and considered as proxies of eelgrass detritus within the lagoon. Indeed, the SI 122
composition of seagrass is known to be little altered during degradation, in particular for δ13C 123
(Fenton and Ritz, 1988). 124
After collection, samples were placed in cooler boxes containing water and transported to the 125
laboratory (CIBNOR, Unidad Guerrero Negro). Bivalves were dissected and each tissue of 126
interest (i.e. adductor muscle and DG) was sampled, packed into aluminum and stored in liquid 127
nitrogen until further analysis. For each station, surface water samples were filtered on pre-128
M
AN
US
CR
IP
T
AC
CE
PT
ED
9 combusted GF/F filters (6 h, 450°C). For each filter 1.5 L of sea water was filtered. Immediately 129after filtration, filters were frozen in liquid nitrogen. Sediment samples were soaked in local 130
filtered water (GF/F 0.7 µm), and allowed to settle fora few seconds. The supernatant 131
containing fine organic particles, was then collected and filtered on pre-combusted (6 h, 450°C) 132
GF/F filters. Two subsamples of suspended particulate organic matter (POM) (one for SI 133
analyses and one for FA analyses), and four subsamples of sedimentary organic matter (SOM) 134
(two for SI and two for FA analyses) were taken at each sampling station/date. All samples were 135
stored in liquid nitrogen during transportation to the laboratory (CIBNOR, La Paz) and then 136
stored at -80°C until further preparations for analysis. 137
2.2 Stable isotopes analysis 138
For SI analyses, muscle samples were freeze dried for 24 h and ground into homogenized fine 139
powder using a ball mill. Muscle samples were not previously delipidated because bivalve 140
muscles generally show a very low content of lipids in this tissue (Lorrain et al., 2002), also C/N 141
ratios were measured and did not exceed 3.5, suggesting delipidation unnecessary (Post et al., 142
2007). A minimum of 0.250 mg of powder were then placed in tin capsules (8x5 mm) for 143
isotopic analyses. For SOM and POM, filters were scraped, and approximately 1.5 mg was 144
placed in tin capsules. 145
Samples were analyzed by continuous flow on a Flash EA2000 elemental analyzer coupled to a 146
Delta V Plus mass spectrometer (Thermo Fisher scientific). Reference gas calibration was 147
conducted using IAEA-600 Caffeine, IAEA-CH-6 Sucrose and IAEA-N-2 Ammonium 148
M
AN
US
CR
IP
T
AC
CE
PT
ED
10 Sulphate.Analytical precision, based on repeated analyses of an acetanilide working standard 149(Thermo scientific), was ± 0.1 ‰ for both δ13C and δ15N. Results are expressed in δ, with respect 150
to international standards (Vienna Pee Dee Belemnite for δ13C and atmospheric nitrogen for 151
δ15N), following the equation: δ13C or δ15N = [(Rsample/Rstandard)-1].10-3 (expressed in ‰) and 152 where R is 13C/12C or 15N/14N. 153 2.3 Lipid analysis 154 2.3.1 Lipid extraction 155
Samples of bivalve DG and Z. marina were ground in liquid nitrogen into a fine homogeneous 156
powder. Lipids were then extracted, between 0.2 and 0.4 g of material was placed in 6 ml of 157
chloroform/methanol (2:1; v/v) and sonicated at 4°C during 5 min, to ensure complete 158
extraction of lipids. Lipid extracts were stored at -20°C under nitrogen atmosphere until further 159
analysis. Lipids from the other potential food sources (POM and SOM) were extracted following 160
the same method, by resuspending filters directly in chloroform/methanol (2:1; v/v). 161
2.3.2 Separation of neutral lipids
162
Lipids from DG were separated into two fractions (neutral and polar lipids) following the 163
method described by Le Grand et al. (2014). An aliquot (1/6) of total lipid extract was 164
evaporated under nitrogen flux, recovered with 3 washes of 0.5 ml of chloroform/methanol 165
(98:2; v/v) and deposited at the top of a silica gel column (40 mm x 4 mm, silica gel 60A 63-200 166
µm rehydrated with 6% H2O (70-230 mesh)). NL were eluted with 10 ml of 167
M
AN
US
CR
IP
T
AC
CE
PT
ED
11 chloroform/methanol (98/2; v/v). NL fractions were collected in 20 ml glass vial containing 2.3 168µg of each internal standards (tricosanoic acid (C23:0), and cholestane). After evaporation to 169
dryness, NL fraction was recovered with 3 washes of 0.5 ml of chloroform/methanol (98:2; v/v) 170
and separated in two aliquots (1/2), one for FA analysis and the second for sterol analysis. 171
2.3.3 Methylation of FA
172
The NL fraction of DG, and an aliquot of the total lipid extract from food sources (POM, SOM, 173
and eelgrass) were evaporated to dryness under nitrogen flux. Acidic transesterification was 174
done to obtain fatty acid methyl esters (FAME). Briefly, 0.8 ml of H2SO4/methanol were added 175
(3.4 %; v/v) and lipid samples were then vortexed and heated at 100°C for 10 min. After cooling, 176
0.8 ml of hexane and 1.5 ml of distilled water saturated in hexane were added. Vials were 177
homogenized and centrifuged at 738 g, 1 min at 20°C. The aqueous phase (without FAME) was 178
discarded and the organic phase–containing FAME was washed two more times with distilled 179
water saturated in hexane. 180
2.3.4 Saponification and silylation of sterols
181
After evaporation to dryness of NL fraction of DG and of an aliquot of the total lipid extract from 182
food sources (POM, SOM, and eelgrass), 3 ml of KOH/methanol (5.6:94.4; v/v) were added; 183
samples were homogenized and placed under nitrogen atmosphere. Samples were then heated 184
at 100°C during 10 min. After cooling at room temperature, 0.8 ml of hexane and 1.5 ml of 185
distilled water saturated in hexane were added, followed by a homogenization and 186
M
AN
US
CR
IP
T
AC
CE
PT
ED
12 centrifugation at 738 g during 1 min at 20°C. The aqueous phase was discarded and the organic 187phase–containing sterols was washed two more times with distilled water saturated in hexane. 188
Before GC analysis, sterol samples were silylated to improve resolution for gas chromatography. 189
For that, organic phases obtained after saponification were evaporated to dryness under 190
nitrogen flux, then 100 µl of reagent (BSTFA:TMCS; 99:1; v/v) and 100 µl of pyridine were 191
added. Sterols samples were then heated at 70°C during 30 min. After cooling at room 192
temperature, 0.8 ml of hexane and 1.5 ml of distilled water saturated in hexane were added, 193
followed by a homogenization and centrifugation at 738 g during 1 min at 20°C. The aqueous 194
phase was discarded and the organic phase–containing silylated sterols was washed two more 195
times with distilled water saturated in hexane. 196
2.4Lipid analysis by Gas Chromatographs
197
2.4.1 Fatty acid Gas Chromatography analysis
198
FAME were analyzed in a Varian CP8400 gas chromatograph, programmed in temperature (from 199
0°C to 150°C at 50°C min-1, then to 170°C at 3.5°C min-1, to 185°C at 1.5°C min-1, to 225°C at 200
2.4°C min-1, and finally to 250°C at 5.5°C min-1 and maintained for 15 min) and equipped with 201
two splitless injectors and two flame-ionization detectors, with hydrogen as vector gas. FAME 202
were injected and separated simultaneously on two columns, one polar (ZBWAX: 30 m x 0.25 203
mm ID x 0.2 µm) and one apolar (ZB5HT: 30 m x 0.25 mm ID x 0.2 µm), with two different 204
polarities we can easily quantify FA in case of co-elution. FAME were identified by comparisons 205
of their retention time with those of commercial standards (Supelco 37 Component FAME Mix, 206
M
AN
US
CR
IP
T
AC
CE
PT
ED
13 the PUFA No.1 and No.3, and the Bacterial Acid Methyl Ester Mix from Sigma) and in-house 207standard mixtures from marine bivalves and micro- and macroalgae. FA compositions were 208
expressed as the mass percentage of the total FA content. 209
2.4.2 Sterol analysis by Gas Chromatography
210
Sterols were analyzed in a Shimadzu GC-2010 gas chromatograph (GC). Sterols were injected 211
and separated on a ZB5HT: 30 m x 0.25 mm ID x 0.2 µm (Phenomenex). The GC temperature 212
program was from 40°C to 100°C at 25°C.min-1, then to 250°C at 15°C.min-1, and finally to 315°C 213
at 3°C.min-1 and maintained for 10 min. GC was equipped of splitless injector slated at 280°C, 214
and a flame-ionization detector programmed at 250°C, with hydrogen as vector gas and an 215
interface maintained at 315°C. Sterols were then identified by comparisons of their retention 216
time with those of commercial standards and an in-house standard mixtures from marine 217
bivalves. Sterols relative proportions were expressed as the mass percentage of the total sterols 218
content. 219
2.5 Statistical Analysis 220
All data were first tested for normality (Shapiro-Wilks test) and homoscedasticity (Bartlett test). 221
If conditions were satisfied, parametric analyses were carried out, alternatively, non-parametric 222
analyses were used. Du to number of replicates, the statistical comparison of food sources were 223
impossible. SI variations between stations of bivalve muscles were compared by Student’s test 224
(t-tests). In total, 35 FA and 11 sterols having a mass proportion higher than 0.5 % of total FA or 225
sterol were considered for statistical analyses, and non-identified FA and sterols were grouped 226
M
AN
US
CR
IP
T
AC
CE
PT
ED
14 as “unknown”. Permutational variance analysis (PERMANOVA) permitted to test the interaction 227between periods and stations. As the interaction was significant, we analyzed the global spatial 228
difference of both FA and sterol compositions by PERMANOVA tests at each periods. Due to the 229
low proportion of zero in our dataset (less than 5 % for FA and 1.5% for sterols) Euclidean 230
distances or Euclidean-based methods were used throughout our study. To identify which were 231
the most discriminant FA and sterols between stations, a similarity of percentages analyses 232
(SIMPER) was used. Principal component analyses (PCA) were performed to investigate the 233
variation in lipid profiles between stations, for each species and both periods. FA and sterols 234
which accounted for more than 80 % of dissimilarity (SIMPER) were represented on PCA. For 235
each lipid fractions, pairwise comparisons (Wilcoxon tests) were carried out to explore spatial 236
differences for each sterol, at each periods. 237
Firstly, we considered the consistency between trophic structures derived from FA and sterol 238
tracers, at the species levels and at the two periods. Coinertia analyses (Dray et al., 2003) were 239
used to assess whether the same spatial and temporal patterns were retrieved with the two 240
sets of markers. RV coefficient (between 0 and 1) was used to quantify the degree of adequacy 241
between the two datasets, with high values indicating strong concordance. Secondly, we 242
considered the simple relationships among the principal biomarkers using Spearman’s rank 243
correlation (where rs is the correlation coefficient). When a correlation was detected, the model 244
(linear or not) selected by the Akaike Information Criterion (AIC) was adjusted and the normality 245
of residuals was checked using Q–Q plots. 246
M
AN
US
CR
IP
T
AC
CE
PT
ED
15 All statistical analyses and graphics were performed with the free software R (Core Team, 2017), 247with R Version 3.4.1 (2017 06 30). 248
M
AN
US
CR
IP
T
AC
CE
PT
ED
16 3. Results 2493.1 Spatial differences in biomarker compositions 250
3.1.1 Food sources 251
Spatial and seasonal trends were observed for all biomarker compositions (SI, FA and sterols) of 252
potential food compartments that contribute to bivalve diets. Nevertheless, precautions should 253
be taken as the low number of replicates (n ≤ 2 per stations), did not permit to carry out 254
statistical analyses to reveal spatial differences. 255
POM was more 15N-enriched in February than in August (Figure 2). For both seasons, the highest 256
δ15N values for POM were recorded from station 1, near the lagoon entrance (8.3‰ in February 257
and 5.5‰ in August) and the lowest at station 2, the furthest site from the bay mouth (5.9‰ in 258
February and 3.7‰ in August). At the both periods, the δ13C values of POM were close between 259
both stations but were quite 13C-depleted compared to SOM (Figure 2). The δ15N and δ13C of 260
SOM did not seem to differ between stations in February (Figure 2). As for POM, SOM samples 261
from station 1 were more 15N-enriched than samples from station 2. The same gradient also 262
occurred for δ13C, with station 1 which seems more 15N-enriched than station 2 (Figure 2). SOM 263
δ13C were close to those of Zostera marina detritus (Figure 2), between -13.1‰ and -8.6‰, in 264
February and in August. Z. marina detritus did not show big differences in δ15N and δ13C 265
between seasons with an average δ13C of -11.5‰ in February and August and an average δ15N 266
of 2.8‰ in February and 3.4‰ in August. 267
M
AN
US
CR
IP
T
AC
CE
PT
ED
17 The main FA found in POM and SOM were 16:0 for saturated FA (SFA), and 16:1n-7, 18:1n-9, 26818:1n-7 for monounsaturated FA (MUFA) (Supplementary Table 1). For polyunsaturated FA 269
(PUFA), 20:5n-3 and 22:6n-3 were the FA that exhibited the highest abundances in POM and 270
SOM; 18:3n-3 and 18:4n-3 showed highest values in POM and 20:4n-6 in SOM (Supplementary 271
Table 1). Station 2 samples had POM enriched in 18:4n-3 (8.3% in February and 5.3% in August) 272
and in 22:6n-3 (6.9% in February and 8.8% in August) (Supplementary Table 1). SOM showed 273
specifically higher values of 20:4n-6 at station 2 (5.8% in February, and 4.3% in August) 274
Figure 2. Stable Isotope (SI) bi-plot (δ13C and δ15N, mean values ±SD when n ≥ 2) of the adductor muscles of Spondylus crassisquama (represented by circles) and of their potential food sources (POM, SOM and seag seagrass), in February and August. Samples from station 1 are shown in light blue and from station 2 in green.
M
AN
US
CR
IP
T
AC
CE
PT
ED
18 (Supplementary Table 1). In February, Z. marina was characterized by high levels of 16:3n-3 275(6.7%) and 18:3n-3 (9.7%) (Supplementary Table 1). In August, the proportion of 18:3n-3 276
reached 33.6% of total FA, whereas 16:3n-3 proportion decreased to 3.7%. The proportion of 277
18:2n-6, which was at low levels in February (1.9%), reached 17.4% in Z. marina sampled in 278
August (Supplementary Table 1). 279
The main sterols found in POM were Cholesterol, Brassicasterol, Norcholesterol, 24-280
Methylenecholesterol, Isofucosterol and β-Sitosterol. At both periods, proportions of 281
Cholesterol in POM collected at station 1 showed higher proportions than station 2 (40.1% 282
against 34% in February, and 56.1% against 38% in August) (Supplementary Table 2). 283
Brassicasterol was present at similar levels in POM at both stations in February (15.4% and 284
15.5%), but was lower at station 1 in August (7.6%) (Supplementary Table 2). The 24-285
Methylenecholesterol was more abundant in the POM in February (9.0% at station 1 and 12.8% 286
at station 2) (Supplementary Table 2). Stigmasterol was no detected in any samples of POM in 287
February and only 2.9% at station 1 in August, but presented 26.4% of total sterols of POM 288
sample at station 2 in August. In August, the ratio 24-Methylenecholesterol / Brassicasterol was 289
more than twice higher in POM at station 1 (0.8) than at station 2 (0.3). Predominant sterols 290
found in SOM were the same as POM except for Cholestanol, and Campesterol that were 291
principally found in SOM (only detected in SOM for Campesterol). At both months, SOM seemed 292
to present a higher abundance of Norcholesterol and Cholestanolat station 1 than at station 2 293
(Supplementary Table 2). Inversely, Cholesterol, Brassicasterol, and β-Sitosterol were present in 294
higher proportions in SOM collected at station 2 (Supplementary Table 2). The main eelgrass 295
M
AN
US
CR
IP
T
AC
CE
PT
ED
19 sterols were β-Sitosterol, Stigmasterol and Cholesterol (Supplementary Table 2). Stigmasterol 296showed higher proportions in eelgrass sampled in August (20.9 vs 10.3% in February), whereas 297
Cholesterol was in much higher proportions in February (16.7% vs 3.8% in August). 298
3.1.2 Bivalves 299
Although spatial differences were quantitatively low, δ13C values significantly differed between 300
stations in February, (-18.4‰ at station 1 and -19.1‰ at station 2) (t-test, p < 0.001, df = 16.70, 301
t = 4.21; Figure 2). In August, δ13C did not differ significantly between stations (t-test, p > 0.05, 302
df = 15.54, t = 0.31), with individuals from station 1 presenting values of -19.1‰ and from 303
station 2 of -19.2‰ (Figure 2). δ15N differed significantly between stations for both sampling 304
dates, with δ15N values higher at station 1 than at station 2, this difference being more 305
pronounced in August. In February, δ15N significantly decreased in muscles along the transect (t-306
test, p < 0.001, df = 17.76, t = 7.56), from 8.7‰ at station 1, to 7.6‰ at station 2 (Figure 2). In 307
August, δ15N significantly differed between station 1 (8.8‰) and station 2 (7.9‰) (t-test, p < 308
0.001, df = 16.7, t = 5.12; Figure 2). 309
Because significant interactions were found for FA proportions between periods and stations 310
(PERMANOVA, p-value < 0.01, df = 1, F = 10.14, R² = 0.13), and because sterol proportions 311
presented same interactions (PERMANOVA, p-value < 0.01, df = 1, F = 4.45, R² = 0.09), we 312
compared spatial differences at each period. 313
M
AN
US
CR
IP
T
AC
CE
PT
ED
20 The PCA based on NL FA and sterols composition shows the differences between stations and 314lipid biomarkers responsible for 80% of these differences (Figure 3). 315
In February, significant spatial differences were found for both NL FA composition 316
(PERMANOVA, p < 0.001, df = 2, F = 5.45, R² = 0.3), and sterol composition (PERMANOVA, p-317
value < 0.05, df = 1, F = 10.02, R² = 0.56). At this period individuals from station 1 were 318
characterized by higher levels in 20:4n-6 and 22:6n-3 (Figure 3 and Supplementary table 3) and 319
were associated to higher values of β-Sitosterol (Figure 3 and Supplementary table 4). 320
Individuals from station 2 tended to be characterized by FA 18:1n-7, 18:3n-3 (Figure 3 and 321
Supplementary table 3) and were not associated to any particular phytosterol. 322
Figure 3. Principal Component Analyses (PCA) of neutral lipids (NL) fatty acids (FA) and sterols compositions (mass %) of Spondylus crassisquama digestive gland in February (A and C) and August (B and D). Only FA and sterols that account for > 80% of the contribution of dissimilarity between stations are shown.
M
AN
US
CR
IP
T
AC
CE
PT
ED
21 In August, NL FA compositions differed among sampling location (PERMANOVA, p < 0.001, df = 3232, F = 34.11, R² = 0.74). The same was found forsterol composition (PERMANOVA, p-value < 324
0.01, df = 1, F = 13.55, R² = 0.63). Here again, a clear spatial pattern was observed along the first 325
axis of the PCA (Figure 3). We observed significantly decreasing values of 20:5n-3 and 16:1n-7 326
from the mouth to the inner bay (Figure 3 and Supplementary table 3). Even if PCA revealed a 327
contribution of 24-Methylenecholesterol (Figure 3), pairwise comparisons revealed no 328
significant spatial differences (Supplementary table 4). Individuals from station 2 were 329
characterized by higher proportions of 18:1n-9 and 18:3n-3 (Figure 3 and Supplementary table 330
3), and by significantly higher proportions of Campesterol, Stigmasterol, Brassicasterol (Figure 3 331
and Supplementary table 4). 332
M
AN
US
CR
IP
T
AC
CE
PT
ED
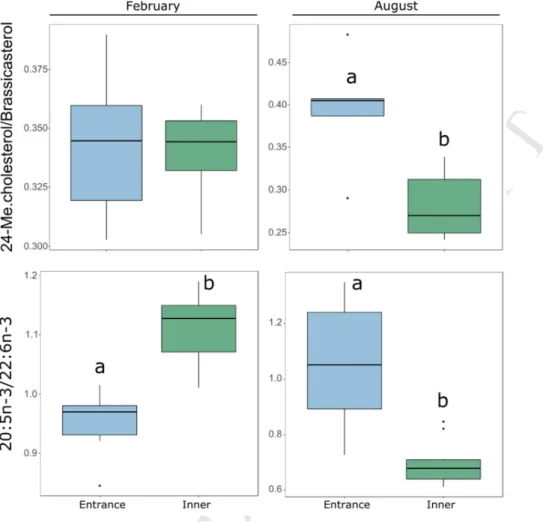
22 We calculated the ratio between 24-Methylenecholesterol and Brassicasterol and the ratio 333between 20:5n-3 and 22:6n-3 (EPA/DHA) (Figure 4).In February, the EPA/DHA was significantly 334
higher at the inner site, while no difference was found for the 24-335
Methylenecholesterol/Brassicasterol. In August, the two ratios displayed the same pattern, 336
being the highest near the entrance of the lagoon. 337
3.2 Comparisons of different biomarkers 338
Figure 4. Boxplot of the ratios of 24-Methylenecholesterol/Brassicasterol (n=5) and of 20:5n-3/22:6n-3 (EPA/DHA; n=10) of Spondylus crassisquama at the both periods. Different letters indicate significant differences (Wilcoxon test, at significant level α < 0.05). 24-ME.cholesterol: 24-Methylenecholesterol.
M
AN
US
CR
IP
T
AC
CE
PT
ED
23 We found a robust correlation between the two ordinations of FA and sterols. This relationship 339was stronger in February (RV = 0.71) than in August (RV = 0.6). Both co-inertia analyses were 340
significant (p-value < 0.01). Significant Spearman’s rank correlations were found between 341
EPA/DHA and 24-Me/Bra (rs = 0.7, p-values < 0.05; Figure 5). Both ratios were positively 342
correlated to the 16:1n-7 (0.33 < rs < 0.54, p-values < 0.05; Figure 6). Inversely, ratios were 343
negatively correlated to Campesterol (-0.76 < rs < -0.78, p-values < 0.05; Figure 5), as for 344
Stigmasterol (-0.69 < rs < -0.91, p-values < 0.05; Figure 5). Interestingly, Stigmasterol biomarker 345
was strongly and positively correlated with Campesterol (rs = 0.8, p-values < 0.05; Figure 5). In 346
contrast, it was negatively correlated to 20:5n-3 (rs = -0.48, p-values < 0.05; Figure 5). No 347
correlation was observed between Stigmasterol and 16:1n-7 (rs= −0.39, P > 0.05; Figure 5). 24-348
Methylenecholetrol was strongly correlated with EPA/DHA ratio (rs= 0.73, P < 0.05; Figure 5). 349
M
AN
US
CR
IP
T
AC
CE
PT
ED
24 350 351Figure 5. Correlations between the three biomarkers (Spearman’s test): stable isotope rations (carbon and nitrogen; ‰), neutral lipid fatty acids, and sterols (mass %) for Spondylus crassisquama. The colored circles represent significant correlations between two tracers (p-value < 0.05). The numbers inside cells are the associated Spearman’s correlation.
M
AN
US
CR
IP
T
AC
CE
PT
ED
25 4. Discussion 352In coastal lagoons, investigating the nature of food sources consumed by bivalves can provide a 353
spatially and temporally integrated overview of nutrient transfers within the system and across 354
ecosystem boundaries (e.g lagoon primary production vs inputs from coastal ocean). Here, the 355
coupled approach used revealed quite powerful to unravel spatial patterns in the trophic 356
ecology of S. crassiquama. Our results point out the significant role played by oceanic inputs in 357
the ecological functioning of coastal lagoons, including the support of bivalve populations. This 358
study also highlights the role played by remineralization in the food web of the inner lagoon. 359
4.1 Spatial differences in biomarker compositions 360
The similarity of carbon SI composition observed between POM and bivalves isotopic 361
composition is in accordance with a direct and non-selective feeding (Vander Zanden and 362
Rasmussen, 2001). Although significant differences were observed between stations especially 363
for δ15N, the extent of these differences was low, typically below 1.5 ‰ suggesting that no 364
major contrast occurred in the diet of this species in the lagoon. Individuals sampled close to the 365
mouth displayed the highest δ15N, while those from the inner lagoon displayed the lowest δ15N. 366
This pattern matches the one displayed in POM, suggesting that bivalve δ15N directly reflect the 367
composition of POM, and their diet does not drastically differ from its composition (Coma et al., 368
2001). Consequently, δ15N indicates that oceanic inputs affecting the composition of POM are 369
transferred into the local food web through their consumption by suspension-feeding bivalves 370
of the lagoon. Ojo de Liebre is located in an arid region, with virtually no freshwater inputs 371
(Phleger and Ewing, 1962). In contrast, the open ocean facing the lagoon can induce 15 N-372
M
AN
US
CR
IP
T
AC
CE
PT
ED
26 enriched nutrient or plankton pulses that could explain the spatial pattern observed here 373(Altabet et al., 1999). The higher values at the entrance of the lagoon tend to be close to those 374
described in the region (McMahon et al., 2013; Olson et al., 2010). It seems therefore that the 375
lagoon of Ojo de Liebre, at least in its proximal part, is significantly influenced by its nearshore 376
hydrological conditions, through the entrance of oceanic originating organic matter/nutrients. 377
At both seasons, global FA and sterol compositions differed, revealing spatial differences in the 378
diet of S. crassisquama. In February, even though some biomarkers were significantly different 379
between stations, the spatial pattern was quite slight, revealing only small dietary differences. 380
Individuals from the mouth of the lagoon were characterized by higher proportions of 22:6n-3 381
and β-Sitosterol. The presence of 22:6n-3 suggests a dominance of dinoflagellates in the diet of 382
S. crassisquama (Alfaro et al., 2006; Parrish, 2009). Although β-Sitosterol was the major sterol
383
found in eelgrass, it is not possible to conclude that β-Sitosterol found in bivalves DG is obtained 384
from eelgrass detritus, as this sterol was also found in POM and SOM. High proportions of β-385
Sitosterol have also been reported in haptophytes and diatoms in the literature (Napolitano et 386
al., 1993; Soudant et al., 1998). In fact, most phytosterols found in this study were found in all 387
POM, SOM, and eelgrass samples, making difficult to decipher their origin among potential 388
foods sources of bivalves. 389
In August, a clear gradient from the mouth to the center of the bay suggested a more important 390
spatial diet shift. Individuals from the most oceanic stations (station 1) were characterized by 391
higher levels of 16:1n-7 as well as 20:5n-3, but also by higher levels of 24-Methylenecholesterol. 392
M
AN
US
CR
IP
T
AC
CE
PT
ED
27 The presence of these lipid biomarker, as well as higher EPA/DHA and 24-Me./Bra ratios, 393highlights the importance of diatoms in the diet of bivalves from this station during this period 394
(Kharlamenko et al., 2001; Volkman, 2003; Alfaro et al., 2006; Lavaud et al., 2018). This supply in 395
diatoms at the mouth of the lagoon supports the hypothesis of oceanic inputs and intake of 396
primary production from coastal waters suggested by 15N enrichment. Du et al. (2015) showed 397
in the Northern California current that diatoms proliferate during strong upwelling events (from 398
April to September), when nutrients and turbulence are relatively high. The fact that oceanic 399
water masses present the same taxonomic dominances supports again the hypothesis that 400
oceanic organic matter enters the lagoon and supports local the food web. However, the 401
diminution of diatoms importance at the inner station suggests that oceanic inputs do not 402
extend to the whole bay. At both seasons, in the center of the bay, S. crassisquama was 403
characterized by high levels of C18 PUFA (18:3n-3) and/or MUFA (18:1n-9), but also by high 404
proportions of Brassicasterol, Campesterol, or Stigmasterol. These FA can be found in various 405
primary producers, such as macroalgae (Nelson et al., 2002), higher plants (Valitova et al., 406
2016), seagrass (Kharlamenko et al., 2001; Jaffé et al., 2006; Volkman et al., 2008), various 407
phytoplankton taxa (Soudant et al., 1998; Dalsgaard et al., 2003), including dinoflagellates 408
(Soudant et al., 1998; Kharlamenko et al., 2001; Hurtado et al., 2012; Nerot et al., 2015) and are 409
very abundant in various ciliate species, which contribute to the marine microbial food web 410
(Zhukova and Kharlamenko, 1999). Consequently, bivalves from the center of the bay seem to 411
rely, at least partly, on microheterotrophs (dinoflagellates, flagellates, ciliates), hence revealing 412
the influence of the microbial food web in this part of the lagoon in summer. The lower 413
M
AN
US
CR
IP
T
AC
CE
PT
ED
28 EPA/DHA and 24-Me./Bra ratios also support the hypothesis of the presence of dinoflagellates 414in the diet of this species (Alfaro et al., 2006; Kelly and Scheibling, 2012; Lavaud et al., 2018). 415
Campesterol, has been reported in small amount in some species of diatoms like Chaetoceros 416
calcitrans (Yamauguchi et al., 1986; Soudant et al., 1998; Mohammady, 2004). The contrast in
417
the spatial repartition of Campesterol (higher at inner station) and 24-Methylenecholesterol 418
(higher at entrance station) suggests different diatom assemblages and the contribution of 419
different diatom species in the diet of bivalves within the lagoon. In addition, Campesterol was 420
absent from POM samples at both stations and for both seasons, whereas it was present in non-421
negligible amounts in SOM. The presence of this sterol in bivalves might therefore suggest a 422
contribution of SOM in the diet of bivalves, through the resuspension of sediment. 423
The contribution of eelgrass detritus to the diet of bivalves, although already reported as a 424
secondary dietary source in enclosed coastal systems (Schaal et al., 2008) seems unlikely 425
because of the lack of 13C-enrichment in bivalves. However, lipid biomarkers as 18:3n-3 or 426
Stigmasterol seem to reveal the presence of eelgrass in bivalve diets, and in particular at the 427
inner station. Seagrass cover a surface of more than 590 km² in the Ojo de Liebre lagoon 428
(Riosmena-Rodríguez et al., 2013), and are known to produce large amounts of detritus, which 429
can be buried in the sediment, exported to the adjacent nearshore environment, or locally 430
transferred into the food web (Hyndes and Lavery, 2005; Schaal et al., 2008). Here, SI ratios 431
measured in sedimentary organic matter revealed strong 13C enrichment, suggesting that 432
detritus may be major components of sediment in the Ojo de Liebre lagoon. Although these 433
M
AN
US
CR
IP
T
AC
CE
PT
ED
29 high δ13C in SOM could also reveal the importance of epiphytes, which commonly display a SI 434composition similar to their seagrass host, the highly degraded nature of sediments suggests a 435
dominance of refractory compounds, which are abundant in seagrass (Fourqurean and Schrlau, 436
2003). In contrast with sediment, POM did not seem to reflect any significant contribution of 437
seagrass, which would have resulted in more 13C-enriched SI composition than what was 438
observed. Only a slight 13C-enrichment could be found in POM at stations inside the lagoon that 439
could be due to abundant seagrass detritus in suspension on the water column, but the lack of 440
replicates prevents any definitive conclusion about seagrass contribution to the POM pool. 441
442
4.2 Comparison of different lipid biomarkers 443
Comparing sterol composition with FA and SI analysis brings some interesting insights into the 444
potential contribution of benthic primary producers in the diet of bivalve species. The 445
compositions in FA and sterols were strongly correlated according to the RV coefficient of the 446
co-inertia analyses. The higher RV coefficient in February could be explained by the fact that the 447
diet of bivalves was more spatially homogeneous in the winter period. Spearman’s correlations 448
allowed to validate the use of 24Me./Bra as a maker of predominance of diatoms or 449
dinoflagellates in the bivalve diet. Indeed, this ratio was strongly positivley correlated with 450
EPA/DHA ratio, which is currently used in literature (Le Croizier et al., 2016; Parrish, 2009). Both 451
ratios were also positively correlated to 16:1n-7, which confirmed their usefulness to unravel 452
the predominance of diatoms in the diet of bivalves (Dalsgaard et al., 2003; Richoux and 453
Froneman, 2008). However, Campesterol was negatively correlated to both ratios, which could 454
M
AN
US
CR
IP
T
AC
CE
PT
ED
30 be surprising for a known diatom biomarkers. In fact, Campesterol is reported to be biomarker 455of Bacillariophyceae (Soudant et al., 1998; Mohammady, 2004), which seems to be a group of 456
diatoms only predominant in the inner lagoon. Besides, Stigmasterol, which could be considered 457
as biomarker of eelgrass (Jaffé et al., 2006; Volkman et al., 2008), is highly and positively 458
correlated to 18:3n-3 also known as biomarker of eelgrass (Kharlamenko et al., 2001). This 459
correlation and high amount of these lipid biomarkers found in seagrass detritus samples, 460
support their utilization as biomarker of seagrass detritus in the lagoon of Ojo de Liebre. 461
5. Conclusion 462
Stable isotopes and fatty acids and sterols proved being highly complementary tools to identify 463
spatio-temporal patterns in the Ojo de Liebre lagoon. The entrance of the lagoon seems to 464
reflect coastal oceanic processes, supporting the hypothesis of significant oceanic primary 465
production pulses into the lagoon. Although significant, the influence of oceanic inputs does not 466
extend to the whole lagoon. The center of the lagoon seems to be more local processes-driven, 467
with a recycled organic matter-based food web and the role of seagrass suggested by FA and 468
sterols analysis. Our results revealed strong correlations between FA and sterols in bivalves. 469
Consequently, sterol compositions could be used as complementary and/or substitute 470
biomarkers to FA. The approach used in this study brought some interesting new insights on the 471
potential contribution of primary producers to bivalve diets. This coupling brings new 472
information about phytoplankton assemblages and diet composition differences at low 473
M
AN
US
CR
IP
T
AC
CE
PT
ED
31 taxonomic level, which seems to be an improvement compared to the broader discrimination 474power and SI and FA. 475
M
AN
US
CR
IP
T
AC
CE
PT
ED
32 Acknowledgements 477This study was supported by the ECOS-ANUIES program (PROPHYMUS project), the "Laboratoire 478
d'Excellence" LabexMER (ANR-10-LABX-19) and co-funded by a grant from the French 479
government under the program "Investissements d'Avenir". MMR’s PhD fellowship was 480
provided by the French Research Ministry and Region Bretagne. We would like to thank the 481
contribution of the Guerrero Negro unit of CIBNOR for hosting the first steps of sample 482
preparation after fieldwork, the LIPIDOCEAN analytical facility for hosting all fatty acid analyses, 483
and the Pôle Spectrométrie Océan (Clément Tanvet) for running stable isotope analyses. 484
We thank the “Pepe” Jose Alfredo Saenz Arce crew for the fieldwork, as well as Rosa Linda 485
Salgado Garcia, and Laura Guzman for their precious help during sampling and dissections, and 486
Dr. Elena Palacios and Dr. Kitty Arredondo Vega, for the laboratory facilities provided for the 487
preparation of samples at CIBNOR La Paz. We thank the Reserva de la biosfera desierto de “el 488
Vizcaino” for their help and support in carrying out sampling for this study. Authors would like 489
to thank Aurelien Boye and Olivier Gauthier for their precious help and advices about statistical 490
analyses. 491
M
AN
US
CR
IP
T
AC
CE
PT
ED
33 Literature cited 493Alfaro, A.C., Thomas, F., Sergent, L., Duxbury, M., 2006. Identification of trophic interactions 494
within an estuarine food web (northern New Zealand) using fatty acid biomarkers and stable 495
isotopes. Estuar. Coast. Shelf Sci., Applying the Ecohydrology approach to the Guadiana estuary 496
and coastal areas: lessons learned from dam impacted ecosystems 70, 271–286. 497
https://doi.org/10.1016/j.ecss.2006.06.017 498
Altabet, M.A., Pilskaln, C., Thunell, R., Pride, C., Sigman, D., Chavez, F., Francois, R., 1999. The 499
nitrogen isotope biogeochemistry of sinking particles from the margin of the Eastern North 500
Pacific. Deep Sea Res. Part Oceanogr. Res. Pap. 46, 655–679. https://doi.org/10.1016/S0967-501
0637(98)00084-3 502
Bec, A., Perga, M.-E., Desvilettes, C., Bourdier, G., 2010. How well can the fatty acid content of 503
lake seston be predicted from its taxonomic composition? Freshw. Biol. 55, 1958–1972. 504
Cabello-Pasini, A., Muñiz-Salazar, R., Ward, D.H., 2003. Annual variations of biomass and 505
photosynthesis in Zostera marina at its southern end of distribution in the North Pacific. Aquat. 506
Bot. 76, 31–47. https://doi.org/10.1016/S0304-3770(03)00012-3 507
Carlier, A., Riera, P., Amouroux, J.-M., Bodiou, J.-Y., Escoubeyrou, K., Desmalades, M., Caparros, 508
J., Grémare, A., 2007. A seasonal survey of the food web in the Lapalme Lagoon (northwestern 509
Mediterranean) assessed by carbon and nitrogen stable isotope analysis. Estuar. Coast. Shelf Sci. 510
73, 299–315. https://doi.org/10.1016/j.ecss.2007.01.012 511
M
AN
US
CR
IP
T
AC
CE
PT
ED
34 Clavier, J., Chauvaud, L., Amice, E., Lazure, P., Van Der Geest, M., Labrosse, P., Diagne, A., 512Carlier, A., Chauvaud, S., 2014. Benthic metabolism in shallow coastal ecosystems of the Banc 513
d’Arguin, Mauritania. Mar. Ecol. Prog. Ser. 501, 11–23. 514
Coma, R., Ribes, M., Gili, J.-M., Hughes, R.N., 2001. The ultimate opportunists: consumers of 515
seston. Mar. Ecol. Prog. Ser. 219, 305–308. 516
Core Team, R., 2017. R: A language and environment for statistical computing. R Foundation for 517
Statistical Computing, Vienna, Austria. URL https://www.R-project.org/. 518
Dalsgaard, J., St. John, M., Kattner, G., Müller-Navarra, D., Hagen, W., 2003. Fatty acid trophic 519
markers in the pelagic marine environment. Adv. Mar. Biol. 46, 225–340. 520
https://doi.org/10.1016/S0065-2881(03)46005-7 521
Dame, R.F., 1993. The role of bivalve filter feeder material fluxes in estuarine ecosystems, in: 522
Bivalve Filter Feeders. Springer, pp. 245–269. 523
Desvilettes, C.H., Bourdier, G., Amblard, C.H., Barth, B., 1997. Use of fatty acids for the 524
assessment of zooplankton grazing on bacteria, protozoans and microalgae. Freshw. Biol. 38, 525
629–637. 526
Dray, S., Chessel, D., Thioulouse, J., 2003. Co‐inertia analysis and the linking of ecological data 527
tables. Ecology 84, 3078–3089. 528
M
AN
US
CR
IP
T
AC
CE
PT
ED
35 Du, X., Peterson, W., O’Higgins, L., 2015. Interannual variations in phytoplankton community 529structure in the northern California Current during the upwelling seasons of 2001-2010. Mar. 530
Ecol. Prog. Ser. 519, 75–87. 531
Fenton, G.E., Ritz, D.A., 1988. Changes in carbon and hydrogen stable isotope ratios of 532
macroalgae and seagrass during decomposition. Estuar. Coast. Shelf Sci. 26, 429–436. 533
Fourqurean, J.W., Schrlau, J.E., 2003. Changes in nutrient content and stable isotope ratios of C 534
and N during decomposition of seagrasses and mangrove leaves along a nutrient availability 535
gradient in Florida Bay, USA. Chem. Ecol. 19, 373–390. 536
Gattuso, J.-P., Frankignoulle, M., Wollast, R., 1998. Carbon and carbonate metabolism in coastal 537
aquatic ecosystems. Annu. Rev. Ecol. Syst. 29, 405–434. 538
Giner, J.-L., Zhao, H., Dixon, M.S., Wikfors, G.H., 2016. Bioconversion of 13C-labeled microalgal 539
phytosterols to cholesterol by the Northern Bay scallop, Argopecten irradians irradians. Comp. 540
Biochem. Physiol. B Biochem. Mol. Biol. 192, 1–8. 541
Holden, M.J., Patterson, G.W., 1991. Absence of sterol biosynthesis in oyster tissue culture. 542
Lipids 26, 81–82. 543
Hurtado, M.A., Racotta, I.S., Arcos, F., Morales-Bojórquez, E., Moal, J., Soudant, P., Palacios, E., 544
2012. Seasonal variations of biochemical, pigment, fatty acid, and sterol compositions in female 545
Crassostrea corteziensis oysters in relation to the reproductive cycle. Comp. Biochem. Physiol. B
546
Biochem. Mol. Biol. 163, 172–183. 547
M
AN
US
CR
IP
T
AC
CE
PT
ED
36 Hyndes, G.A., Lavery, P.S., 2005. Does transported seagrass provide an important trophic link in 548unvegetated, nearshore areas? Estuar. Coast. Shelf Sci. 63, 633–643. 549
https://doi.org/10.1016/j.ecss.2005.01.008 550
Jaffé, R., Rushdi, A.I., Medeiros, P.M., Simoneit, B.R.T., 2006. Natural product biomarkers as 551
indicators of sources and transport of sedimentary organic matter in a subtropical river. 552
Chemosphere 64, 1870–1884. https://doi.org/10.1016/j.chemosphere.2006.01.048 553
Kanazawa, A., 2001. Sterols in marine invertebrates. Fish. Sci. 67, 997–1007. 554
Kelly, J.F., 2000. Stable isotopes of carbon and nitrogen in the study of avian and mammalian 555
trophic ecology. Can. J. Zool. 78, 1–27. 556
Kelly, J.R., Scheibling, R.E., 2012. Fatty acids as dietary tracers in benthic food webs. Mar. Ecol. 557
Prog. Ser. 446, 1–22. 558
Kharlamenko, V.I., Kiyashko, S.I., Imbs, A.B., Vyshkvartzev, D.I., 2001. Identification of food 559
sources of invertebrates from the seagrass Zostera marina community using carbon and sulfur 560
stable isotope ratio and fatty acid analyses. Mar. Ecol. Prog. Ser. 220, 103–117. 561
Kraak, M.H.S., Scholten, M.C.T., Peeters, W.H.M., de Kock, W.C., 1991. Biomonitoring of heavy 562
metals in the Western European rivers Rhine and Meuse using the freshwater mussel Dreissena 563
polymorpha. Environ. Pollut. 74, 101–114. https://doi.org/10.1016/0269-7491(91)90107-8
M
AN
US
CR
IP
T
AC
CE
PT
ED
37 Lavaud, R., Artigaud, S., Le Grand, F., Donval, A., Soudant, P., Flye-Sainte-Marie, J., Strohmeier, 565T., Strand, Ø., Leynaert, A., Beker, B., 2018. New insights into the seasonal feeding ecology of 566
Pecten maximus using pigments, fatty acids and sterols analyses. Mar. Ecol. Prog. Ser. 590, 109–
567
129. 568
Le Croizier, G., Schaal, G., Gallon, R., Fall, M., Le Grand, F., Munaron, J.-M., Rouget, M.-L., 569
Machu, E., Le Loc’H, F., Laë, R., 2016. Trophic ecology influence on metal bioaccumulation in 570
marine fish: Inference from stable isotope and fatty acid analyses. Sci. Total Environ. 573, 83– 571
95. 572
Le Grand, F.L., Soudant, P., Siah, A., Tremblay, R., Marty, Y., Kraffe, E., 2014. Disseminated 573
Neoplasia in the soft-shell Clam Mya arenaria: membrane lipid composition and functional 574
parameters of circulating cells. Lipids 49, 807–818. https://doi.org/10.1007/s11745-014-3917-4 575
Lefebvre, S., Harma, C., Blin, J.-L., 2009. Trophic typology of coastal ecosystems based on δ13C 576
and δ15N ratios in an opportunistic suspension feeder. Mar. Ecol. Prog. Ser. 390, 27–37. 577
Lorrain, A., Paulet, Y.-M., Chauvaud, L., Savoye, N., Donval, A., Saout, C., 2002. Differential δ13C 578
and δ15N signatures among scallop tissues: implications for ecology and physiology. J. Exp. Mar. 579
Biol. Ecol. 275, 47–61. https://doi.org/10.1016/S0022-0981(02)00220-4 580
Mann, K.H., 1982. Ecology of Coastal Waters: A Systems Approach. University of California 581
Press. 582
M
AN
US
CR
IP
T
AC
CE
PT
ED
38 Marchais, V., Schaal, G., Grall, J., Lorrain, A., Nerot, C., Richard, P., Chauvaud, L., 2013. Spatial 583variability of stable isotope Ratios in Oysters (Crassostrea gigas) and primary producers along an 584
estuarine gradient (Bay of Brest, France). Estuaries Coasts 36, 808–819. 585
https://doi.org/10.1007/s12237-012-9584-x 586
Martínez, M.L., Intralawan, A., Vázquez, G., Pérez-Maqueo, O., Sutton, P., Landgrave, R., 2007. 587
The coasts of our world: Ecological, economic and social importance. Ecol. Econ., Ecological 588
Economics of Coastal Disasters 63, 254–272. https://doi.org/10.1016/j.ecolecon.2006.10.022 589
McMahon, K.W., Hamady, L.L., Thorrold, S.R., 2013. Ocean ecogeochemistry: a review. 590
Oceanogr. Mar. Biol. Annu. Rev. 51, 327–374. 591
Mohammady, N.G., 2004. Total, free and conjugated sterolic forms in three microalgae used in 592
mariculture. Z. Für Naturforschung C 59, 619–624. 593
Napolitano, G.E., Ackman, R.G., Silva-Serra, M.A., 1993. Incorporation of dietary sterols by the 594
sea scallop Placopecten magellanicus (Gmelin) fed on microalgae. Mar. Biol. 117, 647–654. 595
Nelson, M.M., Leighton, D.L., Phleger, C.F., Nichols, P.D., 2002. Comparison of growth and lipid 596
composition in the green abalone, Haliotis fulgens, provided specific macroalgal diets. Comp. 597
Biochem. Physiol. B Biochem. Mol. Biol. 131, 695–712. https://doi.org/10.1016/S1096-598
4959(02)00042-8 599
Nerot, C., Meziane, T., Schaal, G., Grall, J., Lorrain, A., Paulet, Y.-M., Kraffe, E., 2015. Spatial 600
changes in fatty acids signatures of the great scallop Pecten maximus across the Bay of Biscay 601
M
AN
US
CR
IP
T
AC
CE
PT
ED
39 continental shelf [WWW Document]. URL http://ac.els-cdn.com.scd-proxy.univ-602 brest.fr/S0278434315300522/1-s2.0-S0278434315300522-main.pdf?_tid=cc01133c-2f39-11e7-603 8950-00000aab0f02&acdnat=1493731274_d207b602cfd94a22be277a4effaa33b7 (accessed 604 5.2.17). 605Nixon, S.W., 1982. Nutrient dynamics, primary production and fisheries yields of lagoons. 606
Oceanol. Acta Spec. Issue 357–371. 607
Olson, R.J., Popp, B.N., Graham, B.S., López-Ibarra, G.A., Galván-Magaña, F., Lennert-Cody, C.E., 608
Bocanegra-Castillo, N., Wallsgrove, N.J., Gier, E., Alatorre-Ramírez, V., Ballance, L.T., Fry, B., 609
2010. Food-web inferences of stable isotope spatial patterns in copepods and yellowfin tuna in 610
the pelagic eastern Pacific Ocean. Prog. Oceanogr., CLimate Impacts on Oceanic TOp Predators 611
(CLIOTOP) 86, 124–138. https://doi.org/10.1016/j.pocean.2010.04.026 612
Parrish, C.C., 2009. Essential fatty acids in aquatic food webs, in: Lipids in Aquatic Ecosystems. 613
Springer, pp. 309–326. 614
Parrish, C.C., Abrajano, T.A., Budge, S.M., Helleur, R.J., Hudson, E.D., Pulchan, K., Ramos, C., 615
2000. Lipid and phenolic biomarkers in marine ecosystems: analysis and applications, in: Marine 616
Chemistry. Springer, pp. 193–223. 617
Peterson, B.J., Fry, B., 1987. Stable isotopes in ecosystem studies. Annu. Rev. Ecol. Syst. 18, 293– 618
320. 619
M
AN
US
CR
IP
T
AC
CE
PT
ED
40 Phleger, F.B., Ewing, G.C., 1962. Sedimentology and oceanography of coastal Lagoons in Baja 620California, Mexico. Geol. Soc. Am. Bull. 73, 145. https://doi.org/10.1130/0016-621
7606(1962)73[145:SAOOCL]2.0.CO;2 622
Post, D.M., 2002. Using stable isotopes to estimate trophic position: models, methods, and 623
assumptions. Ecology 83, 703–718. 624
Post, D.M., Layman, C.A., Arrington, D.A., Takimoto, G., Quattrochi, J., Montaña, C.G., 2007. 625
Getting to the fat of the matter: models, methods and assumptions for dealing with lipids in 626
stable isotope analyses. Oecologia 152, 179–189. https://doi.org/10.1007/s00442-006-0630-x 627
Richoux, N.B., Froneman, P.W., 2008. Trophic ecology of dominant zooplankton and macrofauna 628
in a temperate, oligotrophic South African estuary: a fatty acid approach. Mar. Ecol. Prog. Ser. 629
357, 121–137. 630
Riosmena-Rodríguez, R., Muñiz-Salazar, R., López-Calderón, J., Torre-Cosio, J., Meling, A., Talbo, 631
S.L., Sage, G.K., Ward, D.H., Cabello-Pasini, A., 2013. Conservation status of Zostera marina 632
populations at Mexican Pacific. Adv. Environ. Res. 27, 35–63. 633
Schaal, G., Riera, P., Leroux, C., 2008. Trophic coupling between two adjacent benthic food webs 634
within a man-made intertidal area: a stable isotopes evidence. Estuar. Coast. Shelf Sci. 77, 523– 635
534. https://doi.org/10.1016/j.ecss.2007.10.008 636
M
AN
US
CR
IP
T
AC
CE
PT
ED
41 Soudant, P., Le Coz, J.-R., Marty, Y., Moal, J., Robert, R., Samain, J.-F., 1998. Incorporation of 637microalgae sterols by scallop Pecten maximus (L.) larvae. Comp. Biochem. Physiol. A. Mol. 638
Integr. Physiol. 119, 451–457. 639
Valitova, J.N., Sulkarnayeva, A.G., Minibayeva, F.V., 2016. Plant sterols: diversity, biosynthesis, 640
and physiological functions. Biochem. Mosc. 81, 819–834. 641
Vander Zanden, M.J., Rasmussen, J.B., 2001. Variation in δ15N and δ13C trophic fractionation: 642
implications for aquatic food web studies. Limnol. Oceanogr. 46, 2061–2066. 643
https://doi.org/10.4319/lo.2001.46.8.2061 644
Volkman, J., 2003. Sterols in microorganisms. Appl. Microbiol. Biotechnol. 60, 495–506. 645
Volkman, J.K., 1986. A review of sterol markers for marine and terrigenous organic matter. Org. 646
Geochem. 9, 83–99. 647
Volkman, J.K., Revill, A.T., Holdsworth, D.G., Fredericks, D., 2008. Organic matter sources in an 648
enclosed coastal inlet assessed using lipid biomarkers and stable isotopes. Org. Geochem. 39, 649
689–710. https://doi.org/10.1016/j.orggeochem.2008.02.014 650
Wasowicz, E., Rudzinska, M., 2011. Cholesterol and phytosterols. Chem. Biol. Funct. Asp. Food 651
Lipids 113–134. 652
Yamauguchi, T., Koichi, I.T.O., Mitsuo, H., 1986. Studies on the sterols in some marine 653
phytoplanktons. Tohoku J. Agric. Res. 37, 5–14. 654
M
AN
US
CR
IP
T
AC
CE
PT
ED
42 Zhukova, N.V., Kharlamenko, V.I., 1999. Sources of essential fatty acids in the marine microbial 655loop. Aquat. Microb. Ecol. 17, 153–157. https://doi.org/10.3354/ame017153 656