HAL Id: hal-02374036
https://hal.archives-ouvertes.fr/hal-02374036
Submitted on 16 Sep 2020
HAL is a multi-disciplinary open access
archive for the deposit and dissemination of
sci-entific research documents, whether they are
pub-lished or not. The documents may come from
teaching and research institutions in France or
abroad, or from public or private research centers.
L’archive ouverte pluridisciplinaire HAL, est
destinée au dépôt et à la diffusion de documents
scientifiques de niveau recherche, publiés ou non,
émanant des établissements d’enseignement et de
recherche français ou étrangers, des laboratoires
publics ou privés.
the production, transport and transformation of
dissolved organic carbon from Arctic permafrost regions,
Part 2: Model evaluation over the Lena River basin
Simon Bowring, Ronny Lauerwald, Bertrand Guenet, Dan Zhu, Matthieu
Guimberteau, Régnier Pierre, Ardalan Tootchi, Agnès Ducharne, Philippe
Ciais
To cite this version:
Simon Bowring, Ronny Lauerwald, Bertrand Guenet, Dan Zhu, Matthieu Guimberteau, et al..
OR-CHIDEE MICT-LEAK (r5459), a global model for the production, transport and transformation
of dissolved organic carbon from Arctic permafrost regions, Part 2: Model evaluation over the Lena
River basin. Geoscientific Model Development, European Geosciences Union, 2020, 13 (2), pp.507-520.
�10.5194/gmd-13-507-2020�. �hal-02374036�
https://doi.org/10.5194/gmd-13-507-2020 © Author(s) 2020. This work is distributed under the Creative Commons Attribution 4.0 License.
ORCHIDEE MICT-LEAK (r5459), a global model for the
production, transport, and transformation of dissolved organic
carbon from Arctic permafrost regions – Part 2: Model evaluation
over the Lena River basin
Simon P. K. Bowring1, Ronny Lauerwald2, Bertrand Guenet1, Dan Zhu1, Matthieu Guimberteau1,3, Pierre Regnier2, Ardalan Tootchi3, Agnès Ducharne3, and Philippe Ciais1
1Laboratoire des Sciences du Climat et de l’Environnement, LSCE, CEA, CNRS, UVSQ, 91191 Gif-Sur-Yvette, France 2Department of Geoscience, Environment and Society, Université Libre de Bruxelles, Brussels, Belgium
3Sorbonne Université, CNRS, EPHE, Milieux environnementaux, transferts et interaction dans les hydrosystèmes et les sols,
Metis, 75005 Paris, France
Correspondence: Simon P. K. Bowring (simon.bowring@lsce.ipsl.fr) Received: 10 December 2018 – Discussion started: 25 March 2019
Revised: 11 October 2019 – Accepted: 21 October 2019 – Published: 10 February 2020
Abstract. In this second part of a two-part study, we per-formed a simulation of the carbon and water budget of the Lena catchment with the land surface model ORCHIDEE MICT-LEAK, enabled to simulate dissolved organic carbon (DOC) production in soils and its transport and fate in high-latitude inland waters. The model results are evaluated for their ability to reproduce the fluxes of DOC and carbon diox-ide (CO2) along the soil–inland-water continuum and the
ex-change of CO2with the atmosphere, including the evasion
outgassing of CO2from inland waters. We present simulation
results over the years 1901–2007 and show that the model is able to broadly reproduce observed state variables and their emergent properties across a range of interacting physical and biogeochemical processes. These include (1) net primary production (NPP), respiration and riverine hydrologic ampli-tude, seasonality, and inter-annual variation; (2) DOC con-centrations, bulk annual flow, and their volumetric attribu-tion at the sub-catchment level; (3) high headwater versus downstream CO2 evasion, an emergent phenomenon
con-sistent with observations over a spectrum of high-latitude observational studies. These quantities obey emergent rela-tionships with environmental variables like air temperature and topographic slope that have been described in the liter-ature. This gives us confidence in reporting the following additional findings: of the ∼ 34 Tg C yr−1 left over as in-put to soil matter after NPP is diminished by heterotrophic
respiration, 7 Tg C yr−1 is leached and transported into the aquatic system. Of this, over half (3.6 Tg C yr−1)is evaded from the inland water surface back into the atmosphere and the remainder (3.4 Tg C yr−1) flushed out into the Arctic Ocean, mirroring empirically derived studies. These river-ine DOC exports represent ∼ 1.5 % of NPP. DOC exported from the floodplains is dominantly sourced from recent more “labile” terrestrial production in contrast to DOC leached from the rest of the watershed with runoff and drainage, which is mostly sourced from recalcitrant soil and litter. All else equal, both historical climate change (a spring–summer warming of 1.8◦C over the catchment) and rising atmo-spheric CO2(+85.6 ppm) are diagnosed from factorial
sim-ulations to contribute similar significant increases in DOC transport via primary production, although this similarity may not hold in the future.
1 Introduction
A new branch of the high-latitude-specific land surface com-ponent of the Institut Pierre Simon Laplace (IPSL) Earth system model, ORCHIDEE MICT-LEAK (r5459), was en-abled to simulate new model processes of soil dissolved organic carbon (DOC) and CO2 production. This includes
their advective and diffusive vertical transport within a dis-cretised soil column as well as their transport and transfor-mation within the inland water network, in addition to im-proved representation of hydrological and carbon processes in floodplains. These additions, processes first coded in the model ORCHILEAK (Lauerwald et al., 2017) and imple-mented within the high-latitude base model ORCHIDEE-MICT v8.4.1 (Guimberteau et al., 2018), were described in detail in the first part (Part 1) of this study, depicted graphi-cally in Fig. S1a and b in the Supplement. This second part of our study deals with the validation and application of our model. We validate simulation outputs against observations for the present day and run transient simulations over the historical period (1901–2007) using the Lena River basin as a test case. The simulation setup and rationale for choice of simulation basin are outlined below.
2 Simulation rationale
The Lena River basin, which is bounded by the region 52– 72◦N and 102–142◦E, was chosen as the basin for model evaluation, because it has the largest DOC discharge con-tribution amongst the Arctic rivers, according to some es-timates (Raymond et al., 2007; Holmes et al., 2012). This is because of its 2.5 × 10⁶km2 area (befitting our coarse-grid resolution) discharging almost 20 % of the summed dis-charge of the six largest Arctic rivers, its large areal coverage by Podzols (DeLuca and Boisvenue, 2012), and the domi-nance of DOC versus particulate organic carbon (POC) with 3–6 Tg DOC-C yr−1 vs. 0.03–0.04 Tg POC-C yr−1 (Semile-tov et al., 2011) in the total organic carbon discharge load – factors all broadly representative of the Eurasian Arctic rivers. Climatological input to the model is from the Global Soil Wetness Project Phase 3 (GSWP3) v.0 data, based on 20th century reanalysis using the National Centers for En-vironmental Prediction (NCEP) land–atmosphere model and downscaled to a 0.5◦, 3-hourly resolution covering the pe-riod 1901 to 2007 (Table S1). This is then upscaled to 1◦ resolution and interpolated to a 30 min time step to comply with the time step of ORCHIDEE’s surface water and energy balance calculation period. Precipitation was partitioned into rainfall and snowfall, and a correction for wind-induced un-dercatch was also applied. These are described in greater de-tail in Guimberteau et al. (2018). Over the simulation period with this dataset, the Lena basin experiences a mean thaw period warming of 1.8◦C, while atmospheric CO
2
concentra-tions increase by 85.6 ppm. The GSWP3 dataset was chosen due to its relative performance in simulating the inter-annual variability and seasonality of pan-Arctic riverine discharge in ORCHIDEE-MICT (Guimberteau et al., 2018) as compared to another data-driven climate forcing product, CRUNCEP v7 (Kalnay et al., 1996; New et al., 1999). Indeed, under CRUNCEP v7, ORCHIDEE-MICT was shown to underes-timate river discharge by as much as 83 % over the Yukon
basin. An improved floodplain area input file for the Lena basin (Tootchi et al., 2019) was used to drive the simulation of floodplain dynamics (Table S1).
3 Simulation setup
As detailed in the companion paper (Part 1, Sect. 3.1), the soil carbon stock used by our model was reconstituted from a 20 000-year soil carbon spin-up of an ORCHIDEE-MICT run from Guimberteau et al. (2018) and run to quasi-steady-state equilibrium for the “active” and “slow” carbon pools (Fig. S1b) under the new soil carbon scheme used in the model configuration of the present study (Fig. 1). After some adjustment runs to account for model read and write norms, the model was then run in transient mode under histori-cal climate, land cover, and atmospheric CO2concentrations
(Fig. 1). Simulations were run over the Lena River basin (Fig. 3a) for the climate, CO2, and vegetation input forcing
data (Table S1) over 1901–2007 at a 1◦resolution (Fig. 1) to evaluate the simulated output of relevant carbon fluxes and hydrologic variables against their observed values, as well as those of emergent phenomena arising from their interplay (Fig. 1). We evaluate at the basin scale, because the isola-tion of a single geographic unit allows for a more refined analysis of simulated variables than doing the same over the whole pan-Arctic region, much of which remains poorly ac-counted for in empirical databases and literature. The liter-ature studies used in this evaluation are summarised in Ta-ble S2. In order to derive an understanding of the environ-mental drivers of carbon cycling in the Lena watershed and analyse the model sensitivity to the corresponding forcing data, alternative simulations were run with constant climate and CO2conditions (Tables 1 and S1). Thus a factorial
ulation was devised, consisting of two factors and three sim-ulations whose inputs were identical except for the investi-gated factor (Table 1).
4 Results and interpretation
We refer to different simulations performed in this study ac-cording to the sensitivity factors to which they are subjected. The transient historical climate and atmospheric CO2-forced
simulations are hereafter referred to as the “control” (CTRL) scenario for ease of interpretation. The “CLIM” and “CO2”
scenarios are those simulations for which climate variabil-ity and atmospheric CO2were held constant at their
prein-dustrial levels, respectively (Table 1). The following evalua-tion secevalua-tions compare observaevalua-tions solely against the CTRL. The subsequent section will evaluate this comparison against the factorial simulations described above. The overall carbon budgets and their fluxes as generated by each of the simu-lations are shown in Figs. 2 and 10 and discussed in detail at the end of the evaluation. In the following we report first the broad results of model simulations with respect to the
Table 1. Summary description of the factorial simulations undertaken to examine the relative drivers of lateral fluxes in our model. Simulation name Abbreviation Historical input data Input held constant
Control CTRL Climate, CO2, vegetation None
Constant climate CLIM CO2, vegetation Climate
Constant CO2 CO2 Climate, vegetation CO2(preindustrial)
Figure 1. Flow diagram illustrating the stepwise stages required to set up the model, up to and including the historical period. The two stages that refer to the inverted reading of restart soil profile order point to the fact that the restart inputs from ORCHIDEE-MICT are read by our model in inverse order, so that 1 year must be run in which an activated flag reads it properly, before the reading of soil profile restarts is reinverted for all subsequent years.
carbon cycle, and we follow with an evaluation of river wa-ter and DOC discharge, DOC concentration and seasonality, and river surface CO2outgassing against available empirical
data. Evaluation of net primary production (NPP) and soil respiration, which are not considered primarily important to this study, is covered in Sect. S1.
4.1 Model output: carbon budget
Figure 2 summarises the simulated components of the car-bon (C) cycle across the Lena basin, averaged over the decade 1998–2007. C inputs to terrestrial ecosystems are dominated by photosynthetic input (gross primary produc-tion, GPP). GPP assimilates (875 Tg C yr−1)are either used as metabolic substrates by plants or lost as CO2 by plant
respiration processes (376 Tg C yr−1)or soil respiration pro-cesses (465 Tg C yr−1), leaving behind annual growth in ter-restrial C storage (net biome productivity, NBP), an atmo-spheric CO2 sink of 34 Tg C yr−1. Further C inputs are
de-livered to the terrestrial surface via a combination of atmo-spheric deposition, rainwater-dissolved C, and the leaching of canopy C compounds. These sum to a flux transported to
Figure 2. Schematic diagrams detailing the major yearly carbon flux outputs (Tg C yr−1)from the control simulation averaged over the period 1998–2007 as they are transformed and transported across the land–aquatic continuum.
the soil surface (4.6 Tg C yr−1)by throughfall (see Part 1, Sect. 2.5).
DOC in the soil solution as well as a fraction of dissolved CO2produced in the root zone from root and microbial
res-piration is exported to rivers along the model’s two hydrolog-ical export vectors, surface runoff, and deep drainage (Part 1, Sect. 2.6). For the Lena basin simulations, these fluxes of C exported from soils amount to 5.1 and 0.2 Tg C yr−1 for DOC and CO2, respectively. Three water pools,
represent-ing streams, rivers and groundwater and each containrepresent-ing dis-solved CO2 as well as DOC of different reactivities, are
routed through the landscape and between grid cells follow-ing the river network in the catchment (Part 1, Sect. 2.7). In addition, seasonally flooded soils located in low, flat grid cells next to the river network (see Part 1, Sect. 2.8) ex-port DOC (0.57 Tg C yr−1)and CO2(1.54 Tg C yr−1)to the
river network when inundation occurs. Part of this leached inundated material is re-infiltrated back into the soil from the water column during floodplain recession (“return” flux, 0.45 Tg C yr−1). During its transport through inland waters, DOC can be decomposed into CO2 (2.1 Tg C yr−1), and a
fraction of river CO2 produced from DOC and transferred
from soil escapes to the atmosphere (3.6 Tg C yr−1) through gas exchange kinetics (Part 1, Sect. 2.10). This flux is termed “CO2evasion” in Fig. 2 of this study. Carbon that survives
the inland water reactor is exported to the coastal ocean in the form of DOC (3.16 Tg C yr−1)and CO2(0.26 Tg C yr−1).
4.1.1 Model evaluation: river discharge
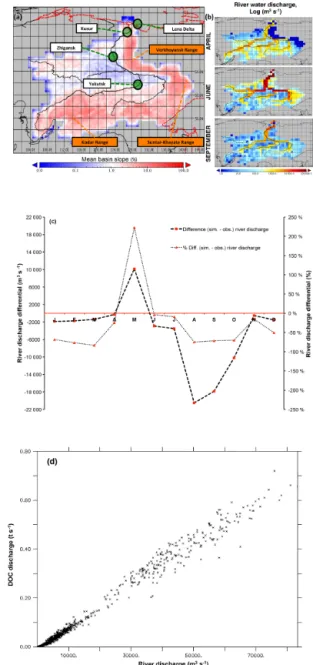
Simulated river water discharge captures the key feature of Arctic river discharge – that of a massive increase in flow to ∼ 80 000 m3s−1 in April–June caused by melting snow and ice, but it underestimates observed river discharge in late summer by around 70 % (Figs. 3c, 4b). In addition, the mean spring (June) discharge peak flows are slightly under-estimated or out of phase in simulations (Figs. 3c, 4b) com-pared to observations (Ye et al., 2009); this is caused by a large amount of water throughput being simulated in May (∼ 10 000 m3s−1) in excess of observed rates. Finally, dur-ing the winter low-flow period, the model consistently un-derestimates water flow-through volumes reaching the river main stem (see Fig. 3c, winter months). Although this under-estimate is not severe relative to annual bulk flows, the di-vergence is large as a percentage of observations (see right-hand axis, Fig. 3c) and may point to an issue in how ice is represented in the model, such as the fact that solid ice in-clusions in the soil column are not represented, or the pos-sibility that much slower groundwater dynamics than those represented in the model are feeding discharge. In addition to this, the presence of a dam on the Vilyuy tributary of the Lena has been shown to reduce main stem winter low-flow rates by up to 90 % (Ye et al., 2003), similar to the discrep-ancy of our low-flow rates: given that our model only simu-lates “natural” hydrological flows and thus does not include dams, we expect that this effect is also at play. Causal fac-tors for the apparently poor performance of the hydrological module include poor model representations (or lack thereof), climatological dataset choices, and deficiencies in evalua-tion datasets themselves, and these are covered in detail in Sect. S2.
4.1.2 Model evaluation: DOC annual discharge
Our CTRL simulation shows that the yearly sum of DOC output to the Arctic Ocean has increased steadily over the course of the 20th century, from ∼ 1.4 Tg DOC-C yr−1 in 1901 to ∼ 4 Tg DOC-C yr−1 in 2007 (Fig. 4a). Smoothing the DOC discharge over a 30-year running mean shows that the increasing trend (Fig. 4a) over this averaging scale is almost linear, at ∼ 0.11 Tg C per decade or a net increase of 40 % using this averaging scale. Empirically based esti-mates of total contemporary DOC entering the Laptev Sea from Lena River discharge vary around ∼ 2.5–5.8 Tg DOC-C (DOC-Cauwet and Sidorov, 1996; Dolman et al., 2012; Holmes et al., 2012; Lara et al., 1998; Raymond et al., 2007; Semile-tov et al., 2011).
Note, however, that modelled aggregate DOC discharge is strongly affected by the underestimation of river wa-ter discharge. Figure 4a shows the average simulated DOC
Figure 3. Map of the Lena (a) with the scale bar showing the mean grid cell topographic slope from the simulation, and the black line showing the satellite-derived overlay of the river main stem and sub-basins. Mountain ranges of the Lena basin are shown in orange. Green circles denote the outflow grid cell (Kusur) from which our simulation outflow data are derived, as well as the Zhigansk site, from which evaluation against data from Raymond et al. (2007) are assessed. The regional capital (Yakutsk) is also included for geographic reference. Coastal outline and inland water bodies are shown as dashed red and solid black lines, respectively. (b) Maps of river water discharge (log(m3s−1)) in April, June, and Septem-ber, averaged over 1998–2007. (c) The mean monthly river dis-charge differential between observed disdis-charge for the Lena (Ye et al., 2009) and simulated discharge averaged over 1998–2007 in ab-solute (m3s−1) and percentage terms. (d) Regression of simulated monthly DOC discharge versus simulated river discharge at the river mouth (Kusur) over the entire simulation period (1901–2007).
Figure 4. (a) Yearly DOC discharged from the Lena River into the Laptev Sea is shown here (t C yr−1), over the entire simulation period (dashed red line), with the smoothed 30-year running mean shown by the asterisk symbols. Observation-based estimates for DOC discharge from Lara et al. (1998), Raymond et al. (2007), Dolman et al. (2012), and Holmes et al. (2012) are shown by the horizontal black, green triangle, blue diamond, and yellow circle line colours and symbols, respectively, and are to be compared against the simulated mean over the last decade of simulation (1998–2007, horizontal red line), with error bars added in grey displaying the standard deviation of simulated values over that period. (b) Average monthly DOC discharge (solid red, t C month−1)and water discharge (dashed red, m3s−1)to the Laptev Sea over the period averaged for 1901–1910 (circles) and 1997–2007 (squares) are compared, with modern maxima closely tracking observed values. Observed water discharge over 1936–2000 from R-ArcticNet v.4 (Lammers et al., 2001) and published in Ye et al. (2009) are shown by the dashed black line. (c) Observed (black) and simulated (red) seasonal DOC fluxes (solid lines) and CO2 discharge concentrations
(dashed lines). Observed DOC discharge as published in Raymond et al. (2007) from 2004–2005 observations at Zhigansk, a site ∼ 500 km upstream of the Lena delta. This is plotted against simulated discharge for (i) the Lena delta at Kusur (red circles) and (ii) the approximate grid pixel corresponding to the Zhigansk site (red squares) averaged over 1998–2008. Observed CO2 discharge from a downstream site
(Cauwet and Sidorov, 1996; dashed black), and simulated from the outflow site (dashed circle), and the basin average (dashed square) are shown on the log-scale right-hand axis for 1998–2008.
discharge (red bar) of the last decade (1998–2007) of 3.2 Tg C yr−1 compared with estimates of 3.6 Tg C yr−1 (black bar) from Lara et al. (1998), 5.8 Tg C yr−1 (orange bar) from Raymond et al. (2007), and 5.7 Tg C yr−1 from Holmes et al. (2012). The most recent and elaborate of those estimates is the estimate by Holmes et al. (2012), who used a rating curve approach based on 17 samples collected from 2003 to 2006 and covering the full seasonal cycle,
which was then applied to 10 years of daily discharge data (1999–2008) for extrapolation. Given that their estimate is also based on Arctic-GRO-1/PARTNERS data (https://www. arcticgreatrivers.org/data, last access: 1 August 2019), which stands as the highest temporal resolution dataset to date, their estimate is likely the most accurate of the DOC dis-charge estimates. Compared to their average annual estimate of 5.7 Tg C yr−1, our simulated DOC export is low by around
43 %, due largely to the poor performance of the hydrology module. The DOC discharge underestimate is discussed in depth in Sect. S2.
4.2 Model evaluation: DOC concentrations in lateral transport
While total DOC discharge captures the integral of biogeo-chemical processes leading to fluvial outflow, simulations of this are highly sensitive to the performance of modelled hy-drology and climatological input data. A more precise mea-sure for the performance of the newly introduced DOC pro-duction and transport module, which is less sensitive to re-production of river water discharge, is DOC concentration. This is because while the total amount of DOC entering river water depends on the amount of water available as a vehi-cle for this flux (hydrology), the concentration of DOC de-pends on the rate of soil carbon leaching, itself depending largely on the interaction of soil biogeochemistry with pri-mary production and climatic factors. This we evaluate in Fig. 5a. This shows that for the majority of the thaw period or growing season (April–September), which corresponds to the period when over 90 % of DOC production and trans-port occurs, the model largely tracks the observed season-ality of DOC concentrations in Arctic-GRO data averaged over 1999–2007. There is a large overestimate of the DOC concentration in May owing to inaccuracies in simulating the onset of the thaw period, while the months June–September underestimate concentrations by an average of 18 %. On the other hand, frozen period (November–April) DOC concen-trations are underestimated by between ∼ 30 % and 500 %. This is due to deficiencies in representing wintertime soil hy-drological water flow in the model, which impede water flow when the soil is frozen, as discussed in Sect. S2. Because of this deficiency, slow-moving groundwater flows that con-tain large amounts of DOC leachate are under-represented. This interpretation is supported by the fact that in both obser-vations and simulations, at low discharge rates (correspond-ing to wintertime), DOC concentrations exhibit a strong pos-itive correlation with river discharge, while this relation-ship becomes insignificant at higher levels of river discharge (Fig. 5b). Thus wintertime DOC concentrations suffer from the same deficiencies in model representation as those for water discharge. In other words, the stand-alone represen-tation of DOC leaching is satisfactory; when it is sensitive to river discharge, it suffers from the same shortfalls identi-fied in Sects. S2 and S3. Modelled DOC concentrations in stream, river, and groundwater are evaluated against data and discussed in Sect. S5.
4.3 In-stream CO2production, transport, and evasion
In our model, the fate of DOC once it enters the fluvial system is either to remain as DOC and be exported to the ocean or to be degraded to dissolved CO2(CO2(aq.)), which
Figure 5. (a) Simulated and observed (Arctic-GRO; Holmes et al., 2012) DOC concentration seasonality for the Lena basin over the period 1999–2007. (b) Plots of DOC concentration versus river dis-charge as in observations (Raymond et al., 2007) and simulations, where simulation data points are monthly averages taken over the period 1999–2007.
is itself either also transported to the marine system or out-gassed from the fluvial surface to the atmosphere (see Part 1, Sects. 2.10 and S6). As noted in Part 1 of this study, al-though the model as a whole conducts simulations at the 1◦ scale, the routing of water and carbon, as well as the eva-sion of the latter, occurs at the sub-grid scale, such that we are able to simulate spatially explicit rivers whose size ap-proximates Strahler order 4; through the “fast” water pool in the model, we are able to simulate streams of Strahler orders 1–3. The seasonality of riverine dissolved CO2
con-centrations (CO2(aq.), mg C L−1) is evaluated in Fig. 4c to
compare CO2(aq.)concentrations with DOC bulk flows, since
CO2(aq.)concentrations follow an inverse seasonal pattern to
those of DOC, being highest during the winter baseflow pe-riod and lowest in summer due to dilution during its high-discharge phase (Semiletov et al., 2011). The simulated flow of CO2(aq.)at Kusur (Fig. 4c, dashed red) reproduces the
sea-sonality of observations from Cauwet and Sidorov (1996), who sampled the lower Lena (Fig. 3a), but somewhat under-estimates concentrations. Also included in Fig. 4c is the basin average for all non-zero values, whose shape also tracks that of observations. Thus the model represents, on the one hand, increasing hydrological flow mobilising increasing quantities
and concentrations of DOC, while, on the other hand, those same increasing hydrological flows increase the flux but de-crease the concentration of CO2(aq.)throughput.
Evaluation of modelled CO2evasion is beset by problems,
not least that no data on this quantity to our knowledge have been recorded for the Lena (see Sect. S6). Figure 6 sum-marises some of the results from the simulated water body CO2 outgassing flux. Year-on-year variation in basin-wide
evasion from river, stream, and floodplain sources combined exhibits a marked increasing trend over the course of the 20th century, increasing from a minimum of ∼ 1.6 Tg CO2
-C yr−1 in 1901 to a maximum of ∼ 4.4 Tg CO2-C yr−1 in
2007 (+300 %, Fig. 7a). Smoothing the data over a 30-year running average yields a dampened net increase in basin-wide evasion of ∼ 30 % (Fig. 7a). Thus yearly evasion flux is some 105 % of yearly DOC discharge to the coast from the Lena basin and 51 % of C exported from soils to headwa-ters as CO2or DOC. If we compare the mean yearly rate of
increase in absolute (TgC yr−1)CO2evasion and DOC
dis-charge based on linear regression over the whole simulation period, it appears that the rate of increase of both fluxes has been strikingly similar over the simulated 20th century, with mean increases of 11.1 and 11.5 Gg C yr−1per year for eva-sion and export, respectively. A summary and evaluation of the source and seasonal heterogeneity of evasion is discussed in Sect. S7.
As previously discussed, the proportion of total basin-wide CO2evasion attributable to headwater streams and rivers is
substantially greater than their proportion of total basin sur-face area. Figure 6b represents the mean monthly fractional contribution of each surface hydrological water pool to the total evasion flux (unitless) over the period 1998–2007. This shows that over the entirety of the thaw period, the stream water pool takes over from the river water pool as the dom-inant evasion source, particularly at the height of the freshet period, when its fractional contribution rises to > 75 %. The stream fraction of August outgassing is ∼ 57 % of the annual total, which is higher than the ∼ 40 % found for streams in Denfeld et al. (2013). However, the values between the two studies are not directly comparable, different basins notwith-standing, due to differences between how “streams” are de-fined in the model and in the field (expanded on in Sect. S8). Also shown in Fig. 6b is the gradual onset of evasion from the floodplain reservoir in April, as the meltwater-driven surge in river outflow leads to soil inundation and the gradual in-crease of proportional evasion from these flooded areas over the course of the summer, with peaks in June–August as wa-ter temperatures over these flooded areas likewise peak. We stress the importance of these simulation results as they con-cur with large numbers of observational studies (cited above) which show the disproportionately large contribution of the smaller headwater stream to total outgassing (Fig. 7c), being due to their comparatively high outgassing rates (Fig. 7e). In addition, the contribution of floodplains to evasion, an otherwise rarely studied feature of high-latitude biomes, is
shown here to be significant. A Hovmöller plot (Fig. 7d) of the monthly longitude-averaged stream reservoir fraction of total evasion allows us to infer the following. (i) The dom-inance of stream evasion begins in the most southern up-stream headwaters in the lower-latitude thaw period (April– May), and trickles northward over the course of the next 2 months, following the river flow. (ii) The intensity of this evasion is greatest in the lower-latitude regions of the basin, which we speculate is the result of higher temperatures caus-ing a greater proliferation of small thaw-water-driven flows and evasion. (iii) Areas where the stream fraction is not dom-inant or only briefly domdom-inant during the summer (58–60◦N, 63–64◦N, 70–71◦N) are all areas where floodplain CO2
eva-sion plays a prominent role at that latitudinal band.
We evaluate the approximate rate of modelled areal CO2
efflux from the water surface against observations from Den-feld et al. (2013). (The “approximate” caveat is treated in Sect. S9.) The comparison of simulated results with those from Denfeld et al. (2013) is displayed in Fig. 6d, which shows boxplots for simulated CO2evasion from the stream
water reservoir and river water reservoir averaged over 1998– 2007. The empirical (Kolyma river) analogue of these data, from which this plot is inspired (Fig. 4d in Denfeld et al., 2013), is shown in the inset. Median efflux was 1.1 (6) ver-sus 0.4 (0.8) for stream and river, respectively, in simula-tions (observasimula-tions). Like the observasimula-tions, simulated stream efflux had a substantially greater interquartile range, mean (24.6), and standard deviation (73) than total river efflux (1.3 and 7.2, respectively).
4.4 Emergent phenomena: DOC, topographic slope, and MAAT
Subsurface water infiltration fluxes and transformations of dissolved matter represent an important, if poorly under-stood and observationally under-represented, biogeochemi-cal pathway of DOC export to river main stems, involving the complex interplay of slope, parent material, temperature, permafrost material age, and soil physicochemical processes, such as adsorption and priming. In the Lena basin, as in other permafrost catchments, topographic slope has been shown to be a powerful predictor for water infiltration depth and con-centration and age of DOC (Jasechko et al., 2016; Kutscher et al., 2017; McGuire et al., 2005), with deeper flow paths and older lower DOC-concentrated waters found as the topo-graphic slope increases. This relationship is shown in Fig. 4 of Kutscher et al. (2017), who surveyed DOC concentra-tions across a broad range of slope angle values in the Lena basin and found a distinct negative relationship between the two. Comparing the Kutscher et al. (2017) values with our model output, by plotting stream and river DOC concentra-tions averaged per grid point over 1998–2007 against the to-pographic map used in the routing scheme (Fig. 8), we find a similar negative relationship between the two variables. The causes of this relationship and a discussion of the model’s
Figure 6. CO2evasion from stream, river, and flood reservoirs. (a) Time series of total yearly CO2evasion (t C yr−1) summed over the three
hydrological pools (red line) with the 30-year running mean of the same variable overlain in thick red (asterisk) symbols. Error bars give the standard deviation of each decade (e.g. 1901–1910) for each data point in that decade. (b) The fraction of total CO2evasion emitted from
each of the hydrological pools for the average of each month over the period 1998–2007 is shown for river, flood, and stream pools (blue, green, and red lines, respectively), with error bars depicting the standard deviation of data values for each month displayed. (c) Hovmöller diagram showing the monthly evolution of the stream pool fraction (range 0–1) per month and per latitudinal band, averaged over the period 1998–2007. (d) Boxplot for approximate (see text) simulated CO2evasion (g C m−2d−1) from the stream water reservoir and river water
reservoir averaged over 1998–2007. Coloured boxes denote the first and third quartiles of the data range, and internal black bars are the median. Whiskers give the mean (solid red bar) and standard deviation (dashed red bar) of the respective data. Empirical data on these quantities using the same scale for rivers, streams, and main stem of the Kolyma river from Denfeld et al. (2013) are shown in the inset.
ability to represent it are discussed in Sect. S10. A positive non-linear relationship between DOC and mean annual air temperature (MAAT), discussed in prior empirical studies, is also reproduced by the model (Fig. 7) and discussed in Sect. S11.
4.5 DOC reactivity pools
Here we examine the reactivity of DOC leached from the soil and litter to different hydrological export pools. Sur-face runoff DOC export is dominated by refractory carbon (Fig. 9), with export rates largely following discharge rates as they drain the basin with an increasing delay when lat-itude increases. As the thaw period gets underway (April), the fraction of labile carbon in surface runoff DOC increases
substantially from south to north, reflecting the hydrologic uptake of the previous year’s un-decomposed high-reactivity organic matter.
Refractory C-dominated drainage DOC export (Fig. 9) is highest in June through October, with refractory export rate intensities per latitudinal band during this period con-sistent with the fraction of inundated area (Fig. S1b) over these bands during the year. The high refractory proportion of drainage flow is expected, as drainage leaches older, relict soil and litter matter. Because of its longer residence time within the soil column, labile DOC carried downward via soil infiltration will tend to be metabolised in situ before it can be exported to the hydrological network, further increasing the proportion of refractory carbon. By contrast, floodplain
Figure 7. Mean summertime DOC concentrations (mg C L−1) plot-ted against mean annual air temperature (MAAT, ◦C) for simu-lated pixels over the Lena River basin (red circles); observations for largely peat-influenced areas in western Siberia as reported in Frey et al. (2009) (black crosses); and observations from a global non-peat temperate and high-latitude meta-analysis (black circles) reported in Laudon et al. (2012). The blue region repre-sents permafrost-affected areas, while the orange region reprerepre-sents permafrost-free areas. The green region bounds the area of overlap in MAAT between the observed and simulated datasets. The dark red shaded area corresponds to the MAAT “zone of optimality” for DOC production and transport proposed by Laudon et al. (2012). Regression curves of DOC against MAAT for each of the separate datasets are shown for each individual dataset.
DOC export (Fig. 9) is composed of a more nuanced mix of both reactivity classes, reflecting its relatively greater depen-dence on the current year’s “fresh” biomass as source mate-rial (62 % labile DOC versus 38 % refractory DOC, yearly averaged) for carbon leaching.
For both the river and stream pool, mean DOC concen-trations are dominated by refractory carbon sources. When averaged over the year, the dominance of the refractory DOC carbon pool over its labile counterpart is also evident for all DOC inputs to the hydrological routing except for floodplain inputs, as well as within the “flowing” stream and river pools themselves. This is shown in Table 2, where the yearly aver-aged percentage of each carbon component of the total input or reservoir is subdivided between the “north” and “south” of the basin, and these splits are arbitrarily imposed as the latitu-dinal midpoint of the basin itself (63◦N). This reinforces the generalised finding from our simulations that refractory car-bon dominates runoff and drainage inflows to rivers (89 % re-fractory, on average), while floodplains export mostly labile DOC to the basin (64 %), and these values are effectively in-dependent of this latitudinal subdivision (Table 2). Nonethe-less, there is a small consistent difference between north and
Figure 8. Variation of DOC concentrations versus topographic slope in Kutscher et al. (2017) (black triangles) and (red dots) as simulated and averaged for the summer months (JJA) over 1998– 2007; observed values were measured during June and July 2012– 2013.
south in stream and river water DOC makeup in that the la-bile portion decreases between north and south; this may be an attenuated reflection of the portion of labile DOC that is decomposed to CO2within the water column during its
trans-port northward, affecting the bulk average protrans-portions con-tained within the water in each “hemisphere”.
5 Discussion
5.1 Land–ocean aquatic continuum (LOAC) 5.1.1 LOAC fluxes
Overall, our simulation results show that dissolved carbon entering the Lena River system is significantly transformed during its transport to the ocean. Taking the average through-put of carbon into the system over the last 10 years of our simulation, our results show that although 7 Tg C yr−1 (after re-infiltration following flooding of 0.45 Tg C yr−1; see Fig. 2 “return” flux) enters the Lena from terrestrial sources as dissolved carbon and CO2, only 3.4 Tg C yr−1is
Table 2. Summary of the average carbon reactivity types compris-ing the hydrological inputs to rivers and streams (runoff, drainage, and floodplain inputs), and within the rivers and streams them-selves, subdivided between the north and south of the Lena basin (greater or less than 63◦N, respectively).
Hydrological Model carbon
source reactivity pool North South Runoff input Refractory 81 % 83 % Labile 19 % 17 % Drainage input Refractory 96 % 94 % Labile 4 % 6 % Flood input Refractory 36 % 37 % Labile 64 % 63 % Streams Refractory 91 % 89 % Labile 9 % 11 % Rivers Refractory 92 % 90 % Labile 8 % 10 %
discharged into the Laptev Sea and beyond from the river mouth. The remainder (3.6 Tg C yr−1)is metabolised in the water column during transport and evaded to the atmosphere (bottom panel, Fig. 10). The terrestrial DOC inflow estimate is comparable to that made by Kicklighter et al. (2013), who estimated in a modelling study that terrestrial dissolved car-bon loading of the Lena is ∼7.7 Tg C yr−1.
The relative quantities of carbon inflow, evasion, and out-flow in the river system that are presented for the Lena in Fig. 10 can be compared to the same relative quantities – i.e. the ratios “evasion : in” and “out : in”, where “in” refers to dissolved terrestrial input – from the global study by Cole et al. (2007), who estimated these fluxes from empirical or empirically derived data at the global scale. This is shown in the top panel of Fig. 10, where we simplify the Cole et al. (2007) data to exclude global groundwater CO2flux from
the coast to the ocean (because our basin mask has a single coastal pixel, whereas coastal groundwater seepage is dis-tributed along the entire continental boundary) and the POC fraction of in-river transport and sedimentation (since OR-CHIDEE MICT lacks a POC erosion or sedimentation mod-ule) from their budget.
This gives a global terrestrial dissolved carbon input of 1.45 Pg C yr−1, 0.7 Pg C of which is discharged to the ocean and the other 0.75 Pg C evaded to the atmosphere. Tak-ing the previously mentioned evasion : in and out : in ra-tios as a percentage, the outflow and evasion fluxes for the Lena versus the global aggregate are remarkably similar at 48.6 % vs. 48.3 % and 51.4 % vs. 51.7 %, respectively, for the two flows. Thus our results agree with the proposition that the riverine portion of the “land–ocean aquatic continuum” (Regnier et al., 2013) or “boundless carbon cycle” (Battin et al., 2009) is indeed a substantial reactor for matter
trans-ported along it. The drivers of changes in CO2and DOC
ex-port from the soil over the simulation period (temperature and precipitation versus CO2), which we extract from our
constant climate and CO2factorial simulations discussed in
the “Simulation setup” section, are similar to, if somewhat dominated by, temperature (Sect. S12).
5.1.2 LOAC export flux considerations
Despite our simulation’s agreement with observations re-garding the proportional fate of terrestrial DOC inputs as evasion and marine export (Fig. 10), our results suggest sub-stantial and meaningful differences in the magnitude of those fluxes relative to NPP in the Lena, compared to those es-timated by other studies in temperate or tropical biomes. Our simulation’s cumulative DOC and CO2export from the
terrestrial realm into inland waters is equivalent to ∼ 1.5 % of NPP.
This is considerably lower than Cole et al. (2007) and Regnier et al. (2013), who found lateral transfer to approxi-mate ∼ 5 % (1.9 Pg C yr−1) of NPP at the global scale, while Lauerwald et al. (2017) found similar rates for the Amazon. The cause of this discrepancy with our results is beyond the scope of this study to definitively address, given the lack of tracers for carbon source and age in our model. Nonetheless, our analysis leads us to hypothesise the following.
Temperature limitation of soil microbial respiration at the end of the growing season (approaching zero by October, Fig. S4d) makes this flux negligible from November through to May (Fig. S4d). In late spring, mobilisation of organic car-bon is performed by both microbial respiration and leaching of DOC via runoff and drainage water fluxes. However, be-cause the latter are controlled by the initial spring meltwater flux period, which occurs before the growing season has had time to produce litter or new soil carbon (May–June, Fig. 4b), aggregate yearly DOC transport reactivity is characterised by the available plant matter from the previous year, which is overwhelmingly derived from recalcitrant soil matter (Fig. 9) and is itself less available for leaching based on soil carbon residence times.
This causes relatively low leaching rates and riverine DOC concentrations (e.g. Fig. 7), as compared to the case of leach-ing from the same year’s biological production. Highlightleach-ing this point is floodplain domination by labile carbon sourced from that year’s production with a mean DOC concentration of 12.4 mg C L−1(1998–2007 average), with mean riverine DOC concentrations around half that value (6.9 mg C L−1). Nonetheless the May–June meltwater pulse period dominates aggregate DOC discharge. As this pulse rapidly subsides by late July, so does the leaching and transport of organic matter. Warmer temperatures come in conjunction with in-creased primary production and the temperature-driven soil heterotrophic degradation of contemporary and older matter (via active layer deepening). These all indicate that trans-ported dissolved matter in rivers, at least at peak outflow,
Figure 9. The mean monthly fraction of each hydrological pool’s (runoff, drainage, floodplains) carbon reactivity constituents (labile and refractory) averaged across the simulation area over 1998–2008.
Figure 10. Simplified “leaky pipe” diagram representing the transport and processing of DOC within the land–ocean hydro-logic continuum. The scheme template is taken from Cole et al. (2007), where we reproduce their global estimate of DOC and non-groundwater discharge portion of this flow in the top panel (Pg C yr−1), and the equivalent flows from our Lena basin simu-lations (Tg C yr−1) are in the bottom panel. Thus easy comparison would look at the relative fluxes within each system and compare them to one another.
is dominated by sources originating in the previous year’s primary production, that was literally “frozen out” of more complete decomposition by soil heterotrophs.
Further, we infer from the fact that all of our simulation grid cells fall within areas of low (< −2◦C) MAAT, far below the threshold MAAT (> 3◦C) proposed by Laudon et al. (2012) for soil respiration-dominated carbon cycling systems (Fig. 7), that the Lena is hydrologically limited with respect to DOC concentration and its lateral flux. In-deed, the seasonal discharge trend of the Lena – massive snowmelt-driven hydrological and absolute DOC flux – cou-pled with relatively low DOC concentrations at the river mouth (Fig. 4b, simulation data of Fig. 7) are in line with the Laudon et al. (2012) typology.
We therefore suggest that relatively low lateral transport relative to primary production rates (e.g. as a percentage of net primary production, %NPP) in our simulations compared to the lateral transport to NPP percentages reported from the literature in other biomes is driven by meltwater-dominated (vs. precipitation) DOC mobilisation, which occurs during a largely pre-litter deposition period of the growing season. DOC is then less readily mobilised by being sourced from re-calcitrant matter, leading to low leaching concentrations rela-tive to those from labile material. As discharge rates decline, the growing season reaches its peak, leaving carbon
mobil-Figure 11. Simulated basin-mean annual DOC concentrations (mg L−1)for the stream and river water pools regressed against mean annual simulated discharge rates (m3s−1)at Kusur over 1901–2007. Linear regression plots with corresponding R2values are shown.
isation of fresh organic matter to be overwhelmingly driven by in situ heterotrophic respiration.
While we have shown that bulk DOC fluxes scale lin-early to bulk discharge flows (Fig. 3d), DOC concentrations (mg C L−1)hold a more complex and weaker positive rela-tionship with discharge rates, with correlation coefficients (R2) of 0.05 and 0.25 for river and stream DOC concen-trations, respectively (Fig. 11). This implies that while in-creasing discharge reflects inin-creasing runoff and an increas-ing vector for DOC leachincreas-ing, particularly in smaller tributary streams, by the time this higher input of carbon reaches the river’s main stem there is a confounding effect of dilution by increased water fluxes which reduces DOC concentrations, explaining the difference between stream and river discharge vs. DOC concentration regressions in the figure. Thus, and as a broad generalisation, with increasing discharge rates we can also expect somewhat higher concentrations of terres-trial DOC input to streams and rivers. Over the floodplains, DOC concentrations hold no linear relationship with dis-charge rates (R2=0.003, Fig. S11), largely reflecting the fact that DOC leaching is here limited by terrestrial primary production rates more than by hydrology. To the extent that floodplains fundamentally require flooding and hence do de-pend on floodwater inputs at a primary level, we hypothesise that DOC leaching rates are not limited by that water input, at least over the simulated Lena basin.
As discussed above simulated DOC and CO2 export as
a percentage of simulated NPP over the Lena basin was 1.5 % over 1998–2007. However, this proportion appears to be highly dynamic at the decadal timescale. As shown in Fig. S12, all lateral flux components in our simulations in-creased their relative throughput at a rate double to triple that of NPP or respiration fluxes over the 20th century, also do-ing so at a rate substantially higher than the rate increase in discharge. In addition, differentials of these lateral flux rates with the rates of their drivers (discharge, primary production) have on average increased over the century (Fig. S12). This suggests that there are potential additive effects of the pro-duction and discharge drivers of lateral fluxes that could lead to non-linear responses to changes in these drivers as the Arc-tic environment transforms, as suggested by the Laudon et al. (2012) data plotted in Fig. 4. Acceleration of the hydro-logical cycle compounded by temperature and CO2-driven
increases in primary production could therefore increase the amount of matter available for leaching, increase the carbon concentration of leachate, and increase the aggregate gener-ation of runoff to be used as a DOC transport vector. Given that these causal dynamics apply generally to permafrost re-gions, both low lateral flux as %NPP and the hypothesised response of those fluxes to future warming may be a feature particular to most high-latitude river basins.
6 Conclusions
This study has shown that the new DOC-representing high-latitude model version of ORCHIDEE, ORCHIDEE MICT-LEAK, is able to reproduce with reasonable accuracy mod-ern concentrations, rates, and absolute fluxes of carbon in dissolved form, as well as the relative seasonality of these quantities through the year. When combined with a rea-sonable reproduction of real-world stream, river, and flood-plain dynamics, we demonstrate that this model is a poten-tially powerful new tool for diagnosing and reproducing past, present, and potentially future states of the Arctic carbon cy-cle. Our simulations show that of the 34 Tg C yr−1 remain-ing after GPP is respired autotrophically and heterotrophi-cally in the Lena basin, over one-fifth of this captured car-bon is removed into the aquatic system. Of this, over half is released to the atmosphere from the river surface during its period of transport to the ocean, in agreement with previ-ous empirically derived global-scale studies. Both this trans-port and its transformation are therefore non-trivial compo-nents of the carbon system at these latitudes that we have shown are sensitive to changes in temperature, precipitation, and atmospheric CO2concentration. Our results, in
combina-tion with empirical data, further suggest that changes to these drivers – in particular climate – may provoke non-linear re-sponses in the transport and transformation of carbon across the terrestrial–aquatic system interface as change progresses in an Arctic environment increasingly characterised by am-plified warming.
Code and data availability. The source code for OR-CHIDEE MICT-LEAK revision 5459 is available via https://doi.org/10.14768/20181114002.1 (last access: 1 August 209; Bowring, 2018).
Primary data and scripts used in the analysis and other supple-mentary information that may be useful in reproducing the author’s work can be obtained by contacting the corresponding author.
This software is governed by the CeCILL licence under French law and abiding by the rules of distribution of free software. You can use, modify, and/or redistribute the software under the terms of the CeCILL licence as circulated by CEA, CNRS, and INRIA at the following URL: http://www.cecill.info (last access: 1 August 2018).
Supplement. The supplement related to this article is available on-line at: https://doi.org/10.5194/gmd-13-507-2020-supplement.
Author contributions. SPKB coded this model version, conducted the simulations, and wrote the main body of the paper. RL gave consistent input to the coding process and made numerous code im-provements and bug fixes. BG advised on the inclusion of priming processes in the model and advised on the study design and model configuration; DZ gave input on the modelled soil carbon processes and model configuration. PR contributed to the interpretation of re-sults and made substantial contributions to the article text. MG, AT,
and AD contributed to improvements in hydrological representation and floodplain forcing data. PC oversaw all developments leading to the publication of this study. All authors contributed to suggestions regarding the final content of the study.
Competing interests. The authors declare that they have no conflict of interest.
Acknowledgements. Simon P. K. Bowring acknowledges funding from the European Union’s Horizon 2020 research and innova-tion programme under the Marie Sklodowska-Curie grant agree-ment no. 643052, “C-CASCADES”. Simon P. K. Bowring re-ceived a PhD grant. Matthieu Guimberteau acknowledges fund-ing from the European Research Council Synergy grant ERC-2013-SyG-610028 IMBALANCE-P. Ronny Lauerwald acknowl-edges funding from the European Union’s Horizon 2020 research and innovation programme under grant agreement no. 703813 for the Marie Sklodowska-Curie European Individual Fellowship “C-Leak”. Bertrand Guenet acknowledges funding from the European Union Horizon 2020 Project CRESCENDO under contract 641816.
Financial support. This research has been supported by the Marie Sklodowska-Curie ESR grant (grant no. C-CASCADES/643052), the Marie Sklodowska-Curie European Individual Fellowship (grant no. C-Leak/703813), and the European Research Coun-cil Synergy grant (grant no. IMBALANCE-P/ERC-2013-SyG-610028).
Review statement. This paper was edited by Hisashi Sato and re-viewed by Hisashi Sato and two anonymous referees.
References
Battin, T. J., Luyssaert, S., Kaplan, L. A., Aufdenkampe, A. K., Richter, A., and Tranvik, L. J.: The boundless carbon cycle, Nat. Geosci., 2, 598, https://doi.org/10.1038/ngeo618, 2009. Bowring: ORCHIDEE MICT-LEAK revision 5459,
https://doi.org/10.14768/20181114002.1, 2018.
Cauwet, G. and Sidorov, I.: The biogeochemistry of Lena River: Organic carbon and nutrients distribution, Mar. Chem., 53, 211– 227, 1996.
Cole, J. J., Prairie, Y. T., Caraco, N. F., McDowell, W. H., Tranvik, L. J., Striegl, R. G., Duarte, C. M., Kortelainen, P., Downing, J. A., Middelburg, J. J., and Melack, J.: Plumbing the global carbon cycle: Integrating inland waters into the terrestrial carbon bud-get, Ecosystems, 10, 172–185, https://doi.org/10.1007/s10021-006-9013-8, 2007.
DeLuca, T. H. and Boisvenue, C.: Boreal forest soil carbon: Distribution, function and modelling, Forestry, 85, 161–184, https://doi.org/10.1093/forestry/cps003, 2012.
Denfeld, B. A., Frey, K. E., Sobczak, W. V., Mann, P. J., and Holmes, R. M.: Summer CO2evasion from streams and rivers
in the Kolyma River basin, north-east Siberia, Polar Res., 32, 19704, https://doi.org/10.3402/polar.v32i0.19704, 2013. Dolman, A. J., Shvidenko, A., Schepaschenko, D., Ciais, P.,
Tchebakova, N., Chen, T., van der Molen, M. K., Belelli March-esini, L., Maximov, T. C., Maksyutov, S., and Schulze, E.-D.: An estimate of the terrestrial carbon budget of Russia using inventory-based, eddy covariance and inversion methods, Bio-geosciences, 9, 5323–5340, https://doi.org/10.5194/bg-9-5323-2012, 2012.
Guimberteau, M., Zhu, D., Maignan, F., Huang, Y., Yue, C., Dantec-Nédélec, S., Ottlé, C., Jornet-Puig, A., Bastos, A., Laurent, P., Goll, D., Bowring, S., Chang, J., Guenet, B., Tifafi, M., Peng, S., Krinner, G., Ducharne, A., Wang, F., Wang, T., Wang, X., Wang, Y., Yin, Z., Lauerwald, R., Joetzjer, E., Qiu, C., Kim, H., and Ciais, P.: ORCHIDEE-MICT (v8.4.1), a land surface model for the high latitudes: model description and validation, Geosci. Model Dev., 11, 121–163, https://doi.org/10.5194/gmd-11-121-2018, 2018.
Holmes, R. M., McClelland, J. W., Peterson, B. J., Tank, S. E., Bulygina, E., Eglinton, T. I., Gordeev, V. V., Gurtovaya, T. Y., Raymond, P. A., Repeta, D. J., Staples, R., Striegl, R. G., Zhuli-dov, A. V., and Zimov, S. A.: Seasonal and Annual Fluxes of Nutrients and Organic Matter from Large Rivers to the Arc-tic Ocean and Surrounding Seas, Est. Coasts, 35, 369–382, https://doi.org/10.1007/s12237-011-9386-6, 2012.
Jasechko, S., Kirchner, J. W., Welker, J. M., and Mc-Donnell, J. J.: Substantial proportion of global stream-flow less than three months old, Nat. Geosci., 9, 126, https://doi.org/10.1038/ngeo2636, 2016.
Kalnay, E., Kanamitsu, M., Kistler, R., Collins, W., Deaven, D., Gandin, L., Iredell, M., Saha, S., White, G., Woollen, J., Zhu, Y., Chelliah, M., Ebisuzaki, W., Higgins, W., Janowiak, J., Mo, K. C., Ropelewski, C., Wang, J., Leet-maa, A., Reynolds, R., Jenne, R., and Joseph, D.: The NCEP/NCAR 40-year reanalysis project, B. Am. Me-teorol. Soc., 77, 437–472, https://doi.org/10.1175/1520-0477(1996)077<0437:TNYRP>2.0.CO;2, 1996.
Kicklighter, D. W., Hayes, D. J., Mcclelland, J. W., Peterson, B. J., Mcguire, A. D., and Melillo, J. M.: Insights and issues with sim-ulating terrestrial DOC loading of Arctic river networks, Ecol. Appl., 23, 1817–1836, https://doi.org/10.1890/11-1050.1, 2013. Kutscher, L., Mörth, C. M., Porcelli, D., Hirst, C., Maximov,
T. C., Petrov, R. E., and Andersson, P. S.: Spatial variation in concentration and sources of organic carbon in the Lena River, Siberia, J. Geophys. Res.-Biogeosci., 122, 1999–2016, https://doi.org/10.1002/2017JG003858, 2017.
Lara, R. J., Rachold, V., Kattner, G., Hubberten, H. W., Guggen-berger, G., Skoog, A., and Thomas, D. N.: Dissolved or-ganic matter and nutrients in the Lena River, Siberian Arc-tic: Characteristics and distribution, Mar. Chem., 59, 301–309, https://doi.org/10.1016/S0304-4203(97)00076-5, 1998.
Laudon, H., Buttle, J., Carey, S. K., McDonnell, J., McGuire, K., Seibert, J., Shanley, J., Soulsby, C., and Tetzlaff, D.,: Cross-re-gional prediction of long-term trajectory of stream water DOC response to climate change, Geophys. Res. Lett., 39, L18404, https://doi.org/10.1029/2012GL053033, 2012.
Lauerwald, R., Regnier, P., Camino-Serrano, M., Guenet, B., Guimberteau, M., Ducharne, A., Polcher, J., and Ciais, P.: ORCHILEAK (revision 3875): a new model branch to sim-ulate carbon transfers along the terrestrial-aquatic continuum of the Amazon basin, Geosci. Model Dev., 10, 3821–3859, https://doi.org/10.5194/gmd-10-3821-2017, 2017.
McGuire, K. J., McDonnell, J. J., Weiler, M., Kendall, C., McGlynn, B. L., Welker, J. M., and Seibert, J.: The role of topography on catchment-scale water residence time, Water Resour. Res., 41, W05002, https://doi.org/10.1029/2004WR003657, 2005. New, M., Hulme, M., and Jones, P.: Representing twentieth-century
space-time climate variability. Part I: Development of a 1961–90 mean monthly terrestrial climatology, J. Climate, 12, 829–856, 1999.
Raymond, P. A., McClelland, J. W., Holmes, R. M., Zhulidov, A. V., Mull, K., Peterson, B. J., Striegl, R. G., Aiken, G. R., and Gurtovaya, T. Y.: Flux and age of dissolved organic car-bon exported to the Arctic Ocean: A carcar-bon isotopic study of the five largest arctic rivers, Global Biogeochem. Cy., 21, GB4011, https://doi.org/10.1029/2007GB002934, 2007.
Regnier, P., Friedlingstein, P., Ciais, P., Mackenzie, F. T., Gruber, N., Janssens, I. A., Laruelle, G. G., Lauerwald, R., Luyssaert, S., Andersson, A. J., Arndt, S., Arnosti, C., Borges, A. V., Dale, A. W., Gallego-Sala, A., Goddéris, Y., Goossens, N., Hartmann, J., Heinze, C., Ilyina, T., Joos, F., Larowe, D. E., Leifeld, J., Meysman, F. J. R., Munhoven, G., Raymond, P. A., Spahni, R., Suntharalingam, P., and Thullner, M.: Anthropogenic perturba-tion of the carbon fluxes from land to ocean, Nat. Geosci., 6, 597–607, https://doi.org/10.1038/ngeo1830, 2013.
Semiletov, I. P., Pipko, I. I., Shakhova, N. E., Dudarev, O. V., Pugach, S. P., Charkin, A. N., McRoy, C. P., Kosmach, D., and Gustafsson, Ö.: Carbon transport by the Lena River from its headwaters to the Arctic Ocean, with emphasis on flu-vial input of terrestrial particulate organic carbon vs. carbon transport by coastal erosion, Biogeosciences, 8, 2407–2426, https://doi.org/10.5194/bg-8-2407-2011, 2011.
Tootchi, A., Jost, A., and Ducharne, A.: Multi-source global wetland maps combining surface water imagery and ground-water constraints, Earth Syst. Sci. Data, 11, 189–220, https://doi.org/10.5194/essd-11-189-2019, 2019.
Ye, B., Yang, D., and Kane D. L.: Changes in Lena River stream-flow hydrology: Human impacts versus natural variations, Water Resour. Res., 39, 1200, https://doi.org/10.1029/2003WR001991, 2003.
Ye, B., Yang, D., Zhang, Z., and Kane, D. L.: Varia-tion of hydrological regime with permafrost coverage over Lena Basin in Siberia, J. Geophys. Res.-Atmos., 114, 0710, https://doi.org/10.1029/2008JD010537, 2009.