Does Decreased Research Funding from the National Institutes of Health to Local Academic Hospitals Cause an Increase in Industry Sponsored Research Funding?
By
John A. Truesdell, Jr.
MBA, Massachusetts Institute of Technology Sloan School of Management 2010 BA, University of Colorado, Boulder 2003
SUBMITTED TO THE HARVARD - MIT DIVISION OF HEALTH SCIENCES AND TECHNOLOGY IN PARTIAL FULFILLMENT OF THE REQUIREMENTS FOR THE DEGREE OF
MASTER OF SCIENCE IN HEALTH SCIENCES AND TECHNOLOGY at the
MASSACHUSETTS INSTITUTE OF TECHNOLOGY September 2011
© 2011 Massachusetts Institute of Technology. All rights reserved.
MASSACHUSETTS INSTlTUTE OF TECHNOLOGY
SEP 2 1 2011
uBRARIES
The author hereby grants MIT permission to reproduce and distribute public Ipaper and ele ronic copies
of this thesis document in whole or in part.
/
Signature of Author:
John A. Truesdell, Jr., MBA Biomedical Enterprise Program Harvard-MIT Division of Health Sciences and Technology Sept 06, 2011 Certified by:
I/
T. Forcht Dagi, MD, DMedSc, MPH, MBA Senior Lecturer, Harvard-MIT Division of Health Sciences and Technology Visiting Professor, Department of Global Health and Social Medicine, Harvard Me al School Certified by:
Jeffery Karp, PhD Assistant Professor in Medicine and Health Sciences and Technology, Harvard Medical School Director, Laboratory for Advanced Biomaterials and Stem-Cell-Based Therapeutics, Brigham & Women's Hospital Accepted by:
Ram Sasiskeharan, PhD Director, Harvard-MIT Division of Health Sciences and Technology Edward Hood Taplin Professor of Health Sciences & Technology and Biological Engineering
Does Decreased Research Funding from the National Institutes of Health to Local Academic Hospitals Cause an Increase in Industry Sponsored Research Funding?
By
John A. Truesdell, Jr.
Submitted to the Harvard-MIT Division of Health Sciences and Technology on Sep 6, 2011 in Partial Fulfillment of the Degree of Master of Science in Health Sciences and Technology at the
Massachusetts Institute of Technology
Abstract
The National Institutes of Health (NIH) has been the stalwart of research funding at universities and academic teaching hospitals. However, since the start of the last decade NIH funding has contracted in real terms. Anticipating future Federal Government fiscal austerity, the situation appears unlikely to improve and most likely will become worse. Local area teaching hospitals have explored other funding to support their large research infrastructure such as industry-sponsored research. This thesis qualitatively assessed whether the Federal Government and local area academic hospital fiscal data over the last six years support the hypothesis: Yes, industry funding has been received to support research at local area teaching hospitals to substitute for decreased availability of NIH funds.
To test the hypothesis, Federal and local hospital fiscal data were extracted and statistical analysis was performed in three key areas to challenge the hypothesis and eliminate confounding data. First, is National Institutes of Health funding decreasing in real terms? Second, have local area teaching hospitals compensated by soliciting and receiving greater levels of industry sponsored research dollars? Third, has industry increased support in light of decreased NIH funding or are industry research commitments uncorrelated? The test questions were evaluated across two different hospitals and against various economic benchmarks.
The hypothesis was rejected. Decreased NIH research funding granted to local academic hospitals has not caused a corresponding increase in industry sponsored research funding. Given the structural difficulties of industry and academic hospital collaboration, this likely impacts the level of industry sponsored research funding. Unfortunately, upcoming long-term Federal fiscal austerity may severely curtail NIH budgets. Academic hospitals will either need to consider greater industry collaboration or reduce the size and scope of their research activities.
Thesis Supervisor: T. (Teo) Forcht Dagi, MD, MPH, MBA, FACS, FCCM Thesis Supervisor: Jeffrey Karp, PhD
Dedication
To myfianci'e, May, for her love and support.
To my brother, Brad, for his perennial advice, counsel and
friendship.
To my parents, John and Stephanie, for providing an unshakeable foundation upon which I have built my life.
Acknowledgements
Biomedical technologies not only offer a new career but also an opportunity to improve lives of people around the world. Having spent many months in remote regions of the world, I have witnessed abject poverty and suffering. When I began my three years in the Biomedical Enterprise Program, I envisioned my goal was to learn all that could be learned to apply my knowledge to increasing access to healthcare. I selected this topic because research, whether government or industry sponsored is the engine that drives innovation. Innovation is the means to improving both healthcare quality and healthcare delivery.
I want to express my gratitude and appreciation for my thesis advisors, Prof. Teo Dagi and Prof.
Jeffrey Karp, who helped define my thesis. I also want to thank everyone who has made the Biomedical Enterprise Program a transformational period in my life. Being fortunate to have access to MIT, Harvard Medical School, Massachusetts General Hospital, and Harvard Business School throughout the last three years, has enabled me to learn from some of the most gifted, dedicated people in the field of medicine, science, and business. I would like to specifically acknowledge the following people who have been instrumental in my learning and growth, Prof. Richard Cohen, Prof. Howie Golub, Prof. Stan Lapidus, Prof. Ernie Berndt, Prof. Shiv Pillai, Dr. Rox Anderson, Dr. Warren Zapol, Dr. Michael Bailin, and members of the BEP Advisory Board.
Table of Contents
A bstract... 2
D edication ... 3
A cknow ledgem ents ... 4
List of Figures... 7
List of Tables ... 9
C hapter 1: Background... 9
Part 1: What is Research & Development? Biom edical Research and Developm ent Stages... 9
Part 2: Who Supports Research and Development? Fund G ranting Institutions ... 10
H istory of Industry and A cadem ic Collaboration... 11
G overnm ent Funded Research... 13
N ational Institutes of H ealth ... 13
Industry Sponsored Research... 15
Part 3: Who Seeks Research and Development Support? Funding Recipients ... 15
Part 4: How is Funding Pursued? Research and D evelopm ent Funding Process ... 17
For-Profit Funding Process... 19
Part 5: Why is Research and Development Important? D efinition of N om inal and Real Grow th ... 20
Research and D evelopm ent Productivity... 20
Research and Developm ent Intensity... 22
C hapter 2: Introduction ... 23
Thesis O bjective... 24
C hapter 3: M ethodology... 25
Review of Existing Literature... 25
Selection of Study Participants ... 25
Selection of D atasets... 25
C hapter 4: R esults... 27
Funding M ix at Each Hospital... 27
N IH Funding at Each Hospital... 31
For-Profit Funding at Each Hospital... 34
N IH Funding Trends at Each H ospital and N ationally ... 37
NIH Funding Trends vs. For-Profit Support at Each Hospital ... 39
C hapter 5: D iscussion... 42
Lim itations ... 43
Future Research ... 44
C hapter 6: C onclusions ... 45
N IH Funding Observations ... 45
For-Profit Industry Funding Observations... 47
Funding at A rea A cadem ic Teaching H ospitals ... 48
C hapter 7: Im plications... 49
List of Figures
Figure 1 - Federal Government Funding of Life Sciences Research by Department or Agency
... 1 3
Figure 2 - NIH Research Funding 1950 - 2010... 14
Figure 3 - NIH Research Funding Changes in 2005 Dollars...15
Figure 4 - Grants Process At-A-Glance... 19
Figure 5 - Life Sciences Patent Productivity Adjusted for Population ... 22
Figure 6 - B W H Funding M ix ... 28
Figure 7 - MGH Funding Mix ... 29
Figure 8 - Historical Comparison of NIH vs. For-Profit Industry Funding Mix at Academic T eaching H ospitals...30
Figure 9 - BWH NIH Funding... 31
Figure 10 - Average BWH NIH Award... 32
Figure 11 - MGH NIH Funding...32
Figure 12 - Average MGH NIH Award... 33
Figure 13 - Area Academic Teaching Hospitals Total NIH Awards... 33
Figure 14 - BWH Industry Funding. Data provided by Partners Annual Reports 2005-2010 ... 3 4 Figure 15 - Average BWH Industry Award... 35
Figure 16 - MGH Industry Funding... 35
Figure 17 - Average MGH Industry Award... 36
Figure 18 - Historical Total NIH Grant Funds... 37
Figure 19 - NIH Research Funding Growth YOY... 38
Figure 20 - Area Academic Teaching Hospitals Total NIH Funding Growth versus National T ren d s ... 3 8 Figure 21 - Area Academic Teaching Hospitals Average NIH Award versus National Trends Figure 22 - Area Academic Teaching Hospitals Total NIH Funding Growth versus Total Industry Sponsored Funding Growth... 40
Figure 23 - Area Academic Teaching Hospitals Average NIH Award versus Total Industry Sponsored Average Award Growth... 40
List of Tables
Table 1 - Research and Development Intensity by Organization for Economic Cooperation and
Development Country (OECD)... 21 Table 2 - Statistical analysis of for-profit research funding data... 37
Table 3 - Statistical analysis of NIH research funding ... 39
Table 4 - Statistical analysis that measures the relationship between NIH funding and for-profit industry funding at Brigham and Women's Hospital ... 41
Table 5 - Statistical analysis that measures the relationship between NIH funding and for-profit
industry funding at Brigham and Women's Hospital... 41 Table 6 - Regression analysis of Federal Government spending growth compared with NIH spending grow th ... 4 6
Chapter 1: Background
Part 1: What Is Research & Development? Biomedical Research and Development Stages "Research and development (R&D) comprises creative work undertaken on a systematic basis in order to increase the stock of knowledge (including knowledge of man, culture and society) and the use of this knowledge to devise new applications. Research and development is classified into three phases: basic, applied, and clinical."' Basic research is the fundamental level of discovery. Usually conducted by universities and academic hospitals, basic research is science without a defined commercial or product objective. Therefore the commercial benefit of basic
research is not prominently considered when a funding determination is made. However,
commercial applications are often found for the results of basic research. An area of basic research that has been the genesis for many commercial products is the identification of mutant genes responsible for a specific disease. An example is Philadelphia Chromosome (BCR-abl), which was first discovered in 1960 by Peter Nowell from University of Pennsylvania School of
Medicine as an anomaly associated with chronic granulocytic leukemia.2 His basic research
grant was funded by National Institutes of Health. It wasn't until decades later that a
commercializable product, Gleevac (Imatinib), took advantage of this early work. Therefore basic research builds the foundation for biomedical innovation by generating theories and ideas on which later applied research is based.
Applied research takes ideas developed during basic research and transforms those discoveries into applications usable in clinical practice. Frequently, the term of applied research is used interchangeably with translational research. Historically, research in this phase has taken place both in the public and private domain. However, private industry is the primary driver of applied research because the goals of applied research are to develop a concept product or process that has not only clinical value but also commercial value. Returning to the Gleevac example, after subsequent work that definitively identified the Philadelphia Chromosome as the transformative event for chronic myelogenous leukemia (CML), researchers at Novartis utilized high throughput
screens to determine likely drug candidates.3 This is a classic example of applied research
biomedicine. It has become a difficult handoff point between public and private funding, due to issues such as intellectual property, financial risk, and project control.
Clinical development is a stage that encompasses pre-human testing, such as pharmacodynamics, pharmokinetics, toxicity assays, animal and human testing. Clinical development is recognized in the United States by the Food and Drug Administration (FDA) clinical development phases
(Phase I, II, III) or FDA approval path (Pre-market Authorization).4 Primary goals are to ensure
the biomedical product is safe for human use, meet primary clinical endpoints, and identify
potential adverse events from use. Most clinical development is performed by industry5 as it is
the final step before commercialization; additionally other institutions lack the infrastructure and financial means to complete the long and expensive Food and Drug Administration approval process.
Part 2: Who Supports Research and Development? Fund Granting Institutions
In the United States, industry, govermnent, or non-governmental organizations, such as the Cystic Fibrosis Foundation, provide research and development (R&D) funding. While industry expends most of its research and development internally, there is a portion that is used for outside research, generally in conjunction with an academic hospital or a university. The Federal Government provides funding through its expansive networks of executive agencies and cabinet level departments. Most funds are granted to external researchers affiliated with universities, academic teaching hospitals and private industry.
History of Industry and Academic Collaboration
From the earliest days of academic institutions in the United States, academic-industry collaboration has existed. Prior to implementation of the Federal Government research and development complex in the mid-20th century, universities reflected the needs of the state and
communities in which they resided. Universities relied heavily on industry and private
individuals in their region to fund research and development activities.6 Early academic-industry
collaboration centered on agriculture, the primary industry of the United States at the time.
Federal support during the 1 9th century was non-existent as far as direct funding. However, the
Morrill Act of 1862, also known as the Land Grant Colleges Act, provided for the establishment of academic institutions to train individuals for and support the prevailing industries of the United States. The act states, "without excluding other scientific and classical studies and including military tactic, to teach such branches of learning as are related to agriculture and the mechanic arts, in such manner as the legislatures of the States may respectively prescribe, in order to promote the liberal and practical education of the industrial classes in the several
pursuits and professions in life."7
As the United States industrialized, the scope of research and development evolved. Disciplines, such as engineering, medicine, and chemistry, became the driving force for collaboration between universities and industry. From 1900-1940, academic-industry partnerships became
common. 8 New academic disciplines arose to satisfy the demand of academic-industry
partnerships. "Indeed, the academic discipline of chemical engineering was largely developed through such collaboration between U.S. petroleum and chemicals firms and MIT and the
University of Illinois."9 Academic-industry collaboration was less restricted and there existed
less of a basic to applied research handoff problem during the period prior to widespread government support of research. During the pre-government funding era, academic researchers helped produce innovations that aided both industry and furthered academic research. World
War II was the decisive turning point for a new academic-industry collaboration. The
monumental war effort required the Federal Government to shift a great deal of research to academic institutions. In tandem with the shift in responsibility came Federal funding, reducing industry funding to a minority component of academic institution's research budgets. Due to
government largesse, academic institutions grew to be the dominant research force in the post-World War II era, accounting for over 60% of all basic research in the United States by the start
of the 2 1s' century.10
Applied research still remained an important component at academic institutions, such as MIT,
to support military research and requirements. However, basic research came to dominate
academia. The focus on and growth in basic research dollars from the Federal Government decreased the impact and importance of industry relationships, leading to a diminished emphasis of applied research at academic institutions. According to the National Science Foundation's research survey, the size of industry funding at academic institutions comprised less than 10% of their total research budgets by 2000.11 This funding level is nearly a complete reversal from the turn of the previous century, when private industry supported the vast majority of research. The resultant effect of growing Federal Government support has pushed the United States towards a stratified biomedical research and development system. For basic research, a sizeable portion of the funding is supplied through the Federal Government, primarily through the National Institutes of Health (NIH). These funds are generally directed towards universities and academic medical centers. For applied and clinical development, most of the funding is committed by the private sector. The partitioning of basic research and development from later stages of R&D is the main structural contributor to the biomedical development handoff problem described earlier in this work. Numerous efforts have sought to correct this deficiency with one of the most
pivotal changes being the passage of the Bahy-Dole Act (United States Code Title 35, Parts
200-212) in 1980. This legislation granted universities, small businesses and non-profits control of intellectual property generated as a result of Federal Government provided funding. Consequently, the handoff from basic research conducted at universities, academic teaching hospitals, and non-profits to for-profit entities seeking to convert discoveries to commercial products improved dramatically. However, the divide still exists.
Government Funded Research
The Federal Government is a key provider of life sciences funding in the United States, supporting a vast array of projects, researchers, and institutions in every corner of the country. The Federal Government biomedical research apparatus is large and spread over many different
agencies and cabinet level departments.
Federal Government Funding for Life Sciences Research
by Department or Agency
National
Aeronautics and Space Department of Administration Veterans Affairs -034% 1.31% Nationa Department of
Homeland SecurityFo aion
0.13% 3.6t%
Department of of
Health and Human Services 06% Department of Defense Department of 1.16% Agriculture 0.93% Figure 1 - Federal Government Funding of Life Sciences Research by Department or Agency. Data provided by National Science Foundation. Life sciences research includes funds classified for biological and medical research.
The two largest, the Department of Defense and National Institutes of Health conduct research internally as well as award funds to outside investigators. The National Institutes of Health is the most well-known government source of biomedical research funding. However, the NIH focuses almost exclusively on basic research.
National Institutes of Health
The National Institutes of Health (NIH) is a component of the United States Department of
Health and Human Services. The organization is charged with funding, conducting, and
coordinating biomedical and health-related research. The NIH was created by an act of Congress in 1930, beginning as one institute. Additional institutes have been added and funded by Congress, creating what are now 27 separate institutes. The NIH is widely known as one of the prime funding mechanisms for principle investigators at universities and academic teaching
hospitals through the RO1 grant mechanism. As of 2010, the NIH distributed approximately
$35B to various institutions across the United States, comprising the majority of all biomedical
research and development funding.
NIH Research Funding 1950 - 2010 $25,000
1 ~ $20,000
a $15,000
$10,000
$5,000
-Current Dollars -2005 Constant Dollars
Figure 2 - NIH Research Funding 1950 - 2010. Data provided by National Institutes of Health. 2005 constant dollars adjusts all values for purchasing power of one dollar in 2005. Purchasing power is provided by the Bureau of Labor Statistics.
NIH Research Funding Changes in 2005 Dollars 80.00% 70.00% 60.00% 50.00% 40.00% 30.00% 20.00% 10.00% 1 0.00% -10.00% -20.00% - -
-Figure 3 - NIH Research Funding Changes in 2005 Dollars. Data provided by National Institutes of Health.
Industry Sponsored Research
The biomedical industry provides substantial funding to complete the applied research and clinical development phases. Generally, the entire burden of clinical development funding is borne by industry. In some cases, the Federal Government subsidizes clinical development through tax incentives or direct support for a commercial product aligned to a social or national security goal, examples include HINI vaccine and the Orphan Drug Act. The goal of for-profit industry-sponsored research is to seek profit. Therefore the decision to invest in a clinical development program is driven by a combination of potential costs, such as ease of regulatory pathway, and anticipated revenues, which are determined by clinical need, current competition, and potential market size.
Part 3: Who Seeks Research and Development Support? Funding Recipients
Among the prime recipients of both government and industry research and development funding are universities, medical schools, and academic teaching hospitals. Academic teaching hospitals
and medical schools are part of academic health centers that aim to train medical students and residents, in addition to performing research.
Medical schools provide basic medical training to prospective medical doctors before they receive their clinical experience at academic teaching hospitals. Medical schools also support their own research and development complex through a variety of medical and scientific graduate programs.
Academic teaching hospitals provide further medical education and training for future healthcare professionals such as doctors and nurses. Academic teaching hospitals are typically associated with a local medical school and may be wholly owned by that institution. However, there are examples of independent institutions with medical school affiliations. Two such institutions are Massachusetts General Hospital (MGH) and Brigham and Women's Hospital (BWH) in Boston,
MA. Both institutions are components of Partners Healthcare, a large hospital system in the
New England area. Mass General and the Brigham, as these two hospitals are locally known, are affiliated with Harvard Medical School. In many cases, academic teaching hospitals have extensive commitments to basic research and clinical development. This is especially true for Mass General and the Brigham. Both maintain an extensive network of laboratories and collaborations with notable Boston area universities, the Massachusetts Institute of Technology and Harvard University.
Funding for medical schools and academic teaching hospitals have several sources, which support operations, research and development costs:
e Direct Graduate Medical Education (DGME) payments for providing care to Medicare
and Medicaid patients. Each academic teaching hospital receives payment based on how many Full Time Equivalent (FTE) residents are being trained.
* Indirect Medical Education (IME) This payment compensates teaching hospitals for their higher Medicare inpatient hospital operating costs due to a number of factors.
- Managed care and insurance organizations reimburse at a higher rate for teaching hospitals due to higher costs associated with education.
* Revenue from other third party payers. * Other incentive programs:
o Medical Scientist Training Program (MSTP)
o National Health Service Corps (NHSC)
o Armed Services Health Profession Scholarship
e Research and Development Funding
o National Institutes of Health
o Other Federal Government Organizations
o State Governments
o Non-Profits
o For-Profits
= Sponsored Research
- Clinical Trial Centers
" Other Collaboration
Part 4: How Is Funding Pursued? Research and Development Funding Process
The first step in the research funding process is locating and responding to a request for proposals. The process is both time consuming and difficult. It requires a careful interplay between the grantor and the grantee. The grantor's objectives are many, from identifying the scientific merit of a proposal, to responding to the biases of the funding organization. In addition to developing an application with the greatest chance of success, the grantee must consider the goal of building a body of work for future scientific endeavors. This iterative process can be long with a heavy administrative burden. To alleviate researchers' administrative burden, most universities and academic hospitals have research administration offices to facilitate the interaction between the researcher and the granting agency.
After submission, the proposal generally is evaluated in multiple review processes. Every funding organization conducts a scientific review to critically evaluate the scientific feasibility of
a proposal, the competence of individuals involved, as well as the resources available and required. The reviewers grade and/or rank all the proposals received based on the scientific review. Some organizations, such as the Department of Defense, also have additional review processes above and beyond scientific review. In the Department of Defense's case, a military relevance review is conducted to ensure the proposal meets the goals of the Department of Defense.
Proposals that have passed all the review layers are granted the requested award or a compromise amount. The applicants are notified, and the research project begins. However, the process is far from over. Most institutions, especially Federal Government agencies, monitor awards closely. Oversight consists of reviews of progress either annually or based on milestones. Additionally,
financial audits are conducted to ensure proper expenditure of granted funds. Federal
Government agencies require exacting detail. For example, any single amount over $3,000 for materials may require competing bids, and the work effort of personnel involved in the research proposal has to be divided by milestone, phase, percent of time committed, month, and year. Failure to meet the requirements of reviews or audits can result in cancellation of the funding, so that agency funds may be transferred to other potential projects. These processes demonstrate why larger academic institutions and teaching hospitals develop a robust administrative
Grants Process At-A-Glance
Any successful project requires planning, development, implementation, and follow-through. Obtaining NIH funding for your research idea is no exception. The Grants Process At-A-Glance Chart below provides an overview of the steps required for an application to proceed from application planning and submission through award and close out. Look to the related resources on each page for special guidance from NIH experts that can help maximize your understanding of the grants process and help you submit a successful grant application. PannIng, Writn, Submitn
Plannnlfg: Applicant should start early, collect preliminary Writing: Applicant often begins writing application Submiti: Applicant organization data, and determine Internal deadlines, several months prior to application due date. submits most applications to NIH
through Federal portal, Grants.gov.
Recota nd Refierr
Months 1-3
Applications compliant with NIH policies are assigned for CSR assigns application to an NIH Institute/Center Scientific Review Officer (SRO) assigns review by the Division of Receipt and Referral In the Center of (IC) and a Scientific Review Group (SRG). applications to reviewers and readers. Scientific Review (CSR).
Poor Review
Months
Initial Level of Review: Priorfty Scoms: Summary Statement: Second Levelo
SRG members review and evaluate Available to Principal Available to Principal Revliew: Advisory applications for scientific merit. Investigator on eRA Investigator on eRA Commons. council/board reviews
Commons. applications.
Award
Months 9-10
Pre-Award Process: IC grants management staff conducts Notification of Award: NIH Institute/Center (IC) Congratulationsa final administrative review and negotiates award.* Issues and sends Notice of Award (NoA) to applicant Project period officially begins!
institution/organization.
*NIH Requests additional information needed lust-in-time for award.
Post-Award Manapement
Administrative and fiscal monitoring, reporting, and compliance.
NOTE: Timelne f based on the standard grants process. It does not reflect a shorter timeframe for grants undergoing expedited review (e.g., AIDS).
Figure 4 - Grants Process At-A-Glance. Flowchart provided by the National Institutes of Health, representing R01 grant funding process.
For-Profit Funding Process
Private company's research is profit motivated and therefore the award process is quite different. Recipients of for-profit funding are many times approached due to their particular expertise required for a project. The projects are product focused or have a clear commercialization path. Also, there are intellectual property and conflict of interest issues that increase the difficulty of academic and for-profit relationships. Less likely is a competitive process similar to what the National Institutes of Health employs to identify awardees.
Part 5: Why Is Research and Development Important? Economic Impact
Definition of Nominal and Real Growth
This thesis refers to growth frequently throughout. Growth measured by taking the change in absolute dollar amounts year over year divided by the absolute dollars at time zero is known as nominal growth. The nominal growth figure can then be converted to real growth by subtracting the consumer price index (CPI) value for that time period. Real growth therefore accounts for the normal inflation of dollars over time and provides an equivalent measure of the value of goods and services that can be purchased with research funding each year.
TO
Nominal Growth (in continuous time) = ln(y-), where T = dollars at time 0, 1.
Real Growth (in continuous time) = In (T- - In 1
'
1To CPIO)
Where CPI = consumer price index at time 0, 1.
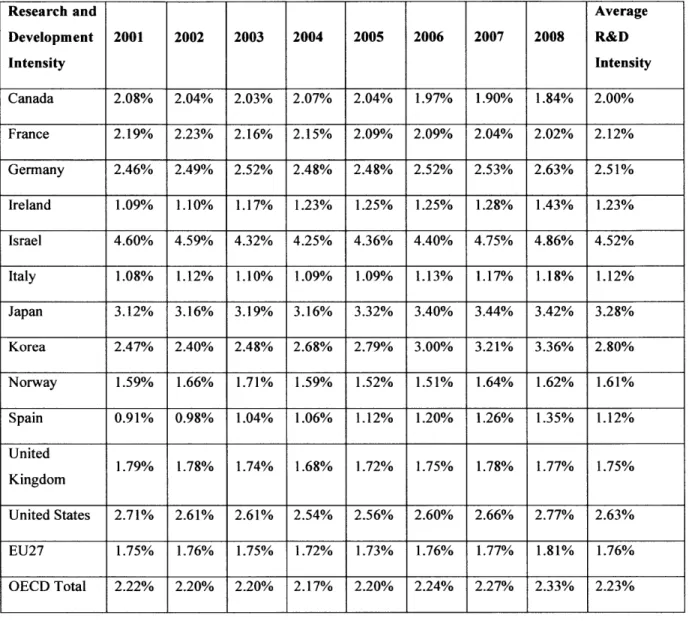
Research and Development Intensity
The United States has historically had one of the largest fractions of its gross domestic product
(GDP) dedicated to research and development spending, also known as R&D intensity, among
all other Organization Economic Cooperation and Development (OECD) countries. However, the United States' lead in R&D intensity has been quickly narrowed or eclipsed by other OECD countries. Additionally, emerging nations, such as China, are spending heavily in research and development both in the government and private sector.
Research and Average Development 2001 2002 2003 2004 2005 2006 2007 2008 R&D Intensity Intensity Canada 2.08% 2.04% 2.03% 2.07% 2.04% 1.97% 1.90% 1.84% 2.00% France 2.19% 2.23% 2.16% 2.15% 2.09% 2.09% 2.04% 2.02% 2.12% Germany 2.46% 2.49% 2.52% 2.48% 2.48% 2.52% 2.53% 2.63% 2.51% Ireland 1.09% 1.10% 1.17% 1.23% 1.25% 1.25% 1.28% 1.43% 1.23% Israel 4.60% 4.59% 4.32% 4.25% 4.36% 4.40% 4.75% 4.86% 4.52% Italy 1.08% 1.12% 1.10% 1.09% 1.09% 1.13% 1.17% 1.18% 1.12% Japan 3.12% 3.16% 3.19% 3.16% 3.32% 3.40% 3.44% 3.42% 3.28% Korea 2.47% 2.40% 2.48% 2.68% 2.79% 3.00% 3.21% 3.36% 2.80% Norway 1.59% 1.66% 1.71% 1.59% 1.52% 1.51% 1.64% 1.62% 1.61% Spain 0.91% 0.98% 1.04% 1.06% 1.12% 1.20% 1.26% 1.35% 1.12% United 1.79% 1.78% 1.74% 1.68% 1.72% 1.75% 1.78% 1.77% 1.75% Kingdom United States 2.71% 2.61% 2.61% 2.54% 2.56% 2.60% 2.66% 2.77% 2.63% EU27 1.75% 1.76% 1.75% 1.72% 1.73% 1.76% 1.77% 1.81% 1.76% OECD Total 2.22% 2.20% 2.20% 2.17% 2.20% 2.24% 2.27% 2.33% 2.23%
Table 1 - Research and Development Intensity by Organization for Economic Cooperation and Development Country (OECD). Data provided by OECD and represents the percentage of gross domestic product devoted to research and development in each country.
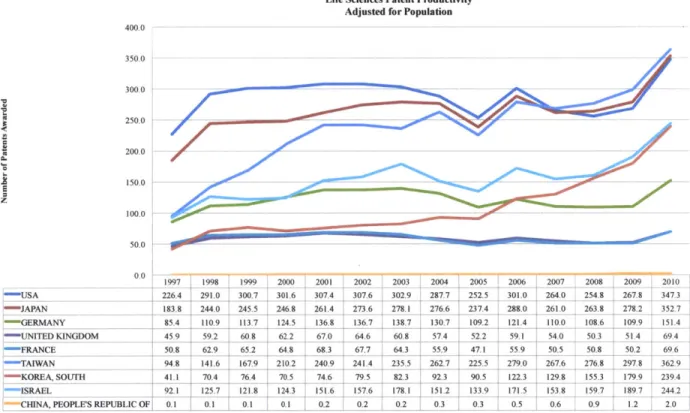
Research and Development Productivity
Research and development intensity is one measure of support for innovation in the national economy, but it is limited by being an input measure only. To achieve a complete understanding of the research and development commitment in the United States, a measure of output must be included as well. This measure is research and development productivity. Similar to other economic measures of productivity, such as worker productivity released by Bureau of Labor Statistics, this measure determines how many workers are required for one unit of economic output. In the R&D case, the measure determines how many people may be required for one unit of intellectual property output (patent).
Life Sciences Patent Productivity Adjusted for Population
400.0 350.0 300.0 250.0 200.0 150.0 z 100.0 50.0 0.0 1997 1998 1999 2000 2001 2002 2003 2004 2005 2006 2007 2008 2009 2010 ,USA 226 '4 291.0 300.7 301.6 307.4 307.6 302.9 2877 252.5 301.0 264.0 254.8 267.8 3473 J APA -N 183.8 244.0 245.5 246.8 261.4 273.6 278.1 276.6 237.4 280 261.0 263.8 278.2 352.7 , GERMANY 85.4 110.9 1113.7 124.5 136.8 136.7 138.7 130.7 109.2 121.4 110.0 108.6 109.9 151.4 "-41N DKINGDOM 459 59-2 60.8 62.2 67.0 6. 608 57.4 52.2 59.1 540 50-3 5L1 69,41 :FRANCE 50.8 62.9 65.2 64.8 68.3 67.7 64.3 55.9 47.1 55.9 50.5 50.8 50.2 69.6 :-TAIWAN 94 8 141.6 167.9 210.2 240.9 241.4 235.5 262.7 225.5 279.0 267.6 276.8 297.8 362.9 ' KOREA, SOUTH 411 70.4 76.4 70.5 74.6 79.5 82.3 92.3 90.5 1223 129.8 155.3 179 9 239.4 ISRAEL 92.1 125.7 1218 1243 151.6 1576 178.1 151.2 133.9 171.5 153.8 159.7 189.7 244.2 CHINA, PEOPLE'S REPUBLIC OF, 0.1 0.1 0.1 0.1 0.2 0.2 0.2 0.3 0.3 0.5 0.6 0.9 1.2 2.0
Figure 5 - Life Sciences Patent Productivity Adjusted for Population. Patent data provided by US Patent and Trademark Office, representing patent filings in the United States. Population data provided by the Central Intelligence Agency World Factbook.
Chapter 2: Introduction
Public and private research and development funds have been pivotal to the success of the life sciences industrial and academic complex in the United States. Research funding from both the Federal Government and the healthcare products industry have created a key competitive advantage for the United States, generating a much higher medical device, pharmaceutical, and biologic development productivity than other nations. Adjusting for population, only in the last two to three years did Japan and Taiwan reach equivalent productivity. However, as the previous data indicate, the United States has begun to lose this advantage. The causes are not certain. But one possibility is the drop in current and future levels of Federal Funding of life science research and development.
US Taxpayers fund the majority of life science related academic research through various
entities established by The United States Federal Government to administer research and development programs. The National Institutes of Health (NIH) is both the most important and well known of all designated agencies. Since the beginning of the 21st century, the Federal Government has failed to appropriate taxpayer funds for life science research at a rate at least proportionate to Gross Domestic Product growth. This trend is exemplified in NIH funding which encompasses approximately 90% of all Federal Government life science extramural research and development funds (Figure 2). Maintaining levels inline with or above the national gross domestic product growth is probably necessary to continue historical rates of innovation. The current public sector fiscal imbalances though make real growth in public sector life sciences research and development funding less probable.
As the government withdraws support, the void will lead to two options for academic teaching hospitals and other academic institutions. Option one, institutions can seek funding from the private sector, but life science product industry funding is not without its critics as worries of conflicts of interest are ever present. Option two, research institutions, such as academic teaching hospitals, can downsize their research and development infrastructure.
Thesis Objective
This thesis examines whether academic teaching hospitals and medical schools have compensated for the lack of real growth of Federal Government funds designated for life science research by accepting private industry research and development funds by investigating quantitative and qualitative trends that would support or invalidate the hypothesis.
Chapter 3: Methodology
Review of Existing Literature
A review of existing literature was the first step to addressing the thesis objectives. The review
was conducted to understand the following: public research and development funding process; private industry research and development process; development of academic research complex; and the history of research collaboration in the United States.
Selection of Study Participants
In the state of Massachusetts, no other academic teaching hospitals are as well known as the Massachusetts General Hospital (Mass General) and the Brigham and Women's Hospital (Brigham). The two institutions combined employ 2000 researchers and spend over $1.15B
annually on research.'2 Both hospitals have large research budgets providing the necessary
diversity and year-to-year stability of funds to facilitate analysis with minimal confounding. The other important consideration is the research budget data are available and segregated to identify sources and uses of funds. Massachusetts General and Brigham and Women's Hospitals have both provided the necessary information and detail to permit analysis.
Selection of Datasets
Data were chosen to accomplish four functions: identify source and use of research funds at area academic teaching hospitals; determine the drivers and effectors of Federal Government provided research dollars; determine the drivers and effectors of for-profit industry provided research dollars; and to draw macroeconomic relationships nationally and internationally.
Annual financial statements from Mass General and the Brigham detail the sources and uses of
research funds and are available with the required detail back to 2005. Additionally, the
Various sources of Federal data are utilized to draw relationships with the amount of Federal Government research funding each hospital receives. Below is a list of the data sources used:
1. National Institutes of Health - award data by year, institution, and researcher
2. National Science Foundation - research and development data both public funding and
private funding provided by year, institution, type, and scientific discipline
For-profit drivers and effectors were datasets that potentially demonstrate the relationship of private industry funding at Mass General and the Brigham with other relevant economic data.
1. New York Stock Exchange (NYSE) - NYSE pharmaceutical index and wider healthcare
product index historical data
2. Standard and Poors (S&P) - S&P 500 index historical data
Macroeconomic data analyzed to benchmark United States research productivity compared to the rest of the world.
1. United States Patent Office - patent information by year, geographic origin of the application, patent type, and scientific or technical group
2. Central Intelligence Agency - gross domestic product and population data for various
countries throughout the world
3. Organization for Economic Development (OECD) - research and development data by
country
Chapter 4: Results
The data collected were analyzed both qualitatively and quantitatively, using standard statistical techniques to determine trends and validate or invalidate the hypothesis. Approximately 70 spreadsheets were constructed to provide an output suitable for analysis and presentation in this thesis. The collected data were also checked in multiple databases to ensure accuracy before analysis.
Summary of Results
The data invalidated the hypothesis. Initial screens determined that the null hypothesis was likely before further examination. The detailed statistical examination only confirmed initial results. There is no correlation with decreases in Federal Government funding with increases of
private industry awards. In fact, Federal Government and for-profit industry funding act
independently of each other. Federal Government research and development funding is
correlated with overall growth in government spending. However, the benefiting agency or department of increased funding depends on the political climate at the time funds were appropriated. For example, the Global War on Terrorism, benefited the military and internal security apparatuses of the Federal Government, resulting in increases in Department of Defense support for the life sciences while National Institutes of Health funding levels remained static. Private industry support on the other hand generally follows the health of the overall economy. Gross domestic product growth, specifically the portion contributed by growth in corporate profits, is the measure to follow, but there are other cross currents that affect the life sciences industry, such as the growth of overall health care spending and changes in the status quo health care structure.
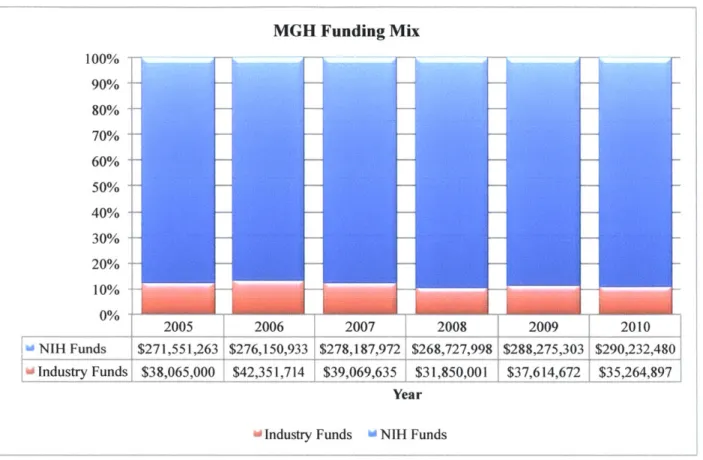
Funding Mix at Each Hospital
Mass General and the Brigham research budget sources track closely with the national average for NIH to private industry research funding at academic institutions, which is approximately a
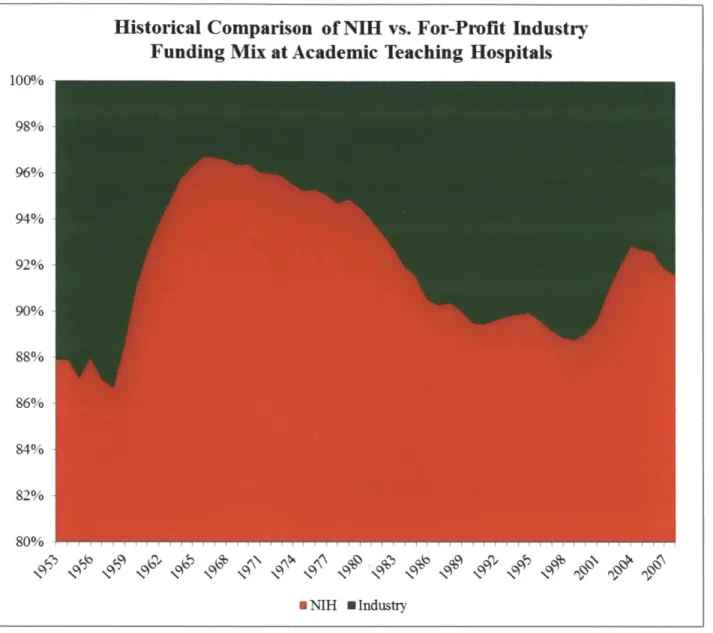
expansion of Federal Government research and development support during World War II (Figure 8). The two anomalies, when private industry support slipped well below 10%, are the
1960's and the start of the 2 1st century. This correlates with information provided in Figure 3,
showing large growths in NIH funding during those periods. Note life sciences funding from other agencies, such as the Department of Defense, do add some noise. However NIH support is an order of magnitude larger than support from other parts of Federal Government, reducing the confounding effects. BWH Funding Mix 100% 90% 80% 70% 60% 50% 40% 30% 20% 10% 0% 2005 2006 2007 2008 2009 2010 NIH Funds $241,573,355 $224,456,033 $237,008,447 $223,070,000 $239,149,360 $264,216,255 Industry Funds $28,986,000 $30,543,219 $34,197,351 $30,316,187 $32,813,845 $42,110,815 Year
[
Industry Funds 0 NIH FundsFigure 6 - BWH Funding Mix. Data provided by Partners Annual Reports 2005-2010 and NIH award database.
MGH Funding Mix 100% 90% 80% 70% 60% 50% 40% 30% 20% 10% 2%005 2006 2007 2008 2009 2010 NIH Funds $271,551,263 $276,150,933 $278,187,972 $268,727,998 $288,275,303 $290,232,480 Industry Funds $38,065,000 $42,351,714 $39,069,635 $31,850,001 $37,614,672 $35,264,897 Year
[
Industry Funds w NIH FundsFigure 7 - MGH Funding Mix. Data provided by Partners Annual Reports 2005-2010 and NIH award
Historical Comparison of NIH vs. For-Profit Industry
Funding Mix at Academic Teaching Hospitals
100% 98% 96% 94% 92% 90% 88% 86% 84% 82% 80% * NIH 0 Industry
Figure 8 - Historical Comparison of NIH vs. For-Profit Industry Funding Mix at Academic Teaching Hospitals. Data provided by the National Science Foundation.
NIH Funding at Each Hospital
The data represent annual NIH funding awarded to each institution. The two charts for each institution represent first the total NIH research funding awarded to the institution and the second shows the average amount per award. The second measure is a proxy for inferring the NIH's
willingness to commit to more or new projects. Many times new projects demonstrate
commitments to new researchers, and competition for NIH support has become fierce in the last
decade.'4 As described earlier, NIH funds have remained flat or have decreased slightly when
inflation is considered.'5 The NIH funding growth discrepancy observed in charts below for the
years 2009 and 2010 shows the effects of the American Recovery and Reinvestment Act of 2009.
The act provided an additional $8.97B to the NIH's budget16, producing the upward trend in
years 2009 and 2010. Therefore, 2009 and 2010 NIH budget increases should be ignored as meaningful change to long-term Federal Government budget priorities. Also, it is reasonable to assume and highly likely the NIH's budget will retreat to its 10 year moving average, following the expiration of American Recovery and Reinvestment Act. Current discussions in Congress
over the debt ceiling and reduction in Federal outlays support this scenario.
BWH NIH Funding $270,000,000 20.00% $260,000,000 15.00% $250,000,000 10.00% $240,000,000 5.00% $230,000,000 0.00% $220,000,000 -5.00% $210,000,000 $200,000,000 2004 2005 2006 2007 2008 2009 2010 Total Amount of Awards (2005 Dollars) $227,164,273 $241,573,355 $224,456,033 $237,008,447 $223,070,0001$239,149,360 $264,216,255
NIH Funding Increases from 2004 Baselme 0.00% 6.15% 0.00% 0.00/. 0.00% 0.00% 8.%%
Year
*--Total Amount of Awards (2005 Dollars) "NIH Funding Increases from 2004 Baseline
Figure 9 - BWH NIH Funding. Data provided by Partners Annual Reports 2005-2010. The growth measurement is from funding level in 2004 to mitigate year-to-year variability.
Average BWH NIH Award a C 0 C a U $500,000 $480,000 $460,000 $440,000 $420,000 $400,000 $380,000
Average Award (2005 Dollars)
NIH Average Award Increases from 2004 Baseline
2004 2005 2006 $451,619 $453,233 $431,646 0 00% 0.36% 0-00/0 210/ ZUU?3 $429,363 $415,400 0.00% 0.00% Year 20.00% 15.00% 2 10.00% 5.00% 0.00% -5.00% -10.00% 20092 2010 $449,529 $482,146 0.00% 6.18%
Average Award (2005 Dollars) -NIH Average Award Increases from 2004 Baseline
Figure 10 - Average BWH NIH Award. Data provided by Partners Annual Reports 2005-2010. The growth measurement is from funding level in 2004 to mitigate year-to-year variability.
MGH NIH Funding $295,000,000 $290,000,000 $285,000,000 $280,000,000 $275,000,000 $270,000,000 $265,000,000 $260,000,000 20.00% 15.00% 10.00% -45.00% 0.00% -5.00% $255,000,000 -10.00% 2004 2005 2006 2007 2008 2009 2010 0
Total Amount of Awards (2005 Dollars) $277,876,286 $271,551,263 S276, 150 933 $278 187,972 $268,727,998 $288,275,303 $290,232,480
NIH Funding Increases from 2004 Baseline 0.00% 0.00% 0.11% 0.00% 3.56% 0.68%
Year
-'Total Amount of Awards (2005 Dollars) NIH Funding Increases from 2004 Baseline
Figure 11 - MGH NIH Funding. Data provided by Partners Annual Reports 2005-2010. The growth measurement is from funding level in 2004 to mitigate year-to-year variability.
Average MGH NIH Award $435,000 --- $435,000 $420,000 $415,000 $410,000 $405,000 $400,000 $395,000 $390,000 $385,000
Average Award (2005 Dollars) 8$429,48
NIH Average Award Increases from 2004 Baseline 0.00%
20.00% 2005 $409,580 0.00% 2006 2007 $425,502 $411,521 0.00% 0.000/ Year 20081 $402,287 0.00% 2009 $419,615 0.00 / 15.00% t 10.00% 5.00% 0.00% -5.00% -1000% 2010 $415,806 0 00%
Average Award (2005 Dollars) "NIH Average Award Increases from 2004 Baseline
Figure 12 - Average MGH NIH Award. Data provided by Partners Annual Reports 2005-2010. measurement is from funding level in 2004 to mitigate year-to-year variability.
Area Academic Teaching Hospitals Total NIH Awards 800 700 600 500 400 300 200 100 0
BWH NIH Funding Total Number of Awards MGH NIH Funding Total Number ofAwards
BWH NIH Growth of Total Number of Awards MGH NIH Growth of Total Number of Awards
503 647 0.00/6 0.00% 520 649 0.00% 0.00% 552 537_ 676 668 3.50% 0.00% I.94% 0.00% 7.00% 6.00% 5.00%/0 4.00% 3.00% 2.00% 1.00% 0.000/ -1.00% Luuy Zulu_ 532 548 687 698 0.00% 0.00% 1.61% 1.590%
Figure 13 - Area Academic Teaching Hospitals Total NIH Reports 2005-2010.
Awards. Data provided by Partners Annual
It is important to note a meaningful driver of funding composition at academic teaching hospitals is the preferences of the researchers. Researchers have preferred NIH grants, such as the RO1 grant. They provided multi-year support, were well understood and served as a pedigree toward achieving tenure within an academic institution.
The growth
For-Profit Funding at Each Hospital
The charts below represent the annual for-profit funding data at each institution. Similar to the
NIH funding charts above, the first chart for each hospital shows overall for-profit industry
support. The second chart for each hospital is a representation of the average support per award to provide a comparison with the similar measure for NIH awards. While actual awards will vary from the average, the measure demonstrates intensity of support or commitment per researcher. Although academic medical centers and other academic institutions have a small fraction of their overall research funding support originating from private industry compared to
NIH funding, a majority of all research faculty maintain some relationship to industry. These
relationships range from direct financial support by the for-profit industry, to consulting or
advisory roles, to founding a for-profit start-up company.17
BWH Industry Funding $45,000,000 30.00% $40,000,000 25.00% $35,000,000 20.00% $30,000,000 15.00% $25,000,000 0 10.00% $20,000,000 5.00% $15,000,000 $10,000,000 0.00% $5,000,000 -5.00% $0- 20520 -10.00% 2007 2008 2009 2010
Total Amount of Awards (2005 Dollars) $28,986,000 $30,543,219 $34,197,351 $30,316,187 $32,813,845 $42,110,815
Industry Funding Increases from 2005 Baseline 0.00% 8.41% 14.11% 0.00/O 0.00/ 25.85%
Year
-Total Amount of Awards (2005 Dollars) Industry Funding Increases from 2005 Baseline
Figure 14 - BWH Industry Funding. Data provided by Partners Annual Reports 2005-2010. The growth measurement is from funding level in 2005 to mitigate year-to-year variability.
Average BWH Industry Award
$0 T
Average Award (2005 Dollars)
Industry Average Award Increases from 2005 Baseline
2005 2006 $1,035,214 $1,018,107 0.000/ 1.51% 2007 $683,947 0.00% 2008 2009 $819,356 $763,113 0.00% 0.00% Year
- Average Award (2005 Dollars) Industry Average Award Increases from 2005 Baseline
Figure 15 - Average BWH Industry Award. Data provided by Partners Annual Reports 2005-2010. growth measurement is from funding level in 2005 to mitigate year-to-year variability.
The MGH Industry Funding $45,000,000 20.00% $40,000,000 $35,000,000 r $30,000,000 $25,000,000 $20,000,000 $15,000,000 $10,000,000 $5,000,000 $0
Total Amount of Awards (2005 Dollars) Industry Funding Increases from 2005 Baseline
zuu3 zUvo $38,065,000 $42,351,714 0.00% , 10.67% zuu/ LuS $39,069,635 $31,850,001 0.00% 0.00% Year zuM" LUIu $37,614,672 $35,264,897 0.00% 0.00%
- Total Amount of Awards (2005 Dollars) mmmindustry Funding Increases from 2005 Baseline
Figure 16 - MGH Industry Funding. Data provided by Partners Annual Reports 2005-2010. The growth measurement is from funding level in 2005 to mitigate year-to-year variability.
$1,200,000 $1,000,000 $800,000 $600,000 $400,000 $200,000 20.00% 15.00% 2 10.00% E 5.00% 7E 0.00% E -5.00%
4
~1 t -10.00% $738,786 0.000/ 15.00% 10.00% 5.00% 0.00% -5.00% -10.00%Average MGH Industry Award $700,000 20.00% $600,000 15.00% $500,000 10.00% $400,000 1i 5.00% $300,000 0.00% $200,000-$100,000 -5.00% 2005 2006 2007 2008 2009 2010 -10.00%
Average Award (2005 Dollars) $475,813 $572,320 $651,161 $448,592 $464,379 $414,881 Industry Average Award Increases from 2005 Baseline 0 00/. 18.47% 12.91% 0.00% 0-000/ 000%
Year
- Average Award (2005 Dollars) Industry Average Award Increases from 2005 Baseline
Figure 17 - Average MGH Industry Award. Data provided by Partners Annual Reports 2005-2010. The growth measurement is from funding level in 2005 to mitigate year-to-year variability.
A regression analysis was conducted to measure potential correlations between for-profit
research finding and two distinct industry/macroeconomic measurements. The first independent variable used was the New York Stock Exchange Healthcare Index (NYSE HC). The index is a cross section of life science product firms, health insurers, and other firms within the healthcare vertical. The index acts as a good proxy for overall healthcare spending both private and public. Additionally, equity prices reflect an expectation of growth of cash flows, and increases in cash flow enable industry to support research efforts. Of the two regressions against the NYSE HC index, only Massachusetts General model was significant, showing a positive correlation to performance of the index. This would be the expected result for both datasets.
The second independent variable used was Gross Domestic Product (GDP), which provides an aggregate of the value of all goods and services produced within the national economy. While less specific than the NYSE HC index, GDP serves as an overall barometer of national economic performance. Healthcare over the long term has been a non-cyclical part of the economy and should be insensitive to changes in GDP. Unfortunately, neither dataset provided statistically significant information to link for-profit industry research funding support to GDP.
Crrelation Standard Error
INDUSTRY FUNDING AWARDED TO BWH VS. NYSE HC INDEX 0.424222517 0.337694909 INDUSTRY FUNDING AWARDED TO MGH VS. NYSE HC INDEX 0.650764349 0.263085349 INDUSTRY FUNDING AWARDED TO BWH VS. GDP 3.15717947 2.953964817 INDUSTRY FUNDING AWARDED TO MGH VS. GDP -2.130500716 3.612799336
t Stat 1.256230123 2.473586433 1.068793864 -0.58970912 P-value Lower 95% 0.297956135 -0.650473398 0.089778499 -0.186490647 0.363522875 -6.243654947 0.596854002 -13.62804062 Table 2 - Statistical analysis of for-profit research funding data.
NIH Funding Trends at Each Hospital and Nationally
Having compared Federal Government research funding at both academic teaching hospitals, these results are now benchmarked to national trends. The data were evaluated both from an absolute dollar perspective across all academic institutions inclusive of independent hospitals and medical schools as well as total number of awards made. The data present a clear reduction of total awards made by the NIH, which coincides with a marked decrease in total NIH funding in real terms (Figure 15). Figure 16 reaffirms the data by showing real growth over the same period for total NIH funding and the size of the average award.
Historical Total NIH Grant Funds
$20,500 48.000 47.500 o $20,000 47,000 $19,500 46,500 46,000 < .S $19,000 45,500 Z $18,500 45,000 / 44,500 1 $18,000 44,000 $17.500 43,500 2004 2005 2006 2007 2008 2009 2010 Year
am& Total Amount of Awards (2005 Dollars) i=Total Number of Awards
Figure 18 - Historical Total NIH Grant Funds. Data provided by National Institutes of Health.
Upper 95%
1.498918432 1.488019346
12.55801389 9.367039184
NIH Research Funding Growth YOY
8.00% -- -- -6.00% 4.00% 2.00% - - -0.00% 200 2006 2007 2008 2009 -2.00% -4.00% -6.00% ---YearNational NIH Total Growth YOY (real) Average Award Growth YOY (real)
Figure 19 - NIH Research Funding Growth YOY. Data provided by National Institutes of Health.
Figure 20 and 21 place the performance of Mass General and the Brigham with respect to NIH funding side by side with national averages. There is no obvious correlation over the entire dataset. However, there appears to be a strong correlation in years 2008 and 2009.
Area Academic Teaching Hospitals Total NIH Funding Growth versus National Trends
12.00/-10. 00% 8 00A 6.00%---6.00% 40 00%6 2 .00%/ -4 00%--- - ---- --6.00%/ -8. 00 M - --
---1000%
2005 2006--
2007-0
2008-L -
2009-
2010j BWH NIH Funding Total Growth YOY (real) 6.55% -7,28% 5. 80% -6.07% 723% 10 69%
0 MGH NIH Funding Total Growth YOY (real) -2.36% 1.78% 1 0.81% -349% 7.29% 0.73%
0 National NIH Total Growth YOY (real) -0 33% -3.38% -150% -3. 89% 2.70% 0.99% Figure 20 - Area Academic Teaching Hospitals Total NIH Funding Growth versus National Trends. Data provided by Partners Annual Reports 2005-2010 and National Institutes of Health.