DOE/ET-51013-287
A Comparison of Methods for Monitoring Low
Airborne Concentrations of Argon-41 and
Tritium, with MIT-PFC Design Applications
James C. McLoughlin
Plasma Fusion Center
Massachusetts Institute of Technology
Cambridge, MA 02139
August 1990
This work was supported by the U. S. Department of Energy Contract No.
DE-AC02-78ET51013. Reproduction, translation, publication, use and disposal, in whole or in part
by or for the United States government is permitted.
A COMPARISON OF METHODS FOR MONITORING
LOW AIRBORNE CONCENTRATIONS OF ARGON-41 AND TRITIUM, WITH MIT-PFC DESIGN APPLICATIONS
by
JAMES CHRISTOPHER MCLOUGHLIN
Submitted to the Department of Nuclear Engineering on August 10, 1990 in partial fulfillment of the requirements for the Degree of Master of Science in
Nuclear Engineering
ABSTRACT
Two primary methods, GM- and NaI-detection, of airborne
4Ar monitoring were compared experimentally to determine the
lowest resolvable concentration given reasonable sample sizes.
NaI-detectors provided a lower resolvable concentration than
GM tubes, primarily due to energy resolution, which greatly
reduced background noise.
Airborne 3H collection was compared for two primary
collection (water bath and dessicant traps) and one ancillary
method (direct condensation). All 3H detection was performed
via liquid scintillation. Tritium collection with water baths
yielded higher collection efficiencies than dessicant traps
for short (5 24 hrs) sampling durations. As the length of the
sampling duration increased, water traps yielded lower
collection efficiencies than dessicant traps, primarily due to
evaporation of water (including 3H) from the water traps.
Direct condensation (with dry ice as a coolant) as a
collection method of airborne 3H was found unsuitable, since
large amounts of gas were initially condensed, yet evaporated
as the sample's coolant was removed.
'1Ar detection for the MIT-PFC was determined to be best
provided by a low 40K
NaI crystal shielded with lead and steel. A Marinelli beaker was used as a monitoring volume to hold the
effluent sample. 3H monitoring at the MIT-PFC was fulfilled
with dessicant traps to catalytically separate the [HTO] and [HT] fractions without the use of a carrier gas for the [HT].
Thesis Supervisor: Gordon Brownell, Ph.D.
Title: Professor of Nuclear Engineering
Thesis Co-Supervisor: Frederick F. McWilliams, M.S., C.H.P.
Title: Reactor Radiation Protection Officer MITR-II
Thesis Reader: Catherine Fiore, Ph.D.
This work was supported by the U.S. Department of Energy under contract number DE-ACO2-78ET51013.
ACKNOWLEDGMENTS
The author would like to thank Dr. Gordon Brownell, the
thesis supervisor, for his undaunted patience during the production of this document and the research performed.
Additional thanks are due Frederick F. McWilliams, C.H.P., who
provided daily analysis, enthusiasm, and technical expertise
which was inherently necessary for the completion of this
project. Without his asistance and patience this thesis
would not be possible. It is not possible to explain the debt owed to Dr. Catherine Fiore, who as thesis reader and employer provided the most patience and expertise which could have
humanly been afforded. Her scientific strength and personal
sensitivity have made a world of difference. The final thanks
go to the members of my family, each of whom instilled confidence and fortitude when the well ran dry.
DEDICATION
For J.P. McLoughlin and E.H. Beermann, who are not forgotten, and for Roseanne McLoughlin and Stephen Duffy, who were present when I most needed them.
CONTENTS
Page
1. INTRODUCTION...10
1.1 Overall Objective and Scope...10
1.2 Background of Problem...11
2. ANALYTICAL CONSIDERATIONS...15
2.1 Introduction...15
2.2 Dosimetry and Biological Effects...15
2.2.1 Definitions...17
2.2.2 Gamma Dose Computations --External Exposures...23
2.2.3 Beta Dose Computations --External Exposures...24
2.2.4 Internal Exposures...25
2.3 Modeling Physical Dispersion of Released Effluents...28
2.3.1 Plume Movement and Meteorology...29
2.3.2 Lapse Rate Meteorology...30
2.3.3 Transport Pume Movement & Stability Effects...32
2.3.4 Diffusive Plume Movement & Stability Effects...34
2.3.5 Reduction of Source, Q(t), by Radioactive Decay & Dilution... 39
Page 2.3.6 Effects of Pulsed Nature of
Effluent Production...40
2.3.7 Effective Stack Height --A Safety Factor...45
2.4 Dose Estimates: Assimilation of Dosimetry, Dispersion Theory & Pulse Effects...46
2.5 Radiation Detection & Monitoring Theory...52
2.5.1 Radiation Detector Properties...53
2.5.2 Gas-filled Detectors...54
2.5.3 Scintillators...55
2.5.4 Liquid Scintillation...58
2.5.5 Noise Considerations...59
2.6 Basic Hydrogen Chemistry -- Tritium Effects...60
2.6.1 Dessicant Traps...60
2.6.2 Water Traps...61
2.6.3 Differential Analysis: Dependence upon Catalyst...64
3. EXPERIMENTAL PROTOCOLS...67
3.1 Introduction...67
3.2 4 1Ar Detection Experiments...67
3.2.1 4 1Ar Pre-Experimental Assumptions...67
3.2.2 4Ar Experimental Approximations & Procedures...69
3.2.3 Presentation of 41Ar Sampling & Monitoring Apparatuses...70
Page 3.3 3
H Detection Experiments...73
3.3.1 Tritium Pre-Experimental Assumptions...77
3.3.2 3H Experimental Approximations & Procedures...80
3.3.3 Presentation of Tritium Collection Apparatuses...86
3.3.4 Ancillary Tritium Collection System...86
3.3.5 Tritium Flow Calibration --Technical Analysis...93
4. RESULTS AND ANALYSIS...95
4.1 Introduction...95
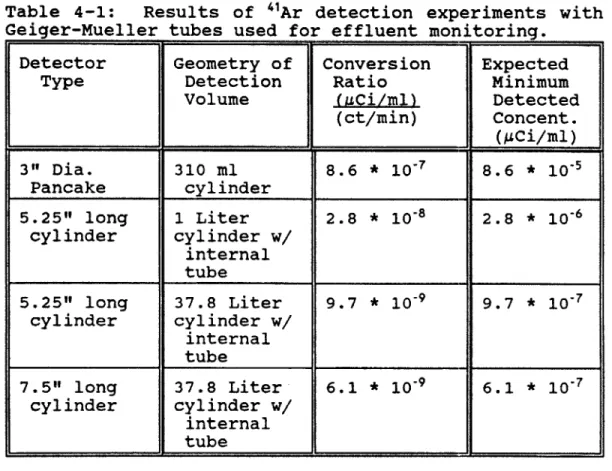
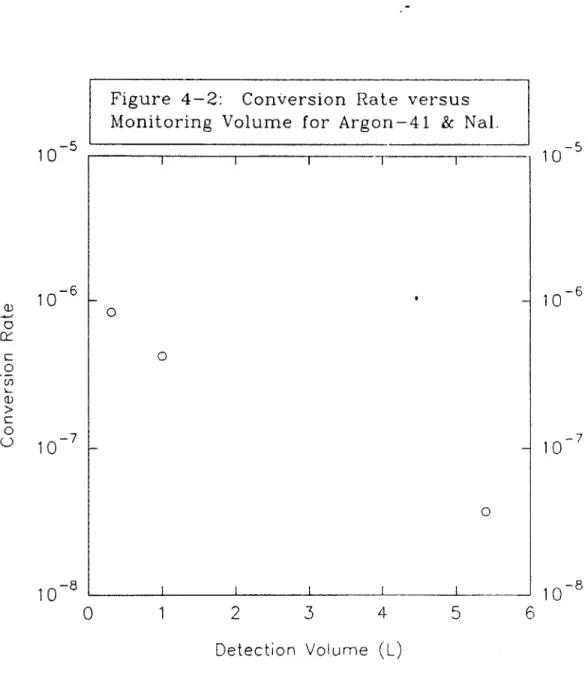
4.2 "Ar Detection Via GM Tubes...95
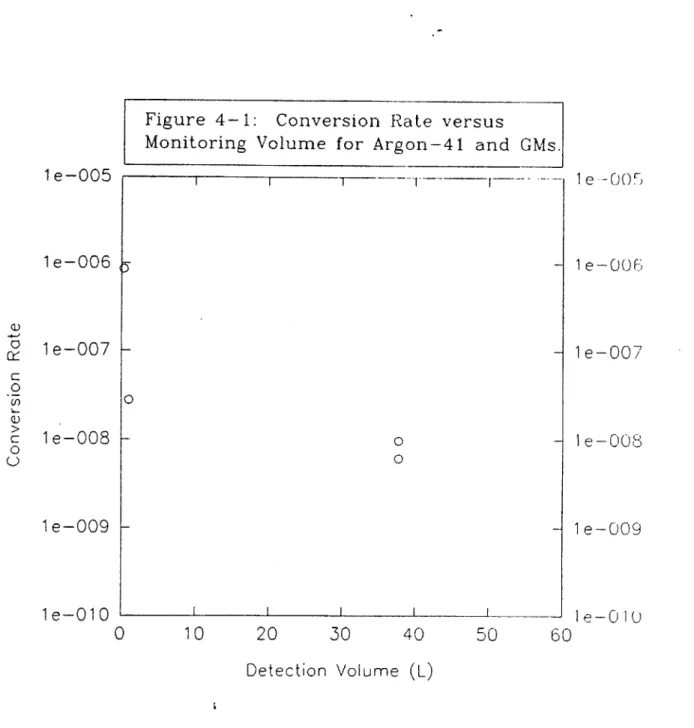
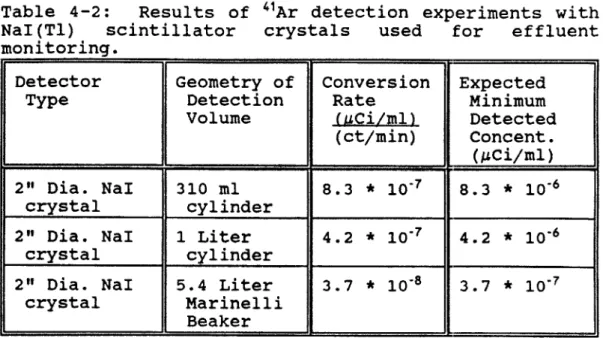
4.3 "Ar Detection Via Scintillators...99
4.4 "Ar Comparison of GM and Scintillators...101
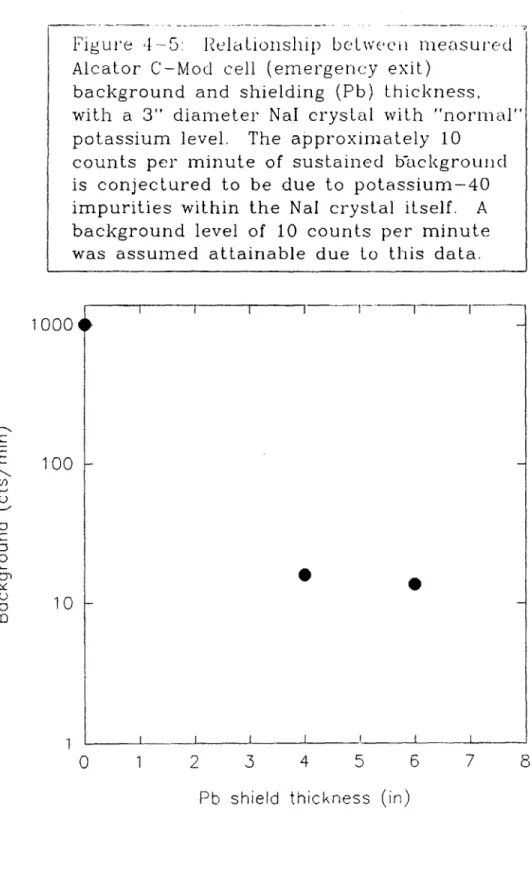
4.4.1 Alcator C-Mod NaI Background Measurements...102
4.5 Results of 3H Collection Upon Dessicant...104
4.5.1 Dessicant Standardization...104
4.5.2 Flow Calibration Over Dessicant Traps.. .107
4.5.3 Airborne Tritium Calculations...110
4.5.4 Differential [HTO]/[HT] Analysis...111
4.5.5 Effects of Size of the Dessicant Traps..112
4.5.6 Quantitative Recovery of Effluent Via Mass...114
4.6 Results of 3 H Collection Via Water Traps...115
Page
4.6.1 Flow Calibration For Water Traps...115
4.6.2 Water Trap Size & Loss of Moisture...115
4.6.3 Differential [HTO]/[HT] Analysis...117
4.7 3H Comparison of Dessicant & Solubility Collection...117
4.8 3H Direct Cold Trap Results...119
5. DESIGN APPLICATIONS AT MIT-PFC...120
5.1 Introduction...120
5.2 4 1Ar Monitoring System Designs...120
5.2.1 4'Ar Sampling System...120
5.2.2 4Ar Sampling System Design Constraints..123
5.2.3 41Ar Sampling System Head Loss Calculations...124
5.2.4 Design of Shielding for 41Ar Detection Volume...127
5.3 Design of 3H Monitoring System...130
6. CONCLUSIONS...133
6.1 Introduction...133
6.2 Tritium Recovery Methods...133
6.3 4Ar Detection Methods...134
CHAPTER 1
INTRODUCTION
1.1 Overall Objective and Scope
The primary purpose of this document is to examine the
best available methods for monitoring two specific airborne
isotopic effluents. Utilization of this information in the
design of fixed effluent monitoring systems for the M.I.T. Plasma Fusion Center's Alcator C-Mod experiment is a strict
intention. The isotopes in question are argon-41 (4 1Ar) and
tritium (3H) .
The M.I.T. Plasma Fusion Center is located at 167 Albany
Street in Cambridge, Massachusetts. The primary concern for
radioactive effluents is dose assessment for the general
public due to normal operation of the facility and the
proximity of the public to the point of release. Urban
environments such as Cambridge, Massachusetts tend to increase
such proximity when compared to rural releases of effluent.
The variance of the effluent concentration within the
atmosphere surrounding the point of release is of primary
concern for purposes of dose estimates to the urban public.
The overall scope of this project will be to try to
design and install systems which will accurately measure
airborne 41Ar and 3H at lesser concentrations than the lowest
1.2 Background of Problem
Due to the projected low neutron fluence of the Alcator
C-Mod experiment, the anticipated airborne radioactivity
generated and the ultimate concentration of release are very
low by health physics standards; therefore, a method of
monitoring must be established having high sensitivity.
Commercially available detection units do not provide the
desired (required) sensitivity.
4 1Ar and 3
H are the effluents of concern since both will be the principal radionuclides produced during operation. Originating from a tokamak-type pulsed fusion reactor, the neutron fluence will produce 41Ar via neutron capture (n,y) nuclear reactions with some of the naturally occurring 4 0Ar atoms within the experimental cell's air. Argon typically constitutes approximately 0.934% (by volume) of dry air, of
which approximately 99.6% (0.930% of the air) is the isotope
40Ar. 2 Such naturally occurring
40Ar atoms act as excellent
"target" nuclei (based upon thermal absorption
cross-sections3) for neutron capture reactions over a portion of the
anticipated energy spectrum of the (tokamak-produced) neutron
1Weast, R.C., ed. Handbook of Chemistry and Physics, CRC Press, Boca Raton, Florida. p. F-148.
2Walker, F.W., et. al. Chart of the Nuclides, Knolls Atomic
Power Laboratory. San Jose, Ca: General Electric Company. 13th
ed., 1983.
3
Lamarsh, John R., Introduction to NUCLEAR ENGINEERING. 2nd
fluence.
4After capturing a neutron, each
40Ar
nuclide
becomes a radioactive
41Ar
nuclide.
41Arnuclei subsequently
decay with a half-life of 1.83 hours and emit 1.198 MeV
p-particles and 1.29 MeV y-rays.
5Such electromagnetic (y-ray)
and electron
(0-particle)
emissions
by
41Ar
are
major
contributors to the radiation dose which the public will
encounter from the Alcator C-Mod experiment.
The emission of tritium, the radioactive isotope of
hydrogen, from the Alcator C-Mod experimental cell will also
contribute to the radiation dose to the public. Admission of
tritium to the air within the experimental cell may occur
during opening of the experiment's vacuum chamber. The bulk
of the tritium will be carried to the exhaust duct in sealed
vacuum exhaust lines.
Such tritium will be exhausted from the
experimental
cell along with the
41Ar
due to the constant
"cycling"
of
the air within the cell.
The method of
production of the tritium within the vacuum chamber is via a
Deuteron-Deuteron
(D-D)
nuclear fusion reaction which
is
denoted
6by
2H(d,p)
3H.
Tritium and
41Arproduction are similar
in that they both occur due to nuclear reactions; however,
tritium is a direct product of fusion in this experiment,
whereas
4Ar is produced as a secondary effect due to liberated
4
Fiore, C.L. Alcator C-Mod Final Safety Analysis. Cambridge:
M.I.T. Plasma Fusion Center, 1989., p. 34.
5
Walker, F.W. et. al., Chart of the Nuclides., 1983.
neutron fluence. Tritium decays with a half-life of 12.3
years and emits P-particles with an energy of 0.0186 MeV.7
The most significant initial limitation concerning the
design of the effluent monitoring systems is that they must
fit concisely within the experimental cell area or its
immediate vicinity during operation of the experiment. The
implication for the 41Ar detection system is
such that the detection detection volume (which is screened to determine the airborne concentration) must be within reasonable dimensions. Reasonable dimensions are those which allow the entire system
to be placed in the overhead portion of the southeast
emergency exit pathway from the experimental cell.
In order to allow for installation and maintenance while
not occluding the emergency exit pathway, it was empirically
determined that the major components of the 4 1Ar monitoring
system should be able to be placed upon a platform at
approximately 6.5 feet above the grade of the lowest portion
of the emergency exit. This platform would be limited in size to approximately 4 feet wide (when facing east) by 2.5 feet in
breadth. Due to size limitations imposed by the exhaust duct
present in the southeast emergency exit, the maximum height of
the 4'Ar monitoring system components needs to be limited to 3 feet above the mounting platform which has already been
described.
The tritium monitoring system will be placed within the
experimental cell of the Alcator C-Mod experiment. Effluent
air sample will be both acquired from and returned to an air
CHAPTER 2
ANALYTICAL CONSIDERATIONS
2.1 Introduction
When considering the ionizing radiation (and its effects) to be liberated by the Alcator C-Mod experiment, several
concepts must be introduced. Topics necessary for a complete
understanding of the physical processes include radiation
dosimetry and biological effects, a theory for modeling
physical dispersion of released isotopes (with specific
reference to the "pulse" production of the radiation
emitters), radiation detection/monitoring theory, sample
acquisition theory for gases with specific reference to flow
and energy (frictional head loss) considerations, and some
basic chemistry regarding hydrogen. Due to the nature of the
particular applications contained herein and the limited
domains of most physical theories, applicable domains will be
noted (when necessary) for theories discussed.
2.2 Dosimetry and Biological Effects
The sources of radiation to be considered herein are
radioactive elements. The property of radioactivity is
determined by nuclear stability; moreover, unstable nuclei attempt to reach stable states by undergoing transitions. Such transitions generally involve the emission of radiation.
Each nuclear transition is considered a disintegration, with
"activity" being a measure of disintegration rate.1 Activity
is measured in units of Curies (Ci), where one Ci is equal to
3.7*1010 disintegrations per second. The microcurie (ACi), a
more practical measurement for this document, is equal to 10-6
Ci.
The primary interactions of radiations with matter
include ionizing (directly vs. indirectly) and non-ionizing events. Ionizing events, which can be attributed to y-ray and
charged particle radiations (e.g.: a- and P-particles) create
ions by coulombically liberating atomic electrons. (Neutrons
may create ionization indirectly through the liberation of
protons in nuclear interactions; subsequently, these protons
can directly generate ionization.) Non-ionizing events, which are usually limited to neutron or very-low-energy y
interactions, involve scattering or capture of free neutrons
or scattering of ys, usually without the direct formation of
charged particles or free ions.2
Exposure, defined only for x- and y-ray radiations, is
the ratio of charge created (by rays via ionizing events) per
unit mass within a volume (AQ/Am as Am -+ 0) . This definition
is limited to cases where all electrons liberated within the
Krane, Kenneth. Modern Physics., New York: John Wiley &
Sons., pp. 240-241.
2Knoll, Glenn F. Radiation Detection and Measurement, 1V
volume are completely stopped within the same medium. 3
(Although the term Exposure is no longer defined by the
international health physics community, due to its historic significance it is still commonly used within the United
States in fields such as instrumentation and calibration of
radiation protection devices.)
The minimum amount of energy necessary to ionize atoms is
not constant for all elements; moreover, this amount of
energy, which is determined by quantum mechanical constraints, is referred to as the work function of an atom. 4 Since
ionizing events are necessary to create a net exposure within
a homogeneous material, ionization can be categorized either
according to net charge created or overall energy deposited.
2.2.1 Definitions
Radiation dose, unlike medicinal dosage (which is
generally measured in units of mass or volume delivered), is
a measure of energy deposited within a given mass of substance
(units: Energy/Mass, from AE/Am as Am - 0). When the
substance within which deposition occurs is living tissue, biological effects are inherent. Each radiation type may produce distinctly different biological effects per unit absorbed dose; moreover, this is due, at least in part, to the
ionization density along the path of each radiation type. A
3
Lamarsh, J.R. Introduction to NUCLEAR ENGINEERING, p. 465.
4Krane,
Kenneth Modern Physics.
New York: John Wiley & Sons,
quantity which is directly related to the observation of
biological effects would be more useful and convenient than
radiation dose.
To fulfill this need, the quantity Dose Equivalent5 is
established, which is essentially the product of the dose and
a linear scaling factor. The scaling factor represents the
effectiveness of different types of radiation in inflicting biological damage per unit of energy deposited. Two separate
sets of factors, the Relative Biological Effectiveness (RBE)
and Quality Factor (QF) ,6 are commonly used. RBE values are
determined experimentally (with most having a specifically defined endpoint biological effect), whereas QF values are often estimates assigned by the International Commission on Radiation Units and Measurements (ICRU), and represent the
observations of stochastic risks.
RBE and QF values are strongly dependent upon the
distribution of the energy deposition (i.e., ionization
density already described) along the path of the radiation through the biological material. The best measure of this distribution is the value of the Linear Energy Transfer (LET)'
of the radiation (units: Energy/length). Radiations such as
1 MeV neutrons and naturally occurring a-particles have high
5Lamarsh, J.R. Introduction to NUCLEAR ENGINEERING., p. 403.
6
Lamarsh, J.R. Introduction to NUCLEAR ENGINEERING., pp. 402-403.
7Lamarsh, J.R.
QF values (and high LET values8
) of approximately 10, whereas
x-rays and y-rays (and liberated electrons) have low QF values of 19.
The common units of measurement for absorbed dose are the
rad and the Gray (SI). The rad is defined as deposition of
100 ergs/gram of material. One Gray is exactly equal to 100 rads, or 1 J/kg (SI) . Dose equivalent, when using a QF value
as a scaling factor, is measured in units of rem when dose is
measured in rads, and units of Sievert (SI) when dose is
measured in Gray.10
Radiation exposures may be classified into two general
categories, internal and external exposures. External
exposures occur when biological effects arise due to
"radiation incident upon the body from the outside," whereas
internal exposures are due to "radiation emitted from
radionuclides absorbed [or deposited] into the body."" For
the purposes of this document, exposure to 4 1Ar is primarily
an external exposure, whereas exposure to 3H is considered to
be an internal exposure only. In the strictest sense of exposure (ionization) and radiation dose (6E/6m) this is untrue; however, from the biological effect (Dose Equivalent)
8Knoll, Glenn F.
Radiation Detection and Measurement., p. 77.
9Lamarsh, J.R. Introduction to NUCLEAR ENGINEERING., p. 404.
10Knoll, Glenn F.
Radiation Detection and Measurement., pp.
76-78.
1 1Lamarsh, J.R. Introduction to NUCLEAR ENGINEERING.,
point of view, this is an entirely accurate approximation, due
primarily to the radioactive nature of tritium. Tritium is a
pure P-emitter of such low energy that the range in tissue of
the maximum energy 0-particle is less than the thickness of
the outer "dead layer" of cells within the epidermis.1 2
Tritium can provide an internal dose when present within an
inhalation pathway; from an area such as this it can be
incorporated into body fluids.
The physical state of the radioactive material is of
great significance for determining the ultimate dose
consequence. In the strictest scientific sense there are only three states: the solid, liquid and gaseous states. When considering airborne radioactive materials, two airborne
classifications are identified, the first being the gaseous
state. The second classification is airborne particulates.
Gases are accurately defined as "monomolecular distributions
... formed by evaporation or sublimation" whereas particulates are "agglomerates of molecules in the liquid or solid state." Examples of liquid particulates are mists and fogs, while
dusts, fumes and smokes are examples of solid particulates.13
Aerosol is a term in use to describe disperse systems of
particulates within air. The significance of these
1 2F.F. McWilliams,
MIT Reactor Radiation Protection Officer
personal interview., May, 1990.
13Randerson, Darryl, ed. Atmospheric Science and Power
Production (DOE/TIC-27601)., Springfield, Virginia: Technical
Information Center, Office of Scientific and Technical Information, U.S. Dept. of Energy. 1984, p. 686.
definitions toward this problem is that the assumption will be
made that both 4Ar and 3H effluents do not act as aerosols but
rather as gaseous airborne emitters. This is an excellent
assumption for 4'Ar, which is an inert gas, while for tritium
this assumption is somewhat limited by atmospheric conditions
such as absolute humidity, temperature and atmospheric
pressure. Under conditions of low temperature, high relative
humidity and relatively high atmospheric pressure, tritiated
water [HTO] which is in the gaseous state may form particulate
mist or fog. Such an occurrence usually requires near 100%
relative humidity at a high temperature prior to cooling to a
lower temperature in order to cause misting. Since the
relative humidity within the experimental cell is not expected to reach 100%, the gaseous state assumption will be maintained
for tritium as well as for 4'Ar.
The gaseous state assumption is one characteristic
necessary to describe the movement of the radioactive
materials upon release to the atmosphere.
A radiological cloud is a relatively well-defined volume
containing a radiation-emitting isotope(s) present in either
(or both) of the gaseous or particulate classes. If the concentrations of the isotopes within the cloud are constant
over a specified region (this occurs rarely and only with exact meteorological conditions) , then the cloud is said to be
homogenous over that region.14
The concept of an infinite cloud is significant in
dosimetry since dose calculations are often possible only when such an assumption is made. An infinite cloud is a cloud
(containing radiation emitters) of dimensions which are large
compared to the distance that the emitted radiations travel
before absorption. Such dimensions allow an equilibrium to be
established between the rate of energy release (due to
radiation emission) and the rate of energy absorption per unit
volume of cloud15
(commonly referred to as the Energy Spatial
Equilibrium). In such clouds, the dose rate then becomes
proportional to the rate of energy emission. Perfect infinite clouds rarely if ever occur, yet the concept is useful for
estimating maximum dose rates in near-uniform clouds of
radiological effluents. An important note is the current lack
of a direct analytical method to predict dose rates within an
inhomogeneous finite effluent cloud, when concentration varies
according to time and atmospheric conditions.
Radioactive elements which decay via -emission do not liberate all /-particles at a single energy, but over an
energy spectrum which is characterized by a maximum energy,
which is usually quoted. For a large number of atoms of a
given O-emitting isotope (such as 3H), the average energy of
14Randerson, D., ed. Atmospheric
Science and Power
Production., p. 710.
15Randerson, D., ed.
Atmospheric Science and Power Production, p. 710.
the f-particles emitted will be approximately one-third of the
maximum energy of the spectrum.16
2.2.2 Gamma Dose Computations -- External Exposures
For an infinite cloud of a radioactive material (which is
limited to y-emission only) such that the emitting isotope is
distributed uniformly throughout the cloud, the following equation describes the rate of energy liberation, which is
equal to the dose rate in air within the cloud.
aD (Y'
-at
x EY (1.6*10~6) (3.7*1010) (1293) (100)(1)
where:E
=
x
=
1.6 * 10-6 3.7 * 1010 -1293 100total dose (rads),
averag y disintegration energy (Mev/dis),
concentration of the y emitter
in units of (Ci/m3) ,
the number of ergs per MeV, disintegration rate per Curie,
dis/(s-Ci)
density of air at STP, (g/m3),
conversion factor, energy absorption
per gram of material per rad,
(erg/ (g-rad))
It should be noted that the primary gas which occupies the
cloud is atmospheric air, with the radiation emitter having a
relatively low concentration in comparison to the gases
comprising air.
The dose delivered to any object (with dimensions small
compared to the dimensions of the infinite cloud) within such
a y-emitting cloud is simply the time integral of the above
equation (1), which is:
D ,-) = (0.507)E,
fxdt
(2)0
where all symbols are as defined for equation (1), and
the integral over dt is a time integral over the exposure
time.
2.2.3 Beta Dose Computations -- External Exposures
The dose rate within a homogeneous infinite cloud of a
#-emitter can be expressed in a similar manner to equation (1).
For a fl-emitter, this expression becomes: 7
cID, = X Ep (1.6 -10-6) (3.7 . 1010)
at (1293) (100)
where F is now the average energy of the emitted
6-particles.
Equation (3) can be reduced to: 18
'D(P ) = (.458) E,
x
(4)at
E
The dose delivered externally due to such a #-emitting cloud
is the time integral of equation (4), which is:
1 7Randerson, D.
Atmospheric Science and Power Production p.703.
18Randerson, D. Atmospheric Science and Power Production. p.703.
D = (.458) E5 fx(t)dt (5) 0
which, for clouds having constant concentration chi (x) versus
time, becomes:
D = (.458) E0 x t (6)
where t is the amount of exposure time (in seconds) spent
within the cloud.
A careful examination of equations (2) and (5) yields a
rather curious observation. Beginning with equations (1) and
(3), the dose rate equations, how can identical equations for a- and -emitters yield different constants when the dose rates are integrated over time? These different constants are 0.507 and 0.458 in equations (2) and (5) respectively. The
explanation for this anomaly is based upon the media for which
the dose quantities are derived. Air is the reference medium
for dose due to y-rays, whereas tissue is the medium for dose
due to /-particles. The ratio of the stopping powers of
tissue and air is approximately 1.11 to 1.13. The ratio of
0.507 to 0.458 is 1.11; therefore, equations (2) and (5),
which yield time-integrated dose information, are
clarified. 19
2.2.4 Internal Exposures
19F.F. McWilliams, MIT Reactor Radiation Protection Officer,
Internal exposure occurs when a radioisotope is inhaled,
ingested or some other way absorbed into the body.21 In the
case to be considered herein, 41Ar will not be considered to
be inhaled by a person who is within the effluent cloud. Since Argon is an inert gas, it can be assumed that for short time durations (=5 minutes) within the effluent cloud, all 4 Ar which is inhaled and does not radioactively decay within the
lungs will be exhaled shortly upon exit from the effluent
cloud. (Noble gases are insoluble in water, the major
constituent of blood.21)
Tritium cannot be assessed in the same manner. Inhaled
tritium will be assumed to be primarily in the form of
tritiated moisture vapor (HTO). Such moisture can be treated
as undergoing successful exchange with body moisture
(epithelial lung lining, blood volume, etc.) leading to
reduced exhalation of tritium.2 2
Due to its replacement of body moisture, tritium is
considered to travel throughout the body and deliver its dose
as a whole body dose for internal exposures.
Inert 4'Ar, which can be exhaled effectively, will also
be assumed to deliver its dose to the whole body since the entire body is within the "range" of the y-rays emitted by 41Ar
molecules within the lungs. (The mass attenuation coefficient
20
Lamarsh, J.R. Introduction to NUCLEAR ENGINEERING. p.446.
2 1
Lamarsh, J.R. Introduction to NUCLEAR ENGINEERING, p.454.
22
for 1.25 MeV y-rays passing through water is 0.0630 cm2/g; moreover, tissue is essentially water, yielding the mean free
path of such y-rays in solid tissue as essentially 15.9
cm. )23
Internal exposure to both charged particles and y-rays is
dependent upon the amount of radionuclide (C(t) in gCi)
present in the body, both the average amount of energy
liberated by each disintegration and the fraction of the internally liberated energy which is retained within the body.
The absorbed dose rate is given by:
aD
= (3.7 * 104) C(t) E (7)at
which, upon substitution and multiplication by a QF value,
yields the dose equivalent rate:
aH
_ (5.92 * 10-4) C(t) EQ (8)at M
where H is the dose equivalent delivered (in rem), M is
the mass (in grams) of the organ containing C(t) amount of the radionuclide (in gCi).
In order to account for the distribution of radiation emitter
over various energies as well as the fraction absorbed of the
emitted radiation, the effective energy equivalent is
defined.24 The effective energy equivalent, xi
(i),
is a23Lamarsh, J.R.
Introduction to NUCLEAR ENGINEERING. p.648.
24
weighted average of the energies emitted (and absorbed) as
well as associated QF values, which applies as follows:
H _ (5.92 * 10-4) C(t) { (9)
) t M
The internal exposure dose equivalent due to 41Ar clouds
is generated by evaluating equation (9) for the C(t) and M values characteristic of the cloud, and for the amount of time
spent within the cloud. For tritium, the amount of isotope
inhaled is evaluated based upon respiratory rate and time spent within the cloud; however, tritium is not appreciably
exhaled from the bloodstream after absorption into same.
Removal of absorbed 3H must be via decay and excretion, which are cumulatively expressed as the biological half-life (t(1, b) of tritium being 11.9 days. 25
Calculations have determined that for the applications
considered herein, 4Ar dose equivalents derived from internal
exposures are insignificant when compared to those derived from external exposures; however, tritium dose equivalents from internal exposures can be substantial, particularly if inhalation occurs at points very near the stack exhaust. This
section has been provided for accuracy and unity. Internal
exposures will only be considered further for tritium
effluent.
2.3 Modeling Physical Dispersion of Released Effluents
Infinite clouds represent idealized situations concerning effluent releases. Actual effluent movements require modeling to estimate airborne concentrations; however, even the most accurate models are limited by their statistical time-average
nature.
2.3.1 Plume Movement and Meteorology
A column of gas containing radioactive effluent
"emanating from the mouth of a continuously emitting chimney
or smoke stack is called a plume."26 The dispersion of such
a plume is governed by the atmospheric (meteorological)
conditions present at and about the site of plume release.
With certain conditions the plume may be approximated by an
infinite cloud which shows little atmospheric dispersion.
Under other conditions, such as turbulence, dispersion may be
so dramatic that the airborne concentration of the radioactive
material is depleted within a relatively short distance from the release point.
The method and degree of atmospheric dispersion are
generally determined by the "stability" of the atmosphere
surrounding the release point. Two methods are available for
assessing the stability of the atmosphere, the first being based upon the adiabatic lapse rate, and the second based upon
the standard deviation of the wind direction.2 7
26
Lamarsh, J.R. Introduction to NUCLEAR ENGINEERING. p.554.
2 7Lamarsh, J.R.
Introduction to NUCLEAR ENGINEERING. pp. 549-560.
Dispersion is a general term which refers to the decrease
in concentration of effluent within a plume. Dispersion is
generally treated as having two components: A gross or bulk
transport component based upon the adiabatic lapse rate
(vertical temperature gradient) stability of the environment, and a turbulent diffusion component. 28 Turbulent diffusion is not molecular diffusion ("trivial in the atmosphere" 29),
the type most easily demonstrated by a solute suspended in a
solvent. Molecular diffusion is due to "successive collisions of individual particles," whereas turbulent diffusion is
attributed to "cumulative effects of turbulent eddies in the
atmosphere. ,30
2.3.2 Lapse Rate Meteorology31
Given a differential volume of air with cross-sectional
area A and height dz (where z is the axis extending above and
below the Earth's surface, which is considered locally planar) the difference in pressure acting upon the top versus the bottom face of the differential volume is proportional to the
density of the air:
28Lamarsh, J.R. Introduction to NUCLEAR ENGINEERING. p.556
29Randerson, D.
Atmospheric Science and Power Production. p.8.
30Lamarsh, J.R. Introduction to NUCLEAR ENGINEERING. p.556.
31Lamarsh, J.R. Introduction to NUCLEAR ENGINEERING. pp. 549-555.
=pg
P9(10)
8z
where P is atmospheric pressure, p is atmospheric
density, and g is acceleration due to gravity.
If air is considered an ideal gas, then the general ideal gas
law must be approximated:
PV = nmRT
(11)
If mass atmospheric air motions are fast in relation to the
rate of heat (energy) transfer, then the atmospheric motions
can be considered to be adiabatic, such that:
T = ka P((-1)/Y) (12)
Y = C /CV (13)
where ka is an appropriate scaling constant, cp is the
specific heat of air at constant pressure, and c. is the specific heat of air at constant volume.
Substituting the ideal gas and adiabatic equations into the
expression for pressure variation according to elevation, the
lapse rate equation is generated:
C (14)
az
where C is a constant called the lapse rate which has the
T = To - CZ
where z is the altitude above ground level, T is the temperature at any altitude z, and To is ground-level
temperature.
An adiabatic lapse rate infers a linear relationship between
altitude and temperature, where the temperature decreases with
increasing altitude.
The atmospheric temperature profile does not always
follow an adiabatic curve; regions may exist where the
temperature is constant (isothermal) or increasing (inversion)
with increasing altitude. When temperature decreases (with
increasing altitude) at a rate faster than the adiabatic rate, a superadiabatic condition occurs. When the rate is less than
adiabatic, the atmosphere is termed stable. The temperature
profile greatly affects the dispersion of an effluent plume
via the transport component already introduced.
2.3.3 Transport Plume Movement & Stability Effects
If a'mean horizontal wind speed exists, then the constant release of a plume from a stack will result in two vaguely
defined macroscopic flow stages. The first stage of plume
movement is the quasi-vertical stage, during which time the
plume rises and is "bent over" by the horizontal wind. The
second stage is the quasi-horizontal (bent over) stage, such
that the plume's approximate trajectory is horizontal. The stability of the atmosphere primarily affects the
quasi-horizontal stage. These effects are evidenced as
near-horizontal movement of the plume perturbed into one of five
recognized plume patterns: fanning, fumigation, looping,
coning and lofting.
Fanning occurs when effluent is emitted into an inversion
atmosphere,33 such that the plume rises buoyantly until it
reaches a stable temperature. Unidirectional horizontal wind
can cause the plume to bend over and continue in a well-defined trajectory with both upper and lower edges of the plume being (relatively) distinct and near-horizontal. If horizontal wind is not originating from a single direction,
then the plume may spread out like a fan in a horizontal
plane. Fanning is associated with an atmosphere which is
stable both above and below the plume.
Fumigation occurs when the atmosphere is stable above yet
neutral below the plume.34
Such a condition yields a
near-horizontal upper plume edge and a diffuse lower plume which
lacks a clear edge.
Looping occurs when the plume is emitted into a fully
3 2Randerson,
D. Atmospheric Science and Power Production. p.328.
33
Lamarsh, J.R. Introduction to NUCLEAR ENGINEERING. p.328.
34
Lamarsh, J.R. Introduction to NUCLEAR ENGINEERING. pp.
unstable atmosphere.35 In this case both the upper and lower plume edges are defined yet are rarely horizontal. The plume
shows some random behavior and may even reach ground-level,
depending primarily upon stack-height.
Coning occurs when the atmosphere is fully neutral. The
plume in the quasi-horizontal stage resembles "a cone with a
horizontal axis."3 6 Both upper and lower plume edges are
well defined while neither is near-horizontal.
Lofting occurs when the plume is released and the
atmosphere above the quasi-horizontal stage is neutral while
the atmosphere below the plume is stable. The lower and upper edges are well-defined, yet only the lower edge is
near-horizontal. This type of plume favors the dispersal of
effluents at higher altitudes yet retards dispersal at the
lower edge of the plume; consequently, a lofted plume is most
favorable for the effective and safe dispersal of
effluents.37
2.3.4 Diffusive Plume Movement & Stability Effects
In addition to gross plume movements, turbulent diffusion
may account for some of the dispersion of atmospheric
effluents. Treatment begins with a Fickian expression for the
three-dimensional diffusion of an effluent plume:
35Lamarsh, J.R. Introduction to NUCLEAR ENGINEERING. p. 555.
3 6Lamarsh, J.R. Introduction to NUCLEAR ENGINEERING. p. 555.
37
ax
=K
ax aYaZ
2X X- K x + K + Kaz (16)
at *ax2 a y2 az2
where x(x,y,z) is the plume concentration field over space, and Kx, KY and K. are the diffusion coefficients in
the x-, y-, and z-directions.
A Fickian expression is utilized herein because experimental
evidence suggests38
that this type of initial expression
gives the most accurate concentration predictions for
relatively small distances from the point of emission; in
addition, the scale of applicable meteorological conditions
is slightly limited. Ostensibly, this restricts pure Fickian theory from being employed to explain diffusion in cyclonic
currents, at large distances from the point of emission, and
for extremely small clouds (where molecular diffusion may predominate); moreover, this can be understood as a definition
of both high- and low-scale spatial and high-scale
meteorological limits.39
When a horizontal wind with mean speed U is present the
Fickian expression must be updated :
aX + 5-A = K + K -2 + K
-(17)
at
ax
Xax
27aY
2za2
If the rate of effluent emission is constant, and the general
assumption that diffusion in the direction of the wind is
3 8
Wexler, H. ed. Meteorology and Atomic Energy. Washington,
D.C.: U.S. Dept. of Commerce, Weather Bureau, 1955., p. 38.
3 9
negligible when compared to transport due to the wind itself,
equation (17) reduces to:
U- K + K
-3x K
ay
2+z 2 (18)
which has the solution:40
x (x,y, z)
=
Qexp[--
(u
+ I)]
4x K K
4 in x K-YKz
A pure Fickian Diffusion model thus suggests that the
effluent, moving along the x-axis, spreads out in a Gaussian
fashion into the x-y and x-z planes. The mathematically
derived standard deviations of these Gaussian spreads are:
2xK = = Gy= 2 xK, (20)
where ay and az are the standard deviations of the Gaussian plume concentration in the y- and z-directions.
These values are usually referred to as the "diffusion parameters" when they are substituted into the Fickian
diffusion solution to provide the more useful Gaussian plume
expression:41
40Lamarsh, J.R. Introduction to NUCLEAR ENGINEERING.
557.
p.
'Randerson, D. Atmospheric Science and Power Production. p. 590.
Qexp[
-(z-h) 2 ]) (x y2za Y2 2 0 z 2 (21)
where Q is the strength of a "point source" located at
coordinates (0, y,, h) ; yo is the initial y- coordinate of the stack "point source"; h is the emission height of
the stack, and all other terms are previously defined.
The point source, Q, for the present model, emits a fixed
rate of effluent (Ci/s) to the atmosphere.
The change in nomenclature from standard deviations to
"diffusion parameters" is very significant, since it
delicately introduces the notion that the turbulent diffusion model incorrectly ignores the stability of the atmosphere into
which the effluent is released.42 Indeed, experimental
evidence suggests that this is a critical flaw; however, the
entire derivation is not obsolete. Pasquill and Gifford have
shown that the spread of effluents in the x-y and x-z planes
remain Gaussian; however, the values for the diffusion
parameters require experimental determination, which Pasquill and Gifford have provided. Essentially, the Fickian diffusion model grossly underestimates the diffusion parameters as a
function of distance from source (due to atmospheric
stability); consequently, Fickian diffusion vastly
overestimates plume concentrations, particularly along the
4 2Randerson, D.
Atmospheric Science and Power Production. p. 590.
central x-axis of plumes. 43
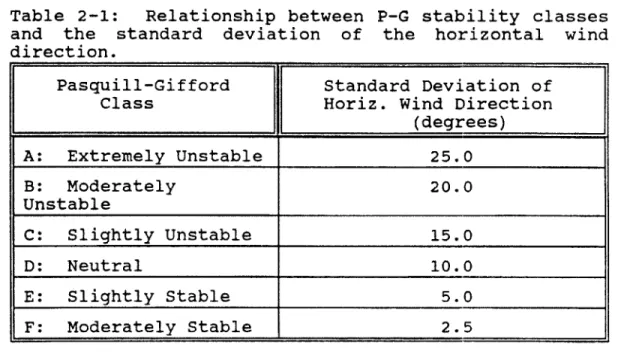
Gifford has graphically expressed the variation in the
diffusion parameters versus distance from the source for all
six Pasquill-Gif ford stabilities, which are described in Table 1. 4 Gifford's empirical graphical relationship between
diffusion parameters and distance for all six stability
categories will be utilized extensively (after appropriate extrapolation) for calculating plume concentrations based upon
Gaussian-based turbulent diffusion.
Table 2-1: Relationship between P-G stability classes
and the standard deviation of the horizontal wind direction.
Pasquill-Gifford Standard Deviation of
Class Horiz. Wind Direction
(degrees) A: Extremely Unstable 25.0 B: Moderately 20.0 Unstable C: Slightly Unstable 15.0 D: Neutral 10.0 E: Slightly Stable 5.0 F: Moderately Stable 2.5
A significant note is that the Gaussian plume model is a time-averaged model; the instantaneous plume spread may yield
43Randerson, D. Atmospheric Science and Power Production. pp. 591-593.
"Randerson, D. Atmospheric Science and Power Production. p. 591.
a concentration distribution which is "patchy, meandering or
otherwise non-Gaussian. "45
2.3.5 Reduction of Source, Q(t) by Radioactive Decay
& Dilution
The Gaussian plume dispersion formula (equation (21))
above is based upon a fixed rate of effluent emission to the
atmosphere. If the rate of effluent emission, Q, is not
constant, then the Gaussian dispersion formula may be modified by simple addition of an extra term for time dependence. In
the case of the Alcator C-Mod experiment, the time dependence
is an exponential decrease based upon both radioactive decay
and dilution of the source, such that:
Q
=Q
0 e (-kt) (22)which modifies the Gaussian plume formula to the following
statistical average :
-kt
1Y
0)
2(zh
22(2 2 2 (23)
x(x,y,zt)
=e1
27aya zU
where t is the time measured after the pulsed production of an amount of effluent within the Alcator C-Mod's
experimental cell.
Radioactive decay is expressed via the term exp[-(I)t],
whereas dilution is expressed via exp[-(F/V)t] for a large
45Randerson, D. Atmospheric Science and Power Production. p. 590.
building with an open interior, fixed internal volume, and
fixed yet equal air supply and exhaust (containing effluent)
rates. The decay factors exp[-(A)t] and exp[-(F/V)tj may be
combined into a single correction factor exp[-kt] which was substituted into equation (23). The constant k is given by:46
k = F + 1 (24)
V
where k is the effective decay constant, I is the decay
constant for a single effluent in question, V is the
internal volume of the Alcator experimental cell, F is the stack exhaust rate
Direct substitution of Q(t) into the Gaussian plume dispersion expression still yields a statistical-mean picture of the airborne concentration; however, the mean is with reference to
the spatial fluctuation of the effluent concentration.
Temporal and spatial portions of the solution are separable.
2.3.6 Effects of the Pulsed Nature of Effluent Production
Suppose production of effluent within the Alcator C-Mod
experimental cell can be considered instantaneous. To
expound, at some instant the uniform airborne effluent within
the cell could be zero, and at some very small amount of time
(relative to the "cycling" time necessary to remove the full
volume of air from within the cell) later a uniform effluent
46Lamarsh, J.R. Introduction to NUCLEAR ENGINEERING. p. 578-579.
concentration (greater than zero) could be detected within the cell. This type of effluent manufacture is termed pulse
production: Effects are given by example below.
The Alcator C-Mod experiment, which is to produce fusion
pulses with an approximate maximum duration of 1.0 seconds47,
will be modeled well by an assumed instantaneous effluent
production. The experimental cell's air cycling time is
approximately 3600 seconds. This amount of cycling time was
a design parameter; moreover, with a fixed cell internal
volume (approx. 2.54 * 103 M3) the cycling time was set by the
choice of the cell's exhaust flow rate (0.71 m3) 48. Since the time necessary for effluent production is fully three orders
of magnitude less than the cell cycling time, the assumption
of instantaneous effluent production is justifiable.
Alcator C-Mod's mode of experimental operation should
provide 3750 pulses per year (25 pulses per day, 5 days per
week, 30 weeks per year) .4 This breakdown assumes
approximately twenty minutes between successive pulses on an
operating day. Due to energy limitations, the time between
pulses should never be less than 15 minutes; therefore, all
concentration buildup calculations which follow are based upon a 15-minute spacing between pulses ("shots") . Thus an exceptionally efficient operational day could produce 32
47Fiore, C.L.
Alcator C-Mod Final Safety Analysis. p.27.
48
Fiore, C.L. Alcator C-Mod Final Safety Analysis p.49.
49Fiore, C.L.
shots.
The half-life of 4 1Ar is 1.83 hours50 , and therefore the
radiological decay constant, 1, is equal to 1.05 * 10-4/sec.
Since the concentration within the experimental cell can be
reduced by both radiological decay and dilution, the cell's
effective decay constant for 41Ar, kArl is 3.84 * 10-4/sec. For
the first successful pulse of the experiment, the initial argon effluent concentration created within the cell will
decay by a factor of exp[-kArt] (where t = 15 mins) before the
first successive shot.
This analysis can be generalized such that for the nth shot, the accumulated effluent concentration due to the
previous (n-1) shots (assuming the accumulated concentration
of the effluent within the cell is small in comparison to the
concentration of the air itself; e.g.: the production of effluent by successive shots is not affected by previously
created effluent) will be:
1= (n-1)
x = [ (e- 0k) X0 (25)
1=1
where x is the accumulated concentration prior to the n th pulse,
x
0 is the maximum anticipated concentration of asingle effluent following a single pulse, k is the effective decay constant of the single effluent in question, and 1 is the index of pulses.
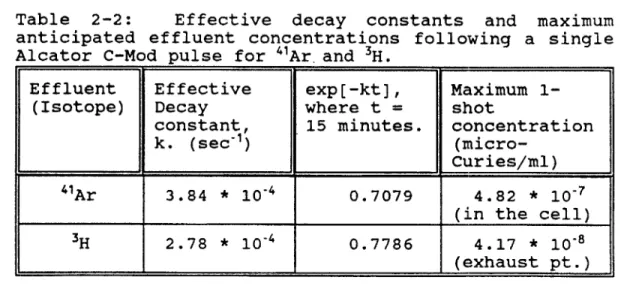
Since the two effluents to be presented within this
5 0
Walker, W.G. Chart of the Nuclides.
document are 4 1Ar and 3H, applicable parameters for these
effluents are tabulated below in table 2-2:51
Table 2-2: Effective decay constants and maximum
anticipated effluent concentrations following a single Alcator C-Mod pulse for 4"Ar. and 3H.
Effluent Effective exp[-kt], Maximum
1-(Isotope) Decay where t = shot
constant, 15 minutes. concentration
k. (sec-)
(micro-I Curies/ml)
4"Ar 3.84 * 10-4 0.7079 4.82 * 10-7
(in the cell) 3H 2.78 * 10-4 0.7786 4.17 * 10-8
(exhaust pt.)
To include the effluent due to the nth shot, simply extend the
above summation to include the case when the index 1 is equal
to zero. Therefore, the concentration immediately following
the nth shot of the day will be:
1= (n-1)
x = [ (e t)) 1y]
1=0
(26)
Application of this analysis to 4'Ar yields:
1 - (n-1)
X
= [ (0 .7079) ' (4.82 * 10~7)1- 0
(27)
immediately following a shot, whereas for 3H the analysis
yields:
5 1Fiore, C.L.
1=n-1
x = E [(0.7786) (4.17*10~)] (28)
1=0
By the ratio test the above summations can be shown to converge. The critical ratios for equations (27) and (28) are
given by equations (29) and (30) respectively:
(.7079) (n+i)
re=
limefl..,)
=0.7079
(29)(.7079)n
rH_3 lim(n-) (.7786) (n+ 1) = 0.7786 (30)
(. 7 7 8 6 )n
Since r<1 for both effluents as shown above, both series
represented in equations (27) and (28) converge.
For 4Ar concentrations, which decay slowly as (0.7079)L,
the series can be approximated very well by the first twenty
terms. For 3H concentrations, which also decay slowly, the
series can be approximated by the first 25 terms:
1= (n-1) 1=19 limn--) E (0.7079) 1 E (0.7079) 1 = 3.4218 (31) 1-0 1=0 1= (n-1) I =24 limn--) (0.7786) 1 ~ (0.7786) 1 = 4.510 (32) 1-0 1-0
These calculations deliver maximum buildup concentrations
for 41Ar and 3H as expressed (when combined with the data in
Table 2-3: Maximum buildup effluent concentrations
within Alcator C-Mod for "Ar and 3H, assuming 15 minutes
between pulses of effluent production.
Effluent Maximum Buildup Concentration
(microcuries
per millileter)41AR (4.82 * 10~7)(3.4218) = 1.65 * 10-6
3H (4.17 * 10-8) (4.5100) = 1.88 * 10'
2.3.7 Effective Stack Height -- A Safety Factor
The quasi-vertical and quasi-horizontal stages of plume
formation already discussed suggest that for any plume emitted vertically from a stack, some vertical displacement of the
plume will occur prior to the bending over of the plume into
the quasi-horizontal stage. The amount of plume rise, which
represents the distance of the plume's horizontal centerline
above the emission point (stack top), leads to a reduction in
the plume concentration at ground level52 and also at points
with lower elevation than the stack height.
Plume rise is a very difficult parameter to estimate
because it depends on a vast array of factors which include,
but are not limited to, the following: plume density; plume
radius; plume velocity; atmospheric stability; shear forces
between plume and atmosphere; specific heat of plume; plume
buoyancy; plume profile (shape) etc.
The Alcator C-Mod exhaust stack has a cross-sectional
52Lamarsh, J.R.
Introduction to Nuclear Engineering. p.
area of approximately 0.217 m
2yet delivers 0.71 m
3/sec air
flow.53 Based upon these design parameters, the mean stack
velocity is 3.27 m/sec. Relying upon a jet model for plume
rise in a cross-wind
54, and assuming a 5 m/s
55, cross-wind in
the exact direction of the horizontally closest accessible
point (to be known as point C2)
to the stack (18 feet in a
horizontal direction from the stack) , a conservative estimate
of the plume rise is 0.47 meters.
For calm conditions (no
cross-wind) the developing plume rise will generally be
greater than 0.47 meters prior to the plume passing over the
same close access point (C2) .56
The two closest accessible points to the stack will be
introduced as points C1 and C2.
57The plume rise at point C1
will be greater than at C2, since C1 is horizontally further
from the stack than C2.
2.4
Dose Estimates:
Assimilation of Dosimetry, Dispersion
Theory and Pulse Effects.
Estimation of biological effects (dose equivalent) being
53
Fiore, C.L.
Alcator C-Mod Final Safety Analysis.
p.49.
54Randerson, D. Atmospheric Science and Power Production.
pp. 338-339.
55Randerson,
D.
Atmospheric Science and Power Production.
p. 339.
5 6
Randerson, D.
Atmospheric Science and Power Production.
57
McLoughlin, J.C. Alcator C-Mod Argon-41 Dosimetry Safety
Report. Cambridge: MIT Plasma Fusion Center.
the primary purpose, the dosimetry, dispersion theory and pulse nature materials must be combined to produce an overall understanding of the movement and effects of the Alcator C-Mod
effluent.
In order to stress the overwhelming conservative nature
of the upcoming biological effect estimates, the following is
a description of the extreme conditions upon which the
estimates are based. Plume rise is assumed to be completely
null. Wind is assumed to cause a bulk flow movement of the
effluent in the exact direction of the closest horizontal accessible point (C2), without any bulk flow component of
dispersion. Buildup due to pulse operation is based on
fifteen minute intervals between shots. The only dispersion
which is assumed results from turbulent diffusion caused by
atmospheric eddies; moreover, this diffusion is underestimated by assuming the most stable atmospheric conditions as defined by Pasquill and Gifford. Another factor which accounts for
the underestimation of turbulent diffusion is the assumption
that the average wind speed is equal to the minimum monthly
wind speed in each of two directions; each direction
corresponds to one of the two closest points (Cl and C2).
For points Cl and C2 the maximum effluent concentrations
were calculated via the turbulent diffusion model just
described. The dose rate at each point was estimated by
58M.I.T. Department of Nuclear Engineering.
Safety
Analysis Report for the MIT Research Reactor (MITR-II) .
Cambridge: M.I.T., 1970.