HAL Id: halshs-01518148
https://halshs.archives-ouvertes.fr/halshs-01518148
Preprint submitted on 4 May 2017
HAL is a multi-disciplinary open access archive for the deposit and dissemination of sci-entific research documents, whether they are pub-lished or not. The documents may come from teaching and research institutions in France or abroad, or from public or private research centers.
L’archive ouverte pluridisciplinaire HAL, est destinée au dépôt et à la diffusion de documents scientifiques de niveau recherche, publiés ou non, émanant des établissements d’enseignement et de recherche français ou étrangers, des laboratoires publics ou privés.
The Geography of NGO Activism against Multinational
Corporations
Sophie Hatte, Pamina Koenig
To cite this version:
Sophie Hatte, Pamina Koenig. The Geography of NGO Activism against Multinational Corporations. 2017. �halshs-01518148�
WORKING PAPER N° 2017 – 17
The Geography of NGO Activism against
Multinational Corporations
Sophie Hatte
Pamina Koenig
JEL Codes: F23, F61, L31
Keywords: NGOs campaigns, multinational firms, gravity equation,
microeconomy of globalization
P
ARIS-
JOURDANS
CIENCESE
CONOMIQUES48, BD JOURDAN – E.N.S. – 75014 PARIS
TÉL. : 33(0) 1 43 13 63 00 – FAX : 33 (0) 1 43 13 63 10
www.pse.ens.fr
CENTRE NATIONAL DE LA RECHERCHE SCIENTIFIQUE – ECOLE DES HAUTES ETUDES EN SCIENCES SOCIALES
ÉCOLE DES PONTS PARISTECH – ECOLE NORMALE SUPÉRIEURE
The Geography of NGO Activism against
Multinational Corporations
∗Sophie Hatte† Pamina Koenig‡
May 2, 2017
Abstract
Non-governmental organizations (NGOs) regularly denounce the behavior of multina-tional corporations throughout the world, however their motivations for choosing the targets of their campaigns remain largely unknown. Using a new and rich dataset listing activists’ campaigns towards multinational firms, we reveal important regularities in the geography and internationalization of advocacy NGOs activity. For example, 49% of US NGOs select a foreign target firm, however, 75% of campaigns targeting foreign firms involve an action taking place in the country of the NGO. We build on these facts to analyze the country-level determinants of NGOs campaigns, and estimate a triadic gravity equation for campaigns, involving the NGO, firm and action countries. Our variables of interest are the bilateral links between the country pairs, measuring how well the audience of the NGO identifies to the target of the campaign. Our results reveal a campaigning bias towards home firms and firms originating from familiar countries.
JEL Codes: F23, F61, L31
Keywords: NGOs campaigns, multinational firms, gravity equation, microeconomy of global-ization
1
Introduction
Worldwide sales and production of multinational corporations are closely followed by non-governmental organizations (NGOs), which regularly report misconducts and damages to health or the environment that are caused by the firms’ behavior. While the role of advocacy NGOs
∗
We are very grateful to Robert Blood for preparing and giving us access to the Sigwatch database. We thank participants of the Paris School of Economics NGO seminar, and we acknowledge support from the ANR-10-LABX-93-01 grant for organizing the seminar.
†
University of Lausanne, Quartier UNIL-Dorigny, Batiment Internef 501, 1015 Lausanne. so-phie.hatte@gmail.com
‡
University of Rouen & Paris School of Economics, 48 boulevard Jourdan 75014 Paris. pam-ina.koenig@psemail.eu
is now associated to important policy challenges1, there is little academic work analyzing the behavior of these agents whose activity nevertheless evolves in parallel and close connexion to the production and sales decisions of firms.
The main reason behind this contrast lies in the lack of systematic, large-scale data doc-umenting the identity, characteristics and actions of advocacy NGOs. Given the absence of quantitative information on campaigns against corporations, investigations on targets of cam-paigns or on the impact of activism on firms’ sales and activity use either indirect camcam-paigns reporting through newspapers articles (Lenox and Eesley (2009)), or rely on small samples as in the case studies by O’Rourke (2005), Spar and La Mure, 2003, and Hendry (2006)2. Harrison and Scorse (2010) focus on one sector, the garment and textile industry in Indonesia, and use differences in the evolution of wages compared to other sectors to identify the effect of cam-paigns targeting subcontractors of Nike, Reebook and Adidas on local wages3. Two papers use quantitative information on NGO campaigns: Couttenier and Hatte (2016) and Couttenier et al. (2016) study NGOs’ communication strategies on a dataset that records campaigns towards the very large firms only.
In this paper we have for the first time the opportunity to provide orders of magnitude on how advocacy NGOs operate their campaigns directed at international production and trade. We use unique and comprehensive data on NGOs’ campaigns towards multinational corpora-tions to study the determinants that drive target choices by activists. Sigwatch4, a European consultancy, provides international corporations with daily processed information on how NGOs perceive them, including the names and number of NGOs following their issue. The raw col-lected data runs from 2010 to 2015, and tracks activist campaigns targeting firms throughout the world. For each of the 3359 NGOs located in 103 different countries mentioned in the database, we know the date of each campaign, the issues at stake, the name and headquarter country of the targeted firm and its parent. 7170 firms headquartered in 139 countries are the object of at least one campaign on the period. No selection is made on the firms that are the object of the campaigns: all firms which have been cited at least once by one or more NGOs are in the data. Campaigns target firms with reference to their behavior: this is the ‘cause of the campaign’, either the production process of a good, the sales of a product, or a general critique linked to the firm’s labor or environmental policy. Blames towards firms can be identified in the data through keywords linked to the content of the campaigns, and through a variable detailing 1On February 22, 2017, France adopted a law requiring multinational firms subcontracting part of their production to prevent overall risks relative to human rights and the environment.
2O’Rourke (2005) focuses on the market campaigns on Staples in 2000, Dell in 2001 and Nike in 1997. 3
In a related paper focusing on the environment, Binder and Neumayer (2005) investigates the impact of pressure groups on pollution levels in a large number of countries. They measure the pressure of advocacy by the number of environmental NGOs per capita.
4Covalence EthicalQuote is the other existing database listing NGOs’ campaigns regarding multinational firms, and available to researchers: see for example Couttenier and Hatte (2016). However contrary to the Sigwatch database, it concentrates on the largest firms.
the country in which the harmful action is reported to have taken place. We name this third country the action country. While we do observe the individual choices of NGOs, we however lack information on the individual characteristics of these NGOs and firms. In order to analyze activists’ campaigns and their determinants, we thus aggregate the data at the country level. At the country-level, three different locations summarize a given campaign: the respective countries of the NGO and the firm, and the action country5. This triadic configuration is at the center of our empirical analysis: we investigate the role of bilateral links between country pairs in shaping the geography of campaigns.
Our contributions in this paper are twofold. We first exploit the campaign data to reveal important regularities in the distribution of NGOs’ campaigns inside and across countries, and in the choice of targets for these campaigns. Since advocacy NGOs focus a large part of their activity on the behavior of multinational firms, our empirical analysis of NGOs’ motivations naturally tends to compare observed patterns of campaigns with existing work on firms’ activity on international markets. These regularities can be summarized around seven main facts:
1. The distribution of NGO campaigns is positively skewed. A small number of NGO pub-lishes a large number of campaigns each year.
2. “Granularity” exists for NGOs as for firms: the largest French NGO represents 25% of French campaigns published in 2010-2015. This number is 6% for the US, 11% for Germany and 21% for Mexico. In comparison, the largest exporter accounts on average for 14% of total exports.
3. Internationalization is more intense for NGOs than for firms. 49% of US NGOs target abroad. In comparison, 18% of US firms export.
4. 75% of campaigns targeting foreign firms involve an action taking place in the country of the NGO.
5. NGOs tend to target large brands whose visibility towards consumers is maximized. 10% of world brands are in the food and beverage sector, which attracts 9% of campaigns. Less than 0.1% of brands relate to recycling activities, which are targeted in 0.24% of the campaigns.
6. The distribution of campaigns across countries is skewed: 4 countries account for 60% of world campaigns.
7. On average, 35% of a country’s activists campaigns are directed at domestic firms. 5
Campaigns are entered in the database as they appear on NGOs’ websites. The number of NGOs and targeted firms per report may vary: some campaigns contain a single NGO denouncing one firm, others involve several NGOs criticizing several firms in a bundle: Henkel (Germany), Neste Oil (Finish producer of biodiesel), Nestle (Switzerland) and Unilever (UK), were for example accused in September 2015 by Rainforest Rescue (a german NGO) to produce unhealthy levels of particules by burning rainforests.
Second, we build on these regularities to investigate the targeting choices of activists. Indeed, in a world in which NGOs’ focus is driven by the magnitude of the expected change on their cause, one could expect them to select targets according to the intensity of the damage done by the firms. Facts 3 and 4 however point to a different scenario, in which geography plays a role in the choice of target. Fact 3 highlights that NGOs’ internationalization is quite important, with almost half of the targets being foreign. However Fact 4 details that in the case of foreign targets, most of the time the underlying action is domestic. We thus investigate whether NGOs’ targeting behavior is biased towards home-related firms. Our assumption is that campaigns may be shaped in order to provide consumers with information they care about or they identify to. To estimate the home- and proximity-bias of campaigns, we hypothesize that NGOs max-imize a utility function associated with each campaign, choosing to go against the firm repre-senting the highest expected utility. This is in line with the Industrial Organization literature modeling the interaction between advocacy activists and firms in the context of a campaign (Baron (2001), Baron and Diermeier (2007)). We argue specifically that the observable part of the success of a campaign depends on how well the local audience of the NGO knows the firm and the action countries. At the country-level, we highlight the similarity of our expression for the number of campaigns with a gravity equation used to investigate the determinants of trade flows. Our principal variables of interest are the bilateral links between the country pairs, measuring the target’s capacity to attract the attention of the donors on the disregarding firm or to identify to the damaged country. We estimate the effect of proximity applying the best practices of the literature to our gravity equation of the number of campaigns.
For comparison with usual gravity estimations on trade we first estimate a dyadic gravity equation of campaigns, i.e. we investigate the determinants of the number of campaigns between NGO countries and firm countries. Typical explanatory variables conform to traditional gravity results, and bilateral proximity variables between the two countries shows a positive and signif-icant effect on the number of campaigns. We then estimate a triadic gravity equation, making use of the information regarding the action country: three different locations thus summarize a triadic campaign: the respective countries of the NGO and the firm, and the action country. Triadic data allows to identify independently the importance of bilateral proximity to each of the two elements of the campaign: the location of the firm and the location of the problem. Controlling for characteristics of the action country allows to estimate the independent effect of proximity to the firm country as a determinant of campaign, illustrated for instance by two NGOs from different home countries targeting firms acting unethically in the same action coun-try. Our results confirm the prevalence of an important preference for home firms, and beyond, a preference for firms originating from proximate and familiar countries. The -0.2 distance elas-ticity of the number of campaigns illustrates that a 10% higher distance to a target country decreases the number of campaigns involving that country’s firms by 2%.
Economics of NGOs. We contribute to the trade literature by showing that flows of campaigns, closely linked to multinational corporation’s activity, can also be explained by gravity deter-minants (Arkolakis et al. (2013)). We measure proximity with the two pieces of information regarding the object of the campaign: we know in which country the target firm is headquar-tered and in which country the damage was done. The paper also contributes to the emerging empirical literature on the economics of NGOs. The availability of detailed campaign data opens for a better knowledge of the motivations and effects of NGOs next to multinational firm in international production. Although NGOs are quite active in following and influencing practices linked to international production, the international trade literature only recently modeled their presence next to trading firms (Krautheim and Verdier (2016)).
The paper is structured as follows. In section 2 we document the distribution of NGO campaigns inside countries and across sectors. Section 3 illustrates country-level patterns of campaigning. We develop the theoretical payoff associated to a campaign in section 4, and provide the estimable equation. Section 5 contains our results regarding the bilateral gravity equation, and section 6 comments the results on the triadic regressions.
2
Who are the activists ?
Reported campaigns are predominantly negative towards the target firm. Five categories dis-tinguish the tone of the NGOs’ reports, from -2 to +2. 80% of the campaigns are negative (either -1 or -2), around 12% are positive and 7% are neutral. In the following we use only the negative reports, and leave aside the neutral and positive news on firms, as it is highly probable that the determinants of both types of campaigns are quite different. We first introduce the data situation on NGOs, and compare it to the existing datasets on firms. We present the main stylized facts on activists’ output (campaigns), extracted from the new micro-level data. Then we highlight the main sectoral patterns of the data.
2.1 NGO campaigns data
Since advocacy NGOs focus a large part of their activity on the behavior of multinational firms, our empirical analysis of NGOs’ motivations naturally tends to compare observed patterns of campaigns with existing work on firms’ activity on international markets. The literature documenting firm behavior is familiar with firm-level export data since the beginning of the years 2000, while micro census data sets on firm attributes were exploited a few decades before. A large literature has emerged documenting the characteristics of exporters (beginning with Bernard et al. (1995), for the US). As these data progressively became available with a similar structure in developed and developing countries, the comparison was made easier: Mayer and Ottaviano (2008) provide a detailed overview of firm-level export patterns in eight European countries. Research questions in international trade have evolved alongside the availability of
more detailed data, and its focus has shifted from industries and countries, to firms and exported products (Bernard et al. (2012)).
Conversely, regarding NGOs, the available data is sparse and empirical research consequently mostly based on case studies. In most countries census data on activists do not exist per se, and when it does, it relates to the wider category of non-profit organizations, which are a heterogeneous group of agents with very differing objective functions6. At the international level, an example of initiative to collect exhaustive data comes from the Union of International Associations, itself an international non-profit organization based in Brussels, selling access to the Yearbook of International Organizations. In all cases, the inherent difficulty of these datasets lies in the immensly wide set of fields covered and in the need to sort the organizations according to their activity or declared sector.
A first reason why no data records the volume and set of activities of NGOs, is because the range of actions they pursue is very wide: supporting a cause and providing know-how can be achieved through organizing protests, publishing campaigns against firms and governments, delivering goods and services, lobbying for a new regulation... among others. While the pro-duction of goods or services provides a unifying criteria to take stock of firms’ output, there is no such category for activists. A second reason for not having available data evaluating the production of activists relates to the absence of mandatory reporting of their activity to tax authorities. In the case of firms, the general tax on production and the mandatory export and import Customs declarations in most countries represent an efficient way to collect firm-level data.
In this context, the NGO campaign data offers a unique opportunity to study the activity of these organizations supervising micro-level production and consumptions patterns interna-tionaly. Since we lack internationally comparable census data on activists, the number of active NGOs campaigning against multinationals in each country provides a first proxy of the set of agents. Figure 1 lists the number of NGOs in each country which are in the database, i.e. which have published at least one campaign over the period 2010-2015. France for example exhibits 103 international trade activists, which seems tiny compared to the 1.3 million active associa-tions reported in the 2014 Association Enquiry by the National Statistical Institute (Reynaert and d’Isanto (2016)), but which on the other side seems closer to the number of associations declared by French specialized webplatforms: Wikipedia references 83 international solidarity organizations7 which have a French wikipedia page, and Coordination Sud, a French organism which helps international development NGOs to coordinate their actions, lists 169 members.
A straightforward question in economics, and specifically regarding firms in international 6
In France for example, the National Statistical Institute INSEE launched the first enquiry on associations in 2014. Alternatively, NGOs figure in two categories (‘Associations’ or ’Foundations’) of the official directory of companies, however contrary to firms, their registration is not mandatory.
7
Association de Solidarit internationale is an expression that has been recently used and popularised to refer to the smaller category of NGOs whose activity relates to international solidarity actions.
Figure 1: Number of campaigning NGOs per country 28 28 29 29 29 30 34 3435 41 4243 5459 66 6873 73 7586 9297 103130 196 291 962 0 200 400 600 800 1,000 Number of active NGOs (if >27) 2010-2015
JPN POL DNK NGA UKRFIN IND NOR ROMBEL RUS SWE CHEITA ARGBRA NLD PER AUS MEXESP CHL FRA DEU CAN GBRUSA 7 7 78 8 89 9 910 1011 11 1112 12 1213 13 15 15 17 1819 20 23 23 25 27 27 0 10 20 30
Number of active NGOs (if >6 and <28) 2010-2015
DOMIRL KHM MMRNIC TUR KORPAN SLV THA URYBOL CRI HND GRCPRT TWNHKG MYSAUT BGRNZL PRY GTM CHNCOL ECUZAF IDN PHL
trade, relates to the shape of the distribution of performance variables. In our case, NGOs’ campaigning activity represents the main output of interest. Let us introduce a set of stylized facts illustrating key features on the production of campaigns.
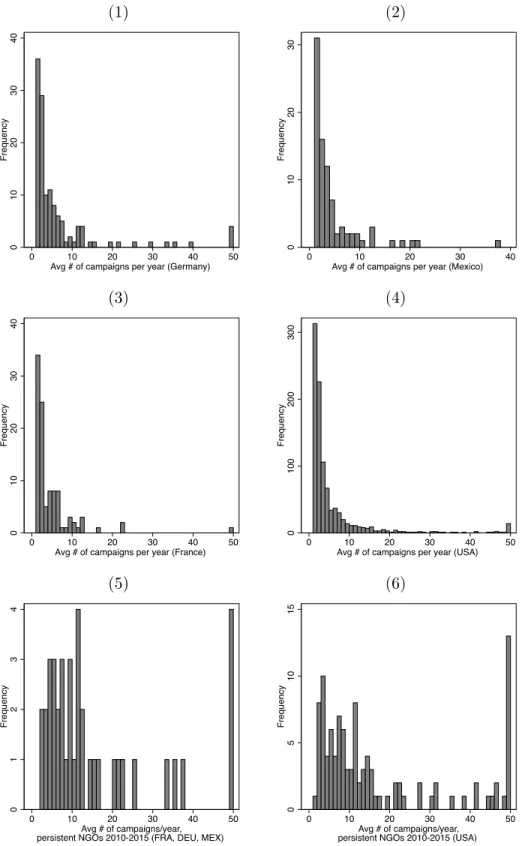
• Fact 1: The distribution of NGO campaigns is positively skewed. A small number of NGOs publishes a large number of campaigns per year.
We compute the number of campaigns by NGO in a given year, in Figure 2, and show that the production of campaigns is far from being uniform among NGOs for France, the USA, Germany and Mexico (other countries show the same patterns but have lower number of NGOs). The skewness parameter is 8 for the US and 3.6 for Germany, the average number of campaigns being here 2.5 times higher than the median. The majority of activists have published one campaign a year. This phenomenon might be imputable to the high entry and exit rate. We check whether our NGOs campaign in all six years in the data, and illustrate in table 7 that this is the case only for 11% of the activists. On the other extreme, 59% of the campaigners appear only during one sample year. We thus remove the activists that are present only part of the six years and recalculate the average number of campaigns for the 11% of organizations which figure in the data during five or six years. The result is shown in the two lower panels of Figure 2. In panel 5, three countries are pooled together and represent 147 NGOs (107 for USA, 20 for Germany, 13 for France and 7 for Mexico). In box 6 are shown only the North-American activists. A skewness of the distribution equal to 3 still appears when using the sample of
persistent NGOs. A majority of NGOs campaign between 1 and 10 times a year, and a small number publishes above 50 campaigns a year.
What does the skewness of the distribution of NGOs’ output teach us ? Presumably, the distribution of the number of campaigns reflects the underlying distribution of “how good” the NGOs are. We can draw here on the literature documenting heterogeneous firms’ performance in export markets. Several papers have shown that the distribution of productivity can be in-fered from the distribution of sales. Helpman et al. (2008) and Chaney (2008) combine CES preferences with Pareto-distributed productivity and show that it yields a distribution of out-put that is also Pareto-distributed. Head et al. (2014) obtain the same result with a log-normal productivity, and Mrazova et al. (2015) characterize the general conditions such that the distri-bution of output mirrors the one of the underlying performance variable. For our purposes, we retain from these papers that the skewness of output probably reflects similar skewness of the background NGOs’ “productivity”, and present in the next stylized fact a different perspective on the non-uniformity of the distribution of campaigns.
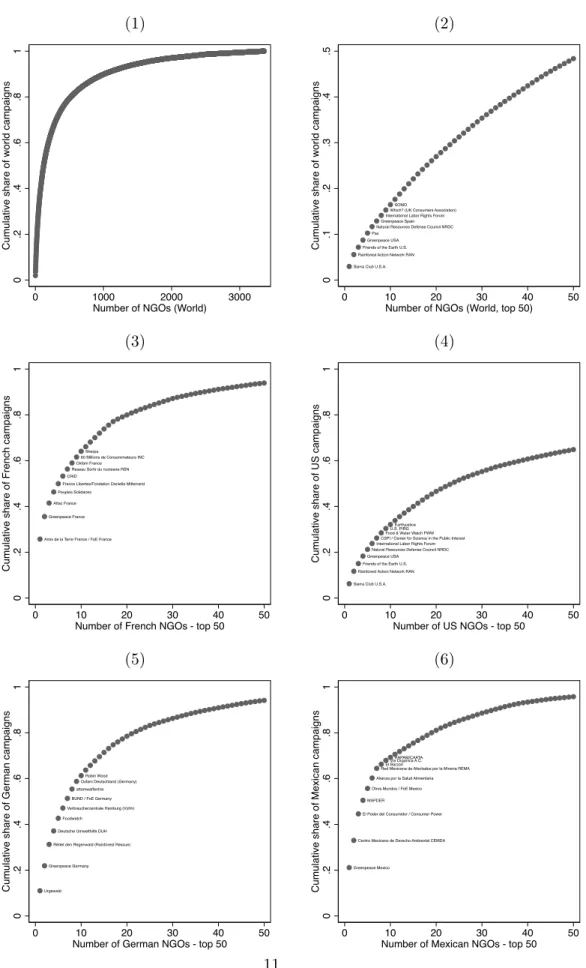
• Fact 2: “Granularity” exists for NGOs as for firms: the largest French NGO represents 25% of French campaigns published in 2010-2015. This number is 6% for the US, 11% for Germany and 21% for Mexico. In comparison, the largest exporter accounts on average for 14% of total exports.
The bias of activists’ output is further investigated in Figure 3 for the same four countries and for the world as a whole (two upper panels). The dotted curves plot the actual distribution of campaigns in each location, starting with the largest producer of campaigns. NGOs are ranked from left to right from the biggest to the smallest in terms of campaigns, on the horizontal axis. The vertical axis measures the cumulative contribution to the total number of campaigns. Among all world activists, we can compare the share of the first reporting NGO (1.9%) to its counterfactual share in the scenario where all the 3359 activists that appear at least once in 2010-2015 would report equally, hence 1/3359. The actual share of the first reporter is 65 times higher than the one of a uniform distribution. In a less extreme comparison, we compute a counterfactual in which the first NGO would publish a share of aggregate campaigns equal to 1/362 (the number of NGOs that remain during 5 or 6 years), hence 0.27%, whereas it actually publishes 2.9% of the campaigns, hence 7 times more.
Again at this point, the comparison with firm-level facts is interesting to make. Multiple papers have analyzed the shape of the distribution of firms’ output, employment or exports. Part of the litterature concludes at a log-normal distribution (Head et al. (2014)), others emphasize the Pareto characteristics of output distribution (Di Giovanni et al. (2011)). All agree on the existence of a skewed shape of the main performance variables. Mayer and Ottaviano (2008) show that the cumulative distribution of exports exhibits higher concentration than the one for
employment. Freund and Pierola (2015) find for example that the average percentage of exports attributed to the first exporter across 32 countries accounts on average, across all countries, for 14% of aggregate international sales. Last, another strand of the literature investigates the granular characteristic of aggregate production, i.e. how large firms contribute to an important share of total output, and of its fluctuations (Gabaix (2011), di Giovanni et al. (2017)). The cumulative shares of total campaigns on the pooled data for 2010-2015 show that granularity is a plausible assumption regarding NGOs too.
The graphical representation of distributions that has been often used to discriminate among the distributions is the log-rank-size scatter plot. Measuring firm size in the US, Axtell (2001) for example reports a linear relationship between the two variables and coefficients precisely estimated and close to 1, the former highlighting a power law distribution and the latter the specific Zipf law. We graph this relation for US NGOs’ campaigns and show the result in Figure 4. We keep one observation per activist, which is its total of reports published throughout the sample period. Producers of campaigns are ranked according to their number of publications, and we plot the log of their rank on the log of their output. Two regression lines are shown, one for the whole sample of US activists and one for the observations below rank 50 (on the right of the box). The steeper one corresponds to an estimated coefficient of -1.1 (0.039) and the one for the whole sample yields a coefficient equal to -0.63 (0.004) with respective R2 of 0.96 and 0.94. While characterizing the exact distribution of activists’ output would require further investigations, still the figure does not eliminate a power law as a potential distribution of campaigns.
• Fact 3: Internationalization is more intense for NGOs than for firms. 49% of US NGOs target abroad. In comparison, 18% of US firms export.
A last and central stylized fact introduces our main question regarding the motivations of NGOs’ behavior: what drives the choice of target for the campaigns ? Why do some campaigns target a domestic firm, and others involve firms headquartered abroad ? In section 4 of the paper we propose an activist’s objective function in which campaigns are designed to be successful for the audience of the NGO, which is local: a campaign is expected to generate donations from domestic supporters of the cause. We model a successful campaign as one that addresses issues that are familiar to the audience, and thus relates to firm operations that share elements of proximity with the audience’s concerns. How to identify proximity with the audience ? Our campaign data is triadic and provides information about the NGO, firm, and action countries. We measure links between the NGO and respectively the firm, or the action country, and expect to find that campaigns chooses the NGO home country, or a closeby neighbor, for either the firm or the action. Examples in the data illustrate activists which chase cases in which either the firm or the action is domestic. For a given action country, it is common to have NGOs from different
Figure 2: Distribution of campaigns, NGO-level (1) (2) 0 10 20 30 40 F re q u e n cy 0 10 20 30 40 50
Avg # of campaigns per year (Germany)
0 10 20 30 F re q u e n cy 0 10 20 30 40
Avg # of campaigns per year (Mexico)
(3) (4) 0 10 20 30 40 F re q u e n cy 0 10 20 30 40 50
Avg # of campaigns per year (France)
0 100 200 300 F re q u e n cy 0 10 20 30 40 50
Avg # of campaigns per year (USA)
(5) (6) 0 1 2 3 4 F re q u e n cy 0 10 20 30 40 50 Avg # of campaigns/year, persistent NGOs 2010-2015 (FRA, DEU, MEX)
0 5 10 15 F re q u e n cy 0 10 20 30 40 50 Avg # of campaigns/year, persistent NGOs 2010-2015 (USA)
Figure 3: Cumulative share of campaigns by NGO, 2010-2015 (1) (2) 0 .2 .4 .6 .8 1 C u mu la ti ve sh a re o f w o rl d ca mp a ig n s 0 1000 2000 3000
Number of NGOs (World)
Sierra Club U.S.A. Rainforest Action Network RAN
Friends of the Earth U.S. Greenpeace USA
Pax
Natural Resources Defense Council NRDC Greenpeace Spain
International Labor Rights Forum Which? (UK Consumers Association)
SOMO 0 .1 .2 .3 .4 .5 C u mu la ti ve sh a re o f w o rl d ca mp a ig n s 0 10 20 30 40 50
Number of NGOs (World, top 50)
(3) (4)
Amis de la Terre France / FoE France Greenpeace France
Attac France Peuples Solidaires
France Libertes/Fondation Danielle Mitterrand CRID
Reseau Sortir du nucleaire RSN Oxfam France
60 Millions de Consommateurs INC Sherpa 0 .2 .4 .6 .8 1 C u mu la ti ve sh a re o f F re n ch ca mp a ig n s 0 10 20 30 40 50
Number of French NGOs - top 50
Sierra Club U.S.A. Rainforest Action Network RAN
Friends of the Earth U.S. Greenpeace USA
Natural Resources Defense Council NRDC International Labor Rights Forum
CSPI / Center for Science in the Public Interest Food & Water Watch FWWU.S. PIRG
Earthjustice 0 .2 .4 .6 .8 1 C u mu la ti ve sh a re o f U S ca mp a ig n s 0 10 20 30 40 50
Number of US NGOs - top 50
(5) (6)
Urgewald Greenpeace Germany
Rettet den Regenwald (Rainforest Rescue) Deutsche Umwelthilfe DUH
Foodwatch
Verbraucherzentrale Hamburg (Vzhh) BUND / FoE Germany
attomwaffenfrei Oxfam Deutschland (Germany)
Robin Wood 0 .2 .4 .6 .8 1 C u mu la ti ve sh a re o f G e rma n ca mp a ig n s 0 10 20 30 40 50
Number of German NGOs - top 50
Greenpeace Mexico
Centro Mexicano de Derecho Ambiental CEMDA El Poder del Consumidor / Consumer Power
MAPDER Otros Mundos / FoE Mexico
Alianza por la Salud Alimentaria Red Mexicana de Afectados por la Mineria REMAEl Barzon
Via Organica A.C.RAPAM/CAATA
0 .2 .4 .6 .8 1 C u mu la ti ve sh a re o f Me xi ca n ca mp a ig n s 0 10 20 30 40 50
Figure 4: Log rank and log size of US NGOs’ campaigns 0 1 2 3 4 5 6 7 L o g o f ra n k 0 1 2 3 4 5 6 7
Log of number of campaigns
origins each reporting on a home firm acting abroad: Greenpeace India for instance, reports in 2012 that GVK, a large Indian conglomerate, is pursuying its Alpha Coal investment project in Australia without having clearly stated the risks for the environment. Still in Australia, a German activist, Campact, writes to ask Deutsch Bank not to invest in the “Mega Coal Mining Project” that is threatening the Great Barrier Reef in 2014.
The recent increase in the internationalization of production, documented in a large literature (Grossman et al. (2006), Johnson (2014)), has resulted in the production process of goods often being split in different stages and countries. These globalized value chains have certainly increased the average distance between the location of consumption and the one of production: however activists, while supervising globalized production processes and consumption patterns, may still choose objects for their campaigns that share elements of proximity with their audience. Firms headquartered in foreign countries for example, may be widely known in the NGO’s home country because they employ domestic workers or because they have a large local market share. This mechanism is for instance modeled in Krautheim and Verdier (2016), for whom NGOs select ‘actions related to well-known brands with large market-size’, and ‘consumers can be more easily convinced to donate if the campaign goes against a firm they know well’.
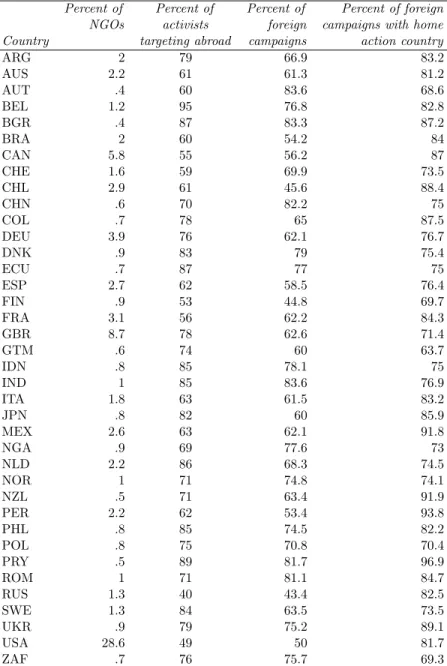
Do stylized facts support the proximity argument ? Column 2 in table 1 shows the percentage of activists in each country, which target foreign firms (in at least one of their campaigns during the sample period 2010-2015). For all countries but the USA and Russia, more than half of NGOs have chosen a foreign target for one of their campaigns. This number is very different from the facts reported on the internationalization of firms: Bernard et al. (2012) present evidence showing that 18 % of US manufacturing firms export. Table 1 shows in comparison that 49% of US NGOs select a foreign target for their campaign. Column 4 zooms into the NGOs which target abroad: these publish 62% of their campaigns on foreign firms, in the case of Germany, France and the United-Kingdom. The highest percentage of campaigns involving
foreign firms can be found for Austria, Bulgaria, India and China (83%), and the lowest for Russia (43) and Finland (44), and 50% for the USA. These numbers depict a relatively intense internationalization of NGOs’ campaigns: targeting abroad does not seem rare.
• Fact 4: 75% of campaigns targeting foreign firms involve a domestic action.
The last column in table 1 suggests that choosing foreign targets does not mean that NGOs choose objects of campaigns that are unknown to their audience. For each campaign focusing on a foreign firm, we use a dummy variable to identify the cases where the country in which the action has taken place is the activist’s (and hence the audience’s) home country. We then compute, for each country, the percentage of denunciations involving foreign firms, which relate to damage done at home. The outcome is strikingly high: in three-quarters of the cases as a minimum, the home country of the audience is the same as the action country, whenever a foreign firm is the object of the campaign. These stylized facts imply that assuming proximity to the audience as the main element of the activist’s objective function may be relevant: it appears as if campaigns needed at least one element of proximity to be successful to the audience. We will estimate the importance of bilateral and multilateral accessibility determinants in the choice of targets in section 5. Before, we turn to different stylized facts, highlighting sectoral patterns of campaigning.
2.2 Sectoral patterns
NGOs gather agents that share intrinsic common values and pursue social objectives: Besley and Ghatak (2005) define non-profits as organizations with a mission, whose success is valued over and above any monetary income. Can we expect a specific pattern across sectors ? Since no systematic data is available on the specialization of NGOs, the literature contains very few descriptions of the object of these missions: O’Rourke (2003) suggests that the absence or lack of enforcement of regulations on labor and environmental resources explains the emergence of activists. On the theoretical side, Baron (2003), Daubanes and Rochet (2016) and Baron and Diermeier (2007) model NGOs’ interactions with firms and depict activists as motivated by social or ethical concerns.
If advocacy NGOs care in particular about preserving labor and natural resources, the typology of campaigns that we observe in the data should logically display high movement in sectors harming those resources: activities exploiting natural resources (extraction of raw materials...), labor-intensive sectors (electronics, clothing, yarn...) and sectors whose final good might hurt consumers’ health or the environment (food, chemical products...). Table 8 in the Appendix illustrates the number of campaigns per sector in our data, together with the number of firms and NGOs8. Information on sectors is provided in the raw data by a variable 8Table 9 contains the same information as Table 8, however ordered according to the sectoral classification.
Table 1: Targeting abroad by NGOs
Percent of Percent of Percent of Percent of foreign NGOs activists foreign campaigns with home Country targeting abroad campaigns action country
ARG 2 79 66.9 83.2 AUS 2.2 61 61.3 81.2 AUT .4 60 83.6 68.6 BEL 1.2 95 76.8 82.8 BGR .4 87 83.3 87.2 BRA 2 60 54.2 84 CAN 5.8 55 56.2 87 CHE 1.6 59 69.9 73.5 CHL 2.9 61 45.6 88.4 CHN .6 70 82.2 75 COL .7 78 65 87.5 DEU 3.9 76 62.1 76.7 DNK .9 83 79 75.4 ECU .7 87 77 75 ESP 2.7 62 58.5 76.4 FIN .9 53 44.8 69.7 FRA 3.1 56 62.2 84.3 GBR 8.7 78 62.6 71.4 GTM .6 74 60 63.7 IDN .8 85 78.1 75 IND 1 85 83.6 76.9 ITA 1.8 63 61.5 83.2 JPN .8 82 60 85.9 MEX 2.6 63 62.1 91.8 NGA .9 69 77.6 73 NLD 2.2 86 68.3 74.5 NOR 1 71 74.8 74.1 NZL .5 71 63.4 91.9 PER 2.2 62 53.4 93.8 PHL .8 85 74.5 82.2 POL .8 75 70.8 70.4 PRY .5 89 81.7 96.9 ROM 1 71 81.1 84.7 RUS 1.3 40 43.4 82.5 SWE 1.3 84 63.5 73.5 UKR .9 79 75.2 89.1 USA 28.6 49 50 81.7 ZAF .7 76 75.7 69.3
Only countries with more than 15 NGOs appear in the table. ‘Percent of NGOs’ corre-sponds to the share of each country in the world total number of active NGOs. ‘Percent of activists targeting abroad’ refers to the share of NGOs which target at least once a foreign firm. ‘Percent of foreign campaigns computes the share of each NGO’s campaigns that targets foreign firms’.
summarizing the main activity of the target firm. We recode these sectors into the 2-digits ISIC rev 3.1 classification. Some operations are necessarily grouped into one category because of the difficulty to allocate multitasking firms in different activities: the energy sector contains the extraction, the processing and the distribution of all energies. As shown in Table 8, a given number of sectors follow the intuition described above: sectors whose production process is intensive in resource utilization are highly targeted: examples include oil, gas, and nuclear energy, whose extraction is accused of harming the environment (“Extraction, manufacturing and distribution of energy”), or “Mining of metal ores”, in which targeted firms are gold mining companies, and metal mining corporations. The same insight seems to be driving sectors whose final good violates health standards, which are also at the center of NGOs’ attention: campaigns in “Manufacturing of food products and beverages” denounce firms whose product is considered harmful for consumers’ health (Coca-Cola, accused of selling sugar-intensive beverages, Nestle blamed for introducing instant formulas to families).
• Fact 5: NGOs tend to target large brands whose visibility towards consumers is maximized. 10% of world brands are in the food and beverage sector, which attracts 9% of campaigns. Less than 0.1% of campaigns relate to recycling activities, which are targeted in 0.24% of the campaigns.
One noticeable feature disrupts the typology of targeted sectors according to their intensity of damage to natural and human resources. Indeed the numbers shown in table 8 do not automatically reflect environmental and social harm by sector, because part of the campaigns are not directed towards firms whose practices activists want changed. Baron and Diermeier (2007) document this characteristic of activists’ behavior, and disentangle direct campaigns, denouncing firms which have done the damage, and indirect campaigns, which target an element of the value-chain of the harmful firm, be it upstream or downstream from the ultimate target. When the unethical behavior originates from a subcontractor of a large multinational, activists tend to target the former: as an example, when in 2013, Rainforest Action Network pressures Heinz (H.J. Heinz Company) to stop sourcing palm oil from its suppliers in Indonesia, the growing of palm oil is the real object of the campaign, however the pressure is set on the multinational outsourcing inputs abroad. In the same line, supermarkets (featured in “Non-specialized retail in stores”) may be the target of activists because of the products they sell (fashion, food, furniture...). These are the real targets from whom NGOs want a change in behavior, which would lower the burden on natural or human resources.
These examples of downstream choice of targets reveal an important pattern regarding the behavior of activists: they suggest that the proximity argument plays a large role in defining the campaign, and that consumers are more receptive to news that relate to something they know. To change the behavior of palm oil growers in Indonesia, NGOs whose audience is in developed
countries pressure their home firms, which subcontract with indonesian farmers. The home firm has more chances to be known by a vast audience and by the media, mainly because its home sales are higher. A former CEO of Greenpeace Belgium corroborates this feature and indeed acknowledges during an invited academic seminar9 that “[the NGO] is always trying to find companies whose brands resonnate to people’s ears and even “hearts”. [The NGO] goes after the well-known customer of a unknown provider to change the latter’s behavior, the subsidiary of a financial corporation or a specific but well known product of a large corporation”.
Besides the identification of the audience with firms they know, selecting notorious firms may also reflect the willingness of activists to choose firms of important size. First, the NGO wishes to select the firms whose change in behavior will have the widest impact. Large firms in absolute use a more important share of local resources, and produce and sell more than small and medium size firms. The harm done by their production process or by their product is thus likely to be more important. Second, in a dynamic setting we could assume that selecting a large firm is optimal as she will implicitely represent a model for the rest of the industry, if it complies with the activist’s request.
The theoretical literature on NGO-firm interaction is relatively scarce, however the existing models all include these mechanisms in modeling optimal campaigns by activists. The utility of a campaign is usually described as containing gains and costs. Both may be modeled as a function of the bilateral proximity between the audience (the donors) and the selected target firm. In Eesley and Lenox (2011), large and more visible firms are more likely to be targeted by activists, because the utility of the activist increases “not only from direct changes in firm behavior, but also from the ability to attract attention to causes of concern and to raise funds”. Krautheim and Verdier (2016) model the emergence of NGOs in parallel to the offshoring decision of firms in an international setting: the optimal target fits the description of the “well-known brand with large market-size”, as it implies a lower marginal fundraising cost for the NGO. Consumers can be more easily convinced to donate when the campaign goes against a firm they know well.
3
Country-level patterns of campaigning
With the gravity estimation in mind, we now aggregate the data at the triadic country level and highlight the main patterns characterizing each node of triadic ijk campaigns: NGOs in source country i, multinationals headquartered in target country j, and damage done in action country k. The resulting non-balanced database contains 6502 observations corresponding to triads of countries (source i, firm j, action k) with positive number of campaigns pooled on 2010-2015.
9
Paris School of Economics holds tri-annual seminars on the Economics of NGOs, gathering academics and NGOs’ professionals. Michel Genet participated in the January 2015 edition.
3.1 Origin countries of campaigns
• Fact 6: The distribution of campaigns across countries is skewed: 4 countries account for 60% of world campaigns.
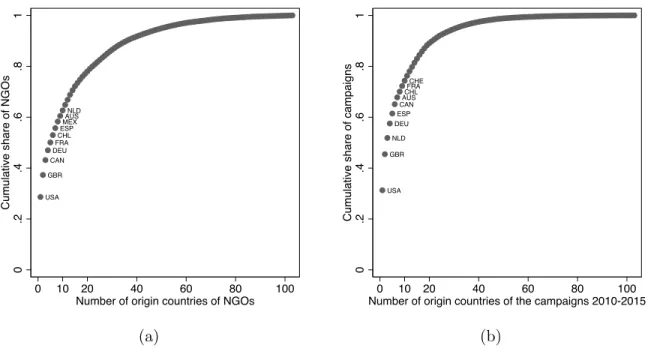
Activist campaigns originate from 103 different countries, whose share in world campaigns is displayed in Figure 5. A glance at the shape of both curves suggests a skewed distribution of campaigns, even more than the distribution of NGOs. In panel (a), 4 countries account for 60% of observations. The USA and the United-Kingdom represent respectively 30.6% and 14% of the total number of communications. The Netherlands follows with 6%, and Germany with 5%, and the cumulative share of world campaigns is not affected by dropping the six international NGOs10.
While the literature widely analyses the interaction of NGOs with firms taking as given the number of activists per country (Aldashev et al. (2015), Baron (2001), Baron and Diermeier (2007)), the stylized facts on the number of NGOs per country in the campaign data (Figure 1) evidently question the determinants of NGO emergence. Demand for campaigns certainly originates from preferences for ethical consumption. The relation between such preferences and income has been suggested in the NGO literature: Loureiro and Lotade (2005) emphasize that concerns for more information on goods’ production process and on their overall impact on the environment, are found in developing countries and are associated with a higher willingness to pay for such products. Krautheim and Verdier (2016) explicitely use ethic and environment-caring consumers in their model, where NGOs emerge in a Home country whose regulations are applicable and enforced, contrary to the Foreign country. These elements suggest that support for advocacy campaigns might be a luxury good, whose consumption increases more than proportionately with individuals’ income: Basu and Van (1998) model such a mechanism in the case of child labor and show that non-work is a luxury good in the household’s consumption. A simple and naive illustration of cross-country variation in demand for activism is given in Figure 6, which plots countries’ income per capita together with the intensity of advocacy campaigning in each country. The demand for activism is proxied respectively by each of the two elements brought forth in the above paragraph: income per capita (column a) and population
10
Note that some NGOs have an international architecture with branches in different countries. Although the campaign data differentiates reports according to the country of the NGO even for international NGOs (i.e. reports by Greenpeace originate from 46 different countries), the headquarter of the group may issue a large number of reports and thus attribute proportionately more campaigns to home countries of international NGOs. Countries whose count might be affected are Netherlands (Greenpeace International and Friends of the Earth International), Great-Britain (Amnesty International and Oxfam International), Germany (Transparency International) and Switzerland (WWF International). The NGOs that represent the largest share of their ‘home’ country’s reports are Greenpeace International, which accounts for 10.5% of Netherlands campaigns for 2010-2015, and WWF International, which represents 14.1% of Switzerland’s reports. The other ones account for a smaller share of their home country’s number of campaigns (Amnesty International 2% o UK’s reports, Oxfam International 1.9%, Transparency International 1.2% and Friends of the Earth International 6%.). Together they account for 1.56% of all campaigns in the database.
Figure 5: Cumulative share of world campaigns and world NGOs USA GBR CAN DEU FRACHL ESPMEX AUSNLD 0 .2 .4 .6 .8 1 C u mu la ti ve sh a re o f N G O s 0 10 20 40 60 80 100
Number of origin countries of NGOs
USA GBR NLD DEU ESP CANAUS CHLFRA CHE 0 .2 .4 .6 .8 1 C u mu la ti ve sh a re o f ca mp a ig n s 0 10 20 40 60 80 100
Number of origin countries of the campaigns 2010-2015
(a) (b)
(column b). The supply of activism is measured either by the number of non-profits campaigning between 2010 and 2015 (upper line), or by the number of campaigns from each source country (bottom line). The figure shows that the emergence of NGOs and their production of campaigns seem to be correlated to individual income more than to the number of individuals in a country. It appears that origin countries of campaigns are mainly rich countries, but not necessarily populated countries. These facts could corroborate a scenario in which NGOs need a certain level of income in order to matter in the “consumption basket” of individuals. Below a given threshold, a larger population does not represent a large market for advocacy campaigns.
A traditional way to tackle the relation between supply and local demand in the trade liter-ature, is to estimate the so-called home-market effect. An interesting parallel can be developed regarding the supply of activism. Whether the supply of a good reacts at all to the size of demand is a central and old question in the trade literature. Krugman (1980) has shown that a large domestic market for a good generates a more than proportional reaction of supply, leading the country to become an exporter of the good. The explanation rests on increasing-returns-to-scale in the industry of the good, which require producers to concentrate production in one location. Given the presence of trade frictions between countries, agglomeration occurs near the largest local demand, giving rise to the home-market effect. Head and Mayer (2004) review the empirical literature, and Costinot et al. (2016) provide recent evidence of a home-market effect in the pharmaceutical industry. An important challenge of estimating home-market effects relates to the measure of demand. In the case of activism, our previous discussion has shown that demand probably contains two separate elements: the income level of the audience, and
Figure 6: Is demand for campaigns increasing with income ? (a) (b) ALB ARG AUS AUT BEL BGD BGR BLR BOL BRA CAN CHE CHL CHN CMR COL CRI CZE DEU DNK DOM DZA ECU EGY ESP ETH FIN FJI FRA GBR GEO GHA GNB GRC GTM HKG HND HRV HTI HUN IDN IND IRL ISL ISR ITA JPN KEN KHM KOR LBR LKA LTU LUX MAR MEX MLT MNG MOZ MYS NER NGA NIC NLD NOR NPL NZL PAK PAN PER PHL PNG POL PRT PRY ROMRUS SEN SGP SLB SLE SLV SVN SWE TGO THA TUR TWN TZA UGA UKR URY USA UZB VEN VNM YEM ZAF ZAR ZMB ZWE coeff: .59 fit: .34 0 1 5 10 50 100 500 1000 N u mb e r o f a ct ive N G O s 500 5000 50000 Average GDP per capita 2010-2015
ALB ARG AUS AUT BEL BGD BGR BLR BOL BRA CAN CHE CHL CHN CMR COL CRI CZE DEU DNK DOM DZA ECU EGY ESP ETH FIN FJI FRA GBR GEO GHA GNB GRC GRL GTM HKG HND HRV HTI HUN IDN IND IRL ISL ISR ITA JPN KEN KHM KOR LBR LKA LTU LUX MAR MEX MLT MMR MNG MOZ MYS NCL NER NGA NIC NLD NOR NPL NZL PAK PAN PER PHL PNG POL PRT PRY ROM RUS SEN SGP SLB SLE SLV SVN SWE TGO THA TUR TWN TZA UGA UKR URY USA UZB VEN VNM YEM ZAF ZAR ZMB ZWE coeff: .378 fit: .162 0 1 2 10 50 100 300 N u mb e r o f a ct ive N G O s 1 10 50 1000 Average population 2010-2015 [mio inhabitants]
ARG AUS AUT BEL BGD BGR BLR BOL BRA CAN CHE CHL CHN CMR COL CRI CZE DEU DNK DOM DZA ECU EGY ESP ETH FIN FJI FRA GBR GEO GHA GRC GTM HKG HND HRV HTI HUN IDN IND IRL ISL ISR ITA JPN KEN KHM KOR LBR LKA LTU LUX MAR MEX MLT MNG MOZ MYS NER NGA NIC NLD NOR NPL NZL PAK PAN PER PHL PNG POL PRT PRY ROM RUS SEN SGP SLB SLE SLV SVN SWE TGO THA TUR TWN UGA UKR URY USA UZB VEN VNM ZAF ZAR ZMB ZWE coeff: .923 fit: .387 0 1 5 10 50 100 500 2000 N u mb e r o f ca mp a ig n s fro m e a ch co u n try 500 5000 50000 Average GDP per capita 2010-2015
ARG AUS AUT BEL BGD BGR BLR BOL BRA CAN CHE CHL CHN CMR COL CRI CZE DEU DNK DOM DZA ECU EGY ESP ETH FIN FJI FRA GBR GEO GHA GRC GRL GTM HKG HND HRV HTI HUN IDN IND IRL ISL ISR ITA JPN KEN KHM KOR LBR LKA LTU LUX MAR MEX MLT MMR MNG MOZ MYS NCL NER NGA NIC NLD NOR NPL NZL PAK PAN PER PHL PNG POL PRT PRY ROM RUS SEN SGP SLB SLE SLV SVN SWE TGO THA TUR TWN UGA UKR URY USA UZB VEN VNM ZAF ZAR ZMB ZWE coeff: .512 fit: .141 0 1 2 10 50 100 300 N u mb e r o f ca mp a ig n s o ri g in a ti n g i n . .. 1 10 50 1000 Average population 2010-2015 [mio inhabitants]
the number of potential donators. The fact that both have a different impact on the supply of activism certainly suggests that this is a case of a non-homothetic demand11.
3.2 Where are the targets ?
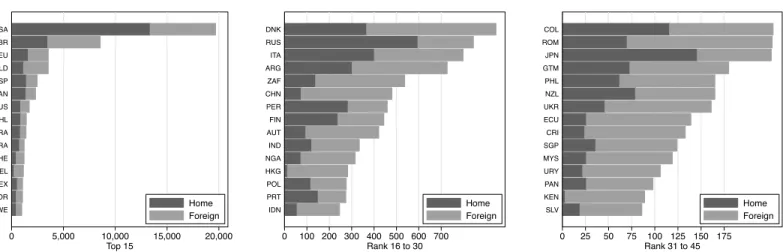
In section 2, table 1, we introduced descriptive statistics regarding the motivations of NGOs confronted to target firms originating from different countries. We provide an additional stylized fact on the nationality of the target firm in Figure 7, which separates the total number of campaigns published in each country in two groups, showing the share of home campaigns for each source country. The numbers are slightly lower than in table 1, in which we computed the share of each NGO’s campaigns directed abroad: NGOs targeting only abroad, even appearing a small number of times, contributed to increase the share of foreign campaigns.
• Fact 7: On average, 35% of a country’s activists campaigns are directed at domestic firms. 11
Figure 7: Number of outward campaigns, with home or foreign target 0 5,000 10,000 15,000 20,000 Top 15 SWE NOR MEX BEL CHE BRA FRA CHL AUS CAN ESP NLD DEU GBR USA Home Foreign 0 100 200 300 400 500 600 700 Rank 16 to 30 IDN PRT POL HKG NGA IND AUT FIN PER CHN ZAF ARG ITA RUS DNK Home Foreign 0 25 50 75 100 125 150 175 Rank 31 to 45 SLV KEN PAN URY MYS SGP CRI ECU UKR NZL PHL GTM JPN ROM COL Home Foreign
Numbers do not comprise campaigns by international NGOs
In Figure 7, on average, 35 % of a country’s campaigns are self-directed. Belgium reports 23% of its campaigns on domestic firms, Luxembourg 25, Netherlands and South-Africa respectively 27 and 29, whereas the US targets home firms in 67% of the cases, Japan 65 %, Brazil 62% and France 53%. The number of bilateral campaigns, home or foreign-directed, will be our explained variable in the gravity estimations. We now present the empirical model.
4
Empirical model
This section outlines the main ingredients of the interaction between an NGO and the set of target corporations. We assume that each NGO has a utility function associated with a campaign against a given firm. The NGO chooses the firm which maximizes its expected payoff. We assume that the elements of this payoff relate to how well the audience of the NGO knows the firm and the action country illustrating the campaign. We show that the country-level model of campaigns contains the essential elements of a gravity equation. This allows to estimate the effects of proximity between countries on the number of campaigns using the best practices developed in the gravity literature.
4.1 NGO payoff
While we do observe the individual choices of the NGOs, we lack information on the individual characteristics of these NGOs and firms. We thus aggregate the data at the triadic NGO-firm-action country level, where our explanatory variables are observed. Before, let us briefly imagine the microfoundations in terms of NGO behavior that could have led to the aggregated estimable
equation.
In line with the World Bank’s definition of advocacy NGOs12, the purpose of activists is to ‘defend or promote a specific cause’. In academic terms, the NGO is an entity that is mission-oriented, following Besley and Ghatak (2005). This means that there is an objective beyond monetary income, whose success is valued in the first place: the mission of NGOs is focused on preserving a human or natural resource (human rights, gender equality, the environnement, etc...). To defend its cause, the activist denounces firms which have acted unethically, and formulates a campaign in which pressure is put on the firm with the objective of having her change her behavior. Assume an NGO which faces a set of firms in a given industry, and selects one of them at which it will direct its campaign.
Which are the determinants of the choice of target? We focus on the reasons explaining the higher vulnerability of the firm for the NGO, and the reasons explaining that the NGO hears about the firm acting unethically. We set aside the reasons explaining the behavior of the firm and assume that firms in the choice set have all acted unethically. This is in line with the construction of our database, which contains exclusively firms that have been the object of at least one campaign and thus all have been denounced for a damageable behavior. Determinants for both hearing about the event and choosing one of the firms are described by the utility of the NGO associated with each potential target. In order to detail the utility function of the NGO, let us introduce subscripts. A firm f is characterized by two countries: the country j of its headquarter, and the country k in which the reported damage has taken place, i.e. the action country. Campaigning on target f (jk) provides total utility yn(i)f (jk) to an NGO n located in
country i. To the eyes of the researcher, the utility that the NGO retains from the campaign contains a common and an individual-specific part. Total utility writes as follows:
yn(i)f (jk)= Vijk+ en(i)f (jk) (1)
The individual, non-observable component of utility are the bilateral idiosyncrasies of the NGO-target pair. Let Vijk be the common payoff of the NGO from revealing the behavior of firm in
jk to the audience in i. Vijk represents the net success of the campaign towards a firm in jk.
To obtain a functional form for estimation, we assume that the random component of the NGO’s payoff follows a type-I-extreme-Value distribution. The probability that an NGO chooses firm jk, headquartered in country j, with unethical activities in country k, can be written as follows: Pijk = exp(Vijk) P j P kexp(Vijk) (2) With a large enough number of symmetric NGOs, the observed share of any firm jk in the 12http://documents.worldbank.org/curated/en/814581468739240860/pdf/multi-page.pdf
total number of campaigns published by country i is equal to Pijk: ncijk N Ci = P exp(Vijk) j P kexp(Vijk) = Pijk, (3)
where ncijk is the number of campaigns from i towards a firm in jk. Assuming that all firms
in jk depend on the same observable attributes, the sum of individual shares over all available firms in jk equals the share of campaigns from i that target jk:
shareijk =
N Cijk
N Ci
= Njk× Pijk, (4)
where N Cijk = Njk× ncijk and Njk is the total number of firms with common attributes jk.
4.2 Gravity equation for campaigns
Using equations (2) and (4), it is straighforward to obtain the number of campaigns from country i directed at pair jk, which represents the demand for facts and information emanating from activists in country i, regarding j firms’ behavior in country k:
N Cijk = Njk exp(Vijk) P j P kexp(Vijk) × N Ci. (5)
Equation (5) bears all the characteristics of a gravity equation, traditionally used to explain the flow of goods: in the case of campaigns, origin ( N Ci
P
j
P
kexp(Vijk)) and destination-specific vari-ables (Njk) multiply with bilateral determinants contained in Vijk to explain the total number
of campaigns between i and jk. Indeed following the Handbook chapter on gravity equations for trade in goods by Head and Mayer (2014), unilateral (monadic) and bilateral (dyadic) de-terminants enter multiplicatively the structural definition of gravity as follows: Xni= SiMnφni,
in which Xni represents trade flows from exporting country i to importing country n. Imports
of goods are a function of the supply capacity of the origin country Si, the attributes of demand
in the destination country Mn, and the trade-facilitating, or trade-hindering elements that are
specific to the country pair, φni. In equation (5), the capacity to ‘produce’ facts and damages
is given by Njk, the characteristics of the firm and action countries. The demand term contains
in the numerator the total number of campaigns written in i (N Ci), weighted by the set of
available inputs for campaigns in all jk country pairs. The bilateral determinants contained in Vijk are the effects of proximity variables on the number of campaigns between countries, and
are our main variables of interest.
Originally gravity equations started as an empirical tool to estimate the determinants of trade flows, introduced in economics by Tinbergen (1962) to investigate the effects of Common-wealth preferences on trade. Since then it has become the main empirical tool to estimate the
efficacy of various trade policies in promoting trade13. Theoretical micro-foundations for the gravity equation evolved in parallel to these empirical developments, leading trade theorists to establish the generality of gravity predictions. Mostly interesting for our case, other types of bilateral flows and interactions have been analyzed with gravity modeling tools: Head et al. (2009) for example model gravity on service offshoring, Anderson (2011) develops a gravity model for migrations; and Head and Ries (2008) and De Sousa and Lochard (2011) estimate bilateral FDI flows with a gravity equation.
The parallel between the number of bilateral campaigns and the now mature gravity litera-ture in trade is of particular importance since it provides us with the best practices to estimate the effect of bilateral frictions on the number of campaigns. The presence of multiple countries in the decision to select a target for each campaign suggests that our triadic gravity equation features both pairs of bilateral links in the role of frictions to the flow of campaigns. Mod-eling triadic gravity is relatively new, currently two papers in the literature estimate gravity equations involving three countries: Arkolakis et al. (2013) develop a trade model with multi-national production. Their calibrated gravity equation explains the sales of firms which may outsource production and sell in a third country. Head and Mayer (2015) analyze the impact of bilateral frictions affecting firms’ choices on detailed data from the car manufacturing industry disentangling the headquarter, production, and sales locations of firms.
4.3 Determinants of campaigns
The next step is to specify the determinants of Vijk, the component of an NGO’s utility that
derives from common attributes perceived by audience in i about target firms in jk. The literature on NGO-firm interactions traditionally models the net utility of a campaign as an increasing function of its donations-generating ability (see for example Lenox and Eesley (2009)). In line with the literature we assume that Vijkcontains the factors that attract private donations
from individuals, which eventually increase respectability and further contributions from the governement. Specifically, we assume that the factors raising consumers’ willingness to give in the country of origin of the NGO are related to the proximity between the two pairs of countries involved in the campaign: NGO-firm countries and NGO-action countries. The following details the context in which donations to activists arise.
The NGO is pictured as supplying donors with additional information on firms’ products. Donors learn about the production process of the good or about the impact of the product on the environment and health, which they could not do without the NGO’s intervention14. 13Examples include policy decisions such as regional agreements (Baier and Bergstrand (2007), Lim˜ao (2016)), or currency unions (Rose (2000)). With the same method, the literature also analyzed the effect of long-run determinants of trade flows: geographical proximity Disdier and Head (2008), cultural proximity (Felbermayr and Toubal (2010)), common language (Melitz and Toubal (2014))
14
Note that credence goods need the intervention of institutions or other agents to solve the asymetry of information, while for experience goods, the quality is known after consumption: see Bagwell and Staiger (1989),
Further, they associate their donations with helping reduce the damage brought to light by the campaign, and hence solutionate the problem.
The literature on charitable giving highlights two main motivations for private giving (sur-veyed in Andreoni (2006)), which are known as the “warm-glow” (utility to one-self) and the “public good” (utility to the helped). Applied to the international context of giving overseas for development, Atkinson (2009) combines the two and models an ‘identification’ reason, stating that donors are encouraged by development charities to identify on a one-to-one basis with the situation of recipients. We adapt this definition to the case of advocacy, and assume that NGOs must capture the attention of the audience in order to receive funding. We assume that the attention of the audience is maximized when they are familiar with the target, or when they identify with the cause that is being hurt. To represent this proximity we use bilateral variables measuring the links between the NGO and the firm country, and between the NGO and the action country 15, as follows:
Vijk= β2ln Xij + β3ln Xik+ uijk (6)
Xij and Xik are variables capturing how well the audience knows the target and the action
coun-tries. They include geographical, cultural and historical proximity variables, with the underlying assumption that the stronger the links between a pair of countries, the higher the propensity of the audience to donate. uijk is an unobservable component of the common attributes of a
campaign which varies with the triad.
4.4 Specification
Taking logs and incorporating equation(6), equation (5) writes:
ln (N Cijk) = β1ln Njk+ β2ln Xij + β4ln Xik+ β3ln
N Ci
P
jk(Xij.Xik)
+ uijk (7)
Our principal variables of interest are the bilateral links between the NGO country i and respec-tively the country j of the firm (Xij) and the country k of the action (Xik). It should be clear at
this point that if individual-level data were available we would measure the attention-capturing capacity of the target firm by a variable of firm visibility. Firm size is the most straightforward candidate to capture the propensity to donate for a campaign that goes after her: consumers donate to generate changes in the firm’s behavior on the product they know. The measure of Cag´e and Rouzet (2015)
15While the fundraising potential of a campaign is usually modeled in the literature, not all papers detail the mechanism by which individuals increase their donations. Krautheim and Verdier (2016) indicate that ‘consumers can be more easily convinced to donate if the campaigns goes against a firm they know well’ (p.33). Lenox and Eesley (2009) explain that large and visible firms are more likely to gather attention from the media and the general public, however they don’t detail the mechanism leading to increased donations.
absolute firm size however raises some issues in the case of firms that are large, but unknown from the audience (the largest private car-maker in China is named Geely ... and remains anonymous to western consumers16). The ideal variable, which is currently not available for all firms, would be the firm’s market or investment share in the NGO’s country. Consumers donate when they know the brand, which happens when local sales (alternatively local employment) are high. Note that identifying target firms by their local market share echoes the theoretical literature which models the fact that donors are more receptive to campaigns about targets that sell or invest locally: Baron (2016) introduces the concept of firm “vulnerability”, which represents how susceptible the firm is to social pressure or to a campaign. Firm vulnerability corresponds to “the ease of damaging a firm’s reputation, brand equity, or employee morale”17.
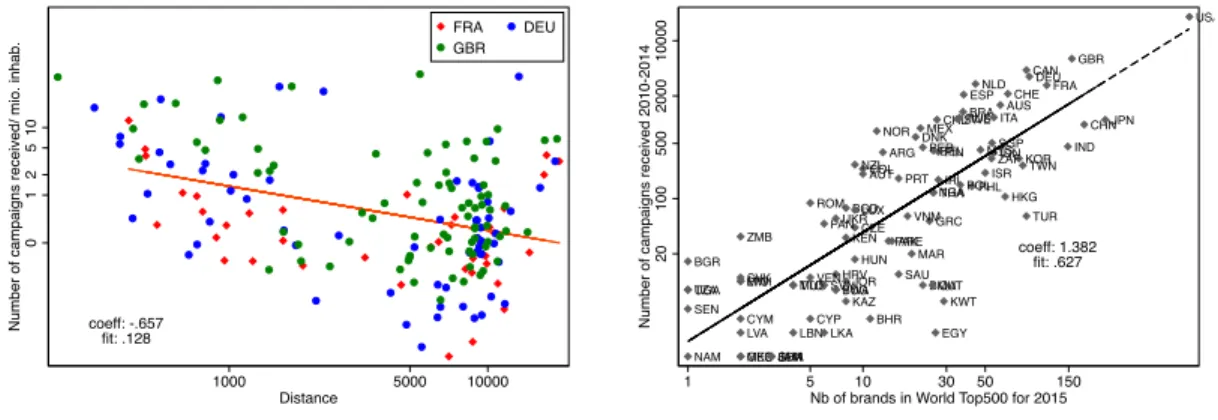
Let us come back to equation (7), which we estimate using country-level variables (see Appendix for the variable description). Bilateral observables between the NGO and the firm country include geographical distance Distij: shorter routes are expected to increase the number
of campaigns between i and j, reflecting the higher probability that the audience is familiar with the firms’ products. A similar role is attributed to historical and cultural proximity Colonyij
and Langij: Sharing a colonial past increases the awareness and knowledge of citizens about the
foreign country. So acts the number of migrants, measuring proximity by the interconnectedness of the people. The migration variable is computed as the number of people born in j that reside in i.
One of our visibility variables could not be obtained as a bilateral observable, hence we use the unilateral counterpart: the unilateral variable Brandsj captures firm visibility, it contains
the number of brands per target country in the world top500. It is the country-specific measure of “how well” the domestic audience of the NGO is familiar to the target and reacts to the news. We expect the number of campaigns to be higher, the more important is the brand reputation of a country’s firms. Note that choosing a large firm may be an equilibrium solution for the NGO for two other but minor reasons. First, the NGO’s objective function surely contains a part of intrinsic satisfaction related to its watchdog activity: the NGO prefers to face an important target firm, hence to be confronted with a multinational. Examples include Baby Milk Action, which proudly states on its website ’We are holding some of the world’s most powerful corporations to account’18, and Food and Water Watch, which argue “We are
taking on some of the biggest corporations in the world like Exxon-Mobil and Monsanto”19. Second, besides the “David and Goliath” effect, reasons for favoring large companies include the magnitude of expected change on the cause: a change in behavior by a firm selling or producing a large number of items tends to correct the problem on a broader scale. The leading company
16 http://www.lemonde.fr/idees/article/2010/02/01/le-chinois-geely-rachete-volvo-un-cas-d-ecole-par-joel-ruet_ 1299441_3232.html 17 Baron(2016), page 6 18 http://www.babymilkaction.org/donate 19 http://www.foodandwaterwatch.org/about/monthly-giving
is also expected to be an example for the rest of the industry.
Bilateral Xik variables measure the intensity of bilateral links between the audience country
and the action country, and thus the identification of donors to the cause that is denounced in the campaign. At the country-level, everything equals, we expect the number of campaigns to be higher, the shorter is Distik. Similarly, we expect that action countries that share(d) a
colonial link with the home country (Colonyik), that host a number of foreign-borns from k
(M igrationik), or that share the same language (Langik), to be more likely chosen as targets.
Finally, note that we cannot eliminate the possibility that bilateral variables capture both the reasons explaining that the NGO chooses a specific firm to report on (the gain) and the reasons explaining that the NGO investigates a given firm (hence the cost of the campaign). Indeed the cost related to send professionals abroad to investigate about the way firms organize outsourcing, or about the consequences of trade for given products, could be proportional to geographical distance for example. We deal with this possibility in section 6.3.
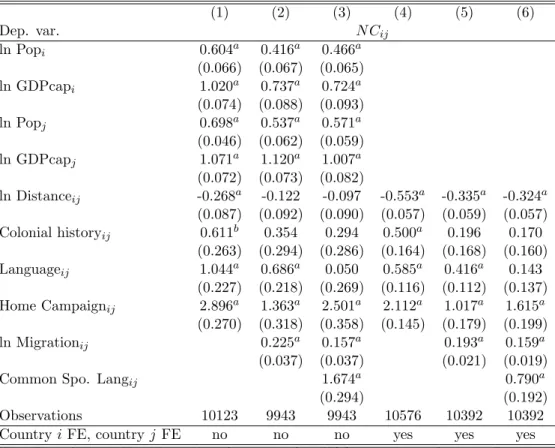
Unilateral country-level variables capture the general level of campaigning activity that is expected from and towards each country. Our preferred estimations are run with fixed-effects for respectively country i and the pairs jk, which take into account all potential determinants of the level of outward and inward campaigning. The unilateral variables are thus captured by these fixed-effects. We explain more about the use of the fixed-effects and the link with theory in section 4.5. Nevertheless, as usual in gravity estimations, we provide basic estimates based on unilateral country-level variables before using the fixed-effects. These estimations use the following separate country variables for i, j, and k: we expect the number of outward campaigns to be influenced by the size and the income of countries: the more the source country is populated, the more there will be NGOs standing up for a cause. Rich countries with more regulated markets are likely to host more NGOs than developing countries. We include the size of the source country (popi) and its revenue (GDP capi). Variables relative to the target country
capture the number of target firms located in country j. We include the country size (popj) and
revenue (GDP capj). A larger country will host more producers and hence more possibilities to
be a target. Income is expected to affect positively the number of campaigns, as richer countries tend to host a larger number of firms having international production and selling activities.
Variables Xk relative to the action country represent the characteristics of countries hosting
the actions giving rise to reports from activists. We include (popk) and (GDP capk), the size
of the action country and thus a measure of the overall activity. Countries hosting resources used in production and preserved by activists (workforce, natural resources) are more likely to receive a large number of campaigns. We include the share of the country’s revenue coming from natural resources (oil, natural gas, coal, minerals, forests). Finally, the two home dummies separate the campaigns targetting domestic firms from the ones involving a foreign country. Homeij is set to 1 whenever the target firm is headquartered in the same country as the NGO,